HAL Id: cea-02121632
https://hal-cea.archives-ouvertes.fr/cea-02121632
Submitted on 20 May 2020
HAL is a multi-disciplinary open access
archive for the deposit and dissemination of
sci-entific research documents, whether they are
pub-lished or not. The documents may come from
teaching and research institutions in France or
abroad, or from public or private research centers.
L’archive ouverte pluridisciplinaire HAL, est
destinée au dépôt et à la diffusion de documents
scientifiques de niveau recherche, publiés ou non,
émanant des établissements d’enseignement et de
recherche français ou étrangers, des laboratoires
publics ou privés.
From identification to functional characterization of
cyriotoxin-1a, an antinociceptive toxin from the spider
Cyriopagopus schioedtei
Tânia C. Gonçalves, Evelyne Benoit, Michael Kurz, Laetitia Lucarain, Sophie
Fouconnier, Stéphanie Combemale, Lucie Jaquillard, Brigitte Schombert,
Jean-marie Chambard, Rachid Boukaiba, et al.
To cite this version:
Tânia C. Gonçalves, Evelyne Benoit, Michael Kurz, Laetitia Lucarain, Sophie Fouconnier, et al..
From identification to functional characterization of cyriotoxin-1a, an antinociceptive toxin from the
spider Cyriopagopus schioedtei. British Journal of Pharmacology, Wiley, 2019, 176 (9), pp.1298-1314.
�10.1111/bph.14628�. �cea-02121632�
BJP
R E S E A R C H P A P E R
From identification to functional characterization of
cyriotoxin
‐1a, an antinociceptive toxin from the spider
Cyriopagopus schioedtei
Tânia C. Gonçalves
1,2|
Evelyne Benoit
2,3|
Michael Kurz
4|
Laetitia Lucarain
1|
Sophie Fouconnier
1|
Stéphanie Combemale
5|
Lucie Jaquillard
5|
Brigitte Schombert
1|
Jean
‐Marie Chambard
1|
Rachid Boukaiba
1|
Gerhard Hessler
4|
Andrees Bohme
1|
Laurent Bialy
4|
Stéphane Hourcade
6|
Rémy Béroud
5|
Michel De Waard
5,7|
Denis Servent
2|
Michel Partiseti
11
Integrated Drug Discovery—High Content Biology, Sanofi R&D, Vitry‐sur‐Seine, France
2
Service d'Ingénierie Moléculaire des Protéines (SIMOPRO), CEA, Université Paris‐Saclay, Gif‐sur‐Yvette, France
3
Institut des Neurosciences Paris‐Saclay (Neuro‐PSI), UMR CNRS/Université Paris‐Sud 9197, Université Paris‐Saclay, Gif‐sur‐Yvette, France
4
Integrated Drug Discovery—Synthetic Molecular Design, Sanofi R&D, Frankfurt, Germany
5
Smartox Biotechnology, Saint‐Egrève, France
6
Neuroscience Therapeutic Area, Neurodegeneration Research, Sanofi R&D, Chilly‐Mazarin, France
7
Institut du Thorax, Inserm UMR 1087/CNRS UMR 6291, LabEx“Ion Channels, Science and Therapeutics”, Nantes, France
Correspondence
Denis Servent, Service d'Ingénierie Moléculaire des Protéines (SIMOPRO), CEA, Université Paris‐Saclay, F‐91191 Gif‐sur‐Yvette, France. Email: denis.servent@cea.fr
Michel Partiseti, Integrated Drug Discovery— High Content Biology, Sanofi R&D, F‐94440 Vitry‐sur‐Seine, France.
Email: michel.partiseti@sanofi.com Funding information
Sanofi Research & Development (Chilly ‐Maza-rin, France), Grant/Award Number: #153114; French Alternative Energies and Atomic Energy Commission (CEA, Gif‐sur‐Yvette, France; Agence Nationale de la Recherche, Grant/ Award Number: ANR‐11‐LABX‐0015
Background and Purpose:
The Na
V1.7 channel is highly expressed in dorsal root
ganglia of the sensory nervous system and plays a central role in the pain signalling
process. We investigated a library prepared from original venoms of 117 different
animals to identify new selective inhibitors of this target.
Experimental Approach:
We used high throughput screening of a large venom
col-lection using automated patch
‐clamp experiments on human voltage‐gated sodium
channel subtypes and then in vitro and in vivo electrophysiological experiments to
characterize the active peptides that have been purified, sequenced, and chemically
synthesized. Analgesic effects were evaluated in vivo in mice models.
Key Results:
We identified cyriotoxin
‐1a (CyrTx‐1a), a novel peptide isolated from
Cyriopagopus schioedtei spider venom, as a candidate for further characterization. This
33 amino acids toxin belongs to the inhibitor cystine knot structural family and
inhibits hNa
V1.1
–1.3 and 1.6–1.7 channels in the low nanomolar range, compared
to the micromolar range for hNa
V1.4
–1.5 and 1.8 channels. CyrTx‐1a was 920 times
more efficient at inhibiting tetrodotoxin (TTX)
‐sensitive than TTX‐resistant sodium
currents recorded from adult mouse dorsal root ganglia neurons and in vivo
electro-physiological experiments showed that CyrTx
‐1a was approximately 170 times less
efficient than huwentoxin
‐IV at altering mouse skeletal neuromuscular excitability
properties. CyrTx
‐1a exhibited an analgesic effect in mice by increasing reaction time
in the hot
‐plate assay.
Conclusions and Implications:
The pharmacological profile of CyrTx
‐1a paves the
way for further molecular engineering aimed to optimize the potential antinociceptive
properties of this peptide.
Abbreviations: CMAP, compound muscle action potential; CyrTx‐1a, cyriotoxin‐1a; DRG, dorsal root ganglia; HwTx‐IV, huwentoxin‐IV; ICK, inhibitor cystine knot; NaSpTx, NaVchannel spider
toxin; TTX, tetrodotoxin; TTX‐R, resistant to tetrodotoxin; TTX‐S, sensitive to tetrodotoxin; U2OS cell line, human bone osteosarcoma epithelial cell line
1
|I N T R O D U C T I O N
Sensory neurons express many transmembrane proteins that are ther-apeutic target candidates for the treatment of pain. In particular, inhib-itors of ion channels (such as voltage‐gated sodium [NaV] and calcium [CaV] channels, transient receptor potential channels, acid‐sensing ion channels, piezo proteins, and ionotropic P2X receptors), as well as potassium channel (KV) enhancers, are being investigated as potential analgesics (Bennett & Woods, 2014; Waxman & Zamponi, 2014). NaV
channels include nine subtypes (NaV1.1–1.9), each of them having
dif-ferent functions due to specific expression patterns and/or singular biophysical properties (Catterall, Goldin, & Waxman, 2005; de Lera Ruiz & Kraus, 2015). During this last decade, attention has been given to several NaVchannel subtypes (NaV1.1, 1.3, and 1.6–1.9) as
poten-tial analgesic targets (Cardoso et al., 2017).
Among these NaVchannels, theNaV1.7channel seems to be one of the most interesting target to treat chronic debilitating pain (Vetter et al., 2017). Indeed, this subtype is highly expressed in the sensory nervous system, principally in small and large dorsal root ganglia (DRG) neurons, the anatomical support of pain signalling from the skin and organs to the spinal cord (Dib‐Hajj, Yang, Black, & Waxman, 2013). Furthermore, a multitude of genetic mutations of the NaV1.7
protein are linked to painless or painful phenotypes (de Lera Ruiz & Kraus, 2015; Vetter et al., 2017). Moreover, it is well established that low MW compounds that target NaVchannels, such as tetrodotoxin
(TTX), attenuate chronic and debilitating pain in humans (Hagen et al., 2017). However, pronounced side effects have been described, such as nausea, dizziness, oral numbness, and tingling, due to a lack of selectivity (Hagen et al., 2017). The current challenge is thus to iden-tify a new therapeutic class of analgesic molecules that blocks the NaV1.7 channel with high selectivity compared to other NaVchannels,
particularly theNaV1.5and theNaV1.6and1.4channels, because of cardiac and neuromuscular safety issues, respectively.
Several peptide toxins from animal venoms (spiders, scorpions, cone snails, sea anemones, centipedes) have been reported to block or modulate NaV channel function (Israel, Tay, Deuis, & Vetter,
2017). Some of them, mainly isolated from spider venoms, showed promising selectivity for NaV1.7 channels (Vetter et al., 2017). Their
sequence is mostly composed of 30–35 amino acids, including three disulfide bridges with an inhibitor cystine knot (ICK) motif. These pos-itively charged toxins are gating‐modifier peptides that bind to the receptor sites 3 (on Domain IV) and/or 4 (on Domain II) of NaV
chan-nels, inducing variable pharmacological effects in in vitro tests and in vivo pain models (Saez et al., 2010). For instance, huwentoxin‐IV (HwTx‐IV) and the tarantula toxin GpTx‐1, two well‐characterized NaV1.7 channel‐blocking spider toxins with high selectivity over
NaV1.4 and NaV1.5 channels, have analgesic properties in animal
models. However, they also produce strong side effects such as inac-tivity, paralysis, and death in standard pain tests in rodents, due to the lack of selectivity over the NaV1.6 channels (Deuis et al., 2016;
Gonçalves, Boukaiba, et al., 2018). Other spider toxins, such as protoxin‐II, exhibit a 100‐fold higher potency on NaV1.7, compared
with all NaVchannels, except for NaV1.6 channels. Interestingly, the
in vivo safety margin of this toxin is increased for the mutant peptide JNJ 63955918, due to an improved selectivity againstNaV1.1, 1.2, and 1.6 channels (Flinspach et al., 2017). Very recently, the Jingzhaotoxin‐V analogue AM‐8145 was reported to display a more than 100‐fold higher potency on NaV1.7 compared to all NaVchannels
(Moyer et al., 2018).
The present work reports the identification, structural characteri-zation, and pharmacological profile of the first toxin (CyrTx‐1a) iso-lated from the venom of Cyriopagopus schioedtei spider, using a high throughput electrophysiological screening assay on NaVchannels. This
ICK toxin is shown to possess nanomolar range affinity for NaV1.1–
1.3, 1.6, and 1.7 channels and micromolar affinity for other channel subtypes and to exhibit analgesic effects in rodent pain models. It rep-resents an interesting lead for new analogues designed to exhibit a better therapeutic window.
2
|M E T H O D S
2.1
|Isolation and purification of CyrTx
‐1a
A library was prepared from 117 different animal venoms by crude venom fractionation using an analytical RP‐HPLC C18 column (XBridge™ BEH 130, 3.5 μm and 4.6 mm ID × 250 mm L column) attached to an Agilent 1260 HPLC (Agilent Technologies). Primary fractions were first evaluated in a functional screening assay on an engineered HEK‐293 cell line (RRID:CVCL_0045) overexpressing human (h) NaV1.7 and hNaV1.5 channels using the IonWorks Quattro
platform (Molecular Devices, USA). For instance, the C. schioedtei spi-der venom, one of the venoms of interest, was separated into frac-tions that contained between 5 and 15 peptides each at an estimated concentration of 0.5μg·μl−1. Active fractions were finally subfractionated using cation exchange chromatography with a TOSOH Bioscience column (TSK gel SP‐STAT, 7 μm, 4.6 mm ID × 10 cm L, TOSOH Bioscience, Germany) onto an Agilent 1260 HPLC (Agilent Technologies) to individualize the compounds. The purified com-pounds were screened on HEK‐293 cells overexpressing hNaV1.7,
hNaV1.2, hNaV1.5, and hNaV1.6 channels, using the QPatch
HTX automated electrophysiology platform (Sophion BioScience, Denmark), leading to the identification of CyrTx‐1a as one of the pep-tides of interest.
2.2
|Amino acid sequencing of CyrTx
‐1a
The peptide amino acid sequence was determined by de novo MS/MS sequencing and Edman degradation. The purified venom peptide obtained after successive RP‐HPLC and cation exchange chromatog-raphy, from a starting material of 2 mg, was resuspended in 100 mM ammonium bicarbonate (pH 8), reduced with 17 mM tris(2‐ carboxyethyl)phosphine hydrochloride (incubated at 55°C for 1 hr) and alkylated with 24 mM iodoacetamide (incubated at room temper-ature in the dark for 1 hr) prior to enzyme digestion. The reduced/alkylated venom peptide was digested by using trypsin or
V8 proteases. The enzyme was added at a 1:10 ratio (enzyme/peptide, w/w) and incubated overnight at 37°C before LC–MS analyses.
A Waters Q‐TOF Xevo G2S mass spectrometer equipped with an Acquity UHPLC system and Lockspray source was used for the acquisition of the LC–ESI–MS and LC–ESI–MS/MS data and the amino acid sequence determination based on Edman degradation was performed using an Applied Biosystems gas‐phase sequencer model 492 (s/n: 9510287 J). These protocols are detailed in the Supporting Information.
2.3
|Chemical synthesis and folding of CyrTx
‐1a
CyrTx‐1a was assembled stepwise using 2‐chlorotrityl chloride resin (substitution rate of 1.6 mmol·g−1) by solid‐phase fmoc chemistry on a Symphony Synthesizer (Protein Technologies Inc.). Amino acid pling reaction was 15 min (repeated three times to increase the cou-pling yield). After resin cleavage and deprotection with 92.5% (vol) TFA, 2.5% H2O, and scavengers (1,3‐dimethoxybenzene [2.5%] and
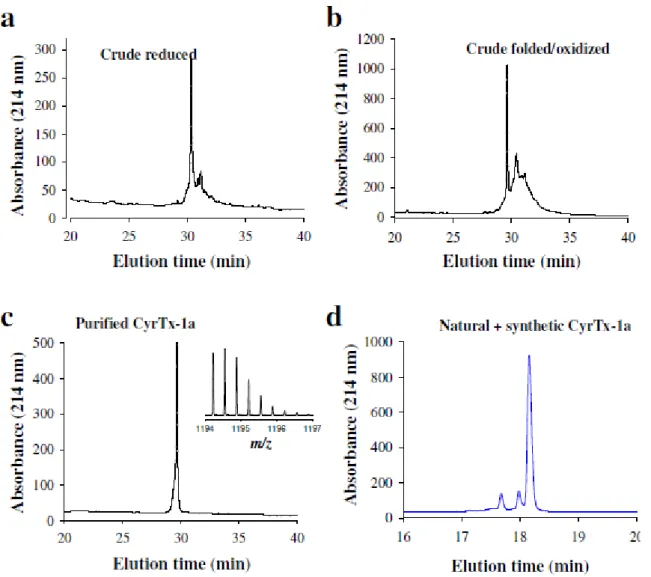
triisopropylsilane [2.5%]), the peptide was purified to homogeneity by C18 RP‐HPLC on a Jupiter Proteo column (Phenomenex, 4 μm, 21.2 mm ID × 250 mm L) using an Agilent Technologies preparative HPLC (1260 Infinity). Finally, CyrTx‐1a was folded/oxidized in 50 mM Tris–HCl, pH 8.3 during 72 hr. The resulting oxidized CyrTx‐ 1a with its three disulfide bridges was purified to homogeneity (>99% purity according to the integration of the purified chromato-gram peak at 214 nm) using RP‐HPLC with the Jupiter Proteo column. The molecular mass of CyrTx‐1a was determined by LC–ESI–QTOF MS. The absence of contaminant masses attested to the purity of syn-thetic CyrTx‐1a.
2.4
|3D structure of CyrTx
‐1a
The structure of CyrTx‐1a was determined by high‐resolution NMR spectroscopy in aqueous solution (10% D2O) of 6 mg·peptide ml−1in
50 mM phosphate buffer at pH 5.0 and a temperature of 305°K. Data were obtained on a Bruker Avance 700 MHz using standard 2D spec-tra. Resonances were assigned with 2D spectra including DQF‐COSY, TOCSY, NOESY,1H
‐13C
‐HSQC, and 1H
‐15N
‐HSQC. For conforma-tional analysis, NOE‐based distance restraints were obtained from a NOESY spectrum with 200 ms mixing time. Four hundred thirty‐one distance restraints were used in a simulated annealing protocol starting from a linear, extended structure including 71 intra‐residual distances, 126 sequential distances, 69 medium distances (two to four amino acids apart), and 165 long range distances (>4 amino acids apart). Calculations were performed with the software package SYBYL version 2.1.1. All energy calculations were based on AMBER7 F99 force field. Distance restraints for non‐separated methylene protons and methyl groups were used with pseudoatom correction: 0.9 Å were added to the upper bound for methylene groups, 1.0 Å was added for methyl groups. Twenty structures were obtained which converged well. The rmsd over all backbone atoms was 0.465 ± 0.285 Å.
2.5
|Toxins used for functional assays
Lyophilized synthetic CyrTx‐1a (molecular mass of 3578.68, purity rate > 97%), lyophilized synthetic HwTx‐IV, molecular mass of 4106.811, purity rate > 97%; Smartox Biotechnology, Saint‐Egrève, France), and TTX citrate (molecular mass of 319.27, purity rate > 98%; Sigma‐Aldrich, Saint‐Quentin Fallavier, France) were dissolved in PBS (1×) solution to give stock solutions of 6.8, 6.1, and 2.85 mM, respec-tively. Successive dilutions were then performed in the different stan-dard physiological media, prior to experiments.
2.6
|Cell lines used for functional assays
Generation of inducible cell lines was achieved using the Flp‐In®T
‐Rex®
or Jump‐In® T‐Rex® expression system (Invitrogen, USA). For this
purpose, cDNAs encoding for hNaV1.5 (NM_000335), hNaV1.2
(NM_021007.2), hCaV3.1 (NM_018896.4), and hCaV3.2
(NM_021098.2) were cloned into the Flp‐In® T
‐Rex® expression
vector and subsequently transfected into HEK‐293 or CHO cell line (RRID:CVCL_0213), using the FuGENE® transfection reagent
(Promega, France). The cDNA encoding for hKV7.1 (NM_000218.2)
was cloned into the Jump‐In®T
‐Rex®expression vector and
subse-quently transfected into human bone osteosarcoma epithelial (U2OS) cell line (RRID:CVCL_0042), using the FuGENE® transfection
reagent. Recombinant HEK‐293 cell lines stably overexpressing hNaV1.7, 1.1, and 1.8 channels were purchased from Eurofins (St.
Charles, MO, USA), those for stably overexpressing hNaV1.6
chan-nels from ChanTest (Cleveland, OH, USA), and those stably overex-pressing hNaV1.3 and 1.4 channels from SB Drug Discovery (UK).
Cells overexpressing hNaV1.7 channels were cultured in suspension
in FreestyleTM293 (Gibco, Thermo Fisher Scientific, Villebon‐sur‐ Yvette, France). Those overexpressing hNaV1.2 and 1.5 channels
were cultured in DMEM with GlutaMAX™supplement (Gibco), those overexpressing hNaV1.1, 1.6, and 1.8 channels were cultured in
DMEM/F12 with GlutaMAX™supplement (Gibco), while those over-expressing hNaV1.3 and 1.4 channels were cultured in minimum
essential medium (Sigma). In‐house U2OS‐Jump‐In‐T‐REx cells were kept in culture in McCoy's 5A medium with GlutaMAX™supplement (Gibco). CHO cells heterologously overexpressing hCaV1.2/β2/α2δ1 (ChanTest), hCaV3.1 and hCaV3.2 channels were cultured in Ham's F12 nutrient mix with GlutaMAX™ medium (Gibco). Those overex-pressing hKir2.1 channels (ChanTest) were cultured in DMEM/F‐12 Glutamax (Gibco), and those overexpressing hKV11.1 channels (B'SYS GmbH, Switzerland), encoded by the human ether‐a‐go‐go‐ related gene, were cultured in DMEM/F12 nutrient mixture Ham's medium (Sigma). All culture media contained FBS (10%, Gibco) and selected antibiotics and additives, as recommended by the manufac-turer. Cells were grown in flasks, under standard conditions (37°C, air supplemented with 5% CO2), and sub‐cultured/passaged every
3 to 4 days using Accutase® (Sigma) or TrypLE Select (Gibco) as
enzymatic dissociation to detach the cells. At least 12 to 24 hr prior to experiments, doxycycline (BD Biosciences) was added to induce target expression when needed.
2.7
|Animals and primary culture of DRG neurons
used for functional assays
All animal care and experimental procedures in this study complied with the guidelines established by the French Council on animal care“Guide for the Care and Use of Laboratory Animals” (EEC86/609 Council Directive—Decree 2001‐131), and the experimental protocols were approved on November 27, 2015, by the French General Directorate for Research and Innovation (project APAFIS#2671‐ 2015110915123958v3 authorized to E. B.). Animal studies are reported in compliance with the ARRIVE guidelines (Kilkenny et al., 2010) and with the recommendations made by the British Journal of Pharmacology. The experiments were performed using 113 (80 for pain sensitivity assays, 29 for neuromuscular system assay and four for pri-mary cultures of DRG neurons) adult female Swiss mice (Mus musculus, 10–12 weeks of age and 28–32 g body weight; catalogue # APB:8115) purchased from Janvier Elevage (Le Genest‐Saint‐Isle, France). The pro-vider health reports indicated that the animals were free of known viral, bacterial, and parasitic pathogens. The choice of adult Swiss mice was guided by the fact that these outbred animals are more sensitive to morphine than inbred ones (Capasso, Di Giannuario, Loizzo, Pieretti, & Sorrentino, 1994). In addition, taking into account, first, that a clear majority of patients with pain has been reported to be women (Mogil, 2012) and, second, the 3Rs for more ethical use of animals in testing, only female mice were included in our study. The animals were acclimatized for at least 48 hr before experiments at the CEA animal facility. They were housed in a 12‐hr light/dark cycle and controlled temperature room, four to a cage containing bedding and a cardboard tube for environmental enrichment and were allowed free access to water and food. This study was experimentally designed to have equal group sizes of at least 10 animals per group for pain sensitivity assays and at least five animals per group for neuromuscular system assay, with intravenous injection as an exclusion criterion. In addition, randomiza-tion and blinding (the experimenter being blind to treatment group) were undertaken in all animal experiments.
After anaesthesia, with 2.0–2.5% isoflurane inhalation, and killing, by cervical vertebrae dislocation, the DRG were dissected from inter-vertebral foramina of the vertebrate column and enzymically dissoci-ated, as reported previously (Gonçalves, Boukaiba, et al., 2018). The neurons were cultured under standard conditions (37°C, 95% air and 5% CO2) on 12‐mm glass coverslips placed in a 24‐well plate coated
with 100μg·ml−1 of murin laminin and 10μg·ml−1 of poly‐D‐lysine
(Sigma‐Aldrich). The culture medium was composed of a Neurobasal A medium (Gibco) added with Dulbecco's PBS (1×) without CaCl2
and MgCl2 (1.68%; Gibco), BSA (16.83 μg·ml−1; Sigma‐Aldrich),
corticosterone (214.85 nM; Sigma‐Aldrich), T3 hormone (56.06 nM; Sigma‐Aldrich), horse serum (5%; Gibco), penicillin/streptomycin (47.64 U·ml−1; Gibco), nerve growth factor (83.33 ng·ml−1; Sigma‐ Aldrich), N2 supplement (3.18×; Gibco), andL‐glutamine (1.90 mM;
Sigma‐Aldrich). One day later, cytosine β‐D‐arabinofuranoside (2 μM;
Sigma‐Aldrich) was added to the medium to inhibit astrocyte proliferation. Experiments were carried out within 2 to 6 days after neuron dissociation.
2.8
|Electrophysiological recordings
Automated and manual patch‐clamp recordings were performed on cell lines and DRG neurons as described in the Supporting Informa-tion. In vivo recordings from the neuromuscular system of anaesthe-tized mice were performed by using a minimally invasive electrophysiological method and the Qtrac© software (Prof. H. Bostock, Institute of Neurology, London, UK), as detailed previously (Gonçalves, Boukaiba, et al., 2018). By means of a digital‐to‐analogue converter, this software allowed delivering the stimulation sequences to be performed and, in return, recording (at a sampling frequency of 10 kHz) and analysing the compound muscle action potential (CMAP) collected from the stimulated muscle. After being weighed, a given mouse was placed in an anaesthesia‐induction chamber in which a mixture of oxygen (0.4 L·min−1), air (0.2 L·min−1), and isoflurane (AErrane®, Baxter S.A., Lessines, Belgique; 2.0
–2.5%) was diffused. When the mouse was anaesthetised, it was transferred to a heating pad to maintain body temperature throughout the experiments (35.99 ± 0.03°C, as determined in 29 mice using a rectal probe). The animal's muzzle was positioned at the level of a mask where the anaesthetic gas mixture was conveyed to keep the animal anaesthetised. If necessary, the percentage of isoflurane was adjusted to maintain the depth of the anaesthesia. Electrical stimulations were delivered to the caudal motor nerve (at the base of the tail) by two stimulators (A395, World Precision Instruments, Sarasota, FL, USA) via two surface electrodes, and the CMAP was recorded using fine needle electrodes inserted into the tail muscle and connected to an amplifier (Disa EMG 14C13) and then to a hum bug (Quest Scientific). Intramuscular injections (4‐μl maximal volume) of PBS solution with-out (to test for any effect of the vehicle) or with various concentra-tions of CyrTx‐1a or TTX were administered at the base of the tail (between stimulation and ground electrodes) with a 10 μl micro‐ syringe. The toxin and/or vehicle effects on selected excitability parameters, such as the excitability threshold and CMAP amplitude continuously recorded over time, were assessed by online recordings initiated≈5 min before a given injection. The duration of CyrTx‐1a and TTX effects and the identification of the toxin underlying mecha-nism(s) of action were investigated by performing five different excit-ability tests (stimulus–response, strength–duration, and current– threshold relationships, as well as threshold electrotonus and recovery cycle; detailed in Cerles et al., 2017), before and from 30 min to 12 hr after a given injection. More than 30 parameters, providing comple-mentary information on ion channels, receptors, and pumps, as well as on the passive membrane properties of the neuromuscular system (Kiernan & Bostock, 2000; Krishnan, Lin, Park, & Kiernan, 2008), were determined and analysed from these five excitability tests.
2.9
|Heat and tactile pain sensitivity of mice in vivo
Prior to hot‐plate testing, each mouse underwent a 30‐min acclima-tion to the experimental laboratory environment (in its home cage). Then, mice were either not injected or received an intraplantarinjection of 5–10 μl of PBS or toxin solution in each hind paw under low anaesthesia achieved by means of isoflurane (AErrane®, Baxter
S.A.) inhalation. After 60 min rest in its home cage, the mouse was put on the hot‐plate set at the temperature of 55.0 ± 0.2°C. The mea-sured parameter as the first pain‐related manifestation was the latency (in seconds) for the animal either to shake one of its two hind limbs or to jump. This latency, considered as a painful response to heat, was recorded simultaneously by two observers (one being blind to treatment group) with a timer integrated into the set‐up. A maximal cut‐off time of 30 s was used to prevent tissue damage.
Tactile sensitivity was assessed using an automated plantar von Frey apparatus (Dynamic Plantar Aesthesiometer 37450, Ugo Basile, Comerio, Italy). Prior to testing, each mouse was placed on a mesh grid, surrounded by a clear Plexiglas barrier with a top cover and left to calm down for 30 min without probing. After the settling phase, the mouse was motionless allowing for either of its hind limbs to be touched by a flexible plastic fibre of a fixed diameter. The fibre was pressed through the mesh grid against the plantar surface at a right angle, and the force of application increased slowly (at the determined rate of 1.67 g·s−1). The force intensity (in g) at which the animal removed its hind limb was recorded with a timer integrated into the set‐up as the mean of at least four tests. A cut‐off automatically occurred if the animal did not remove its hind limb when the point at which the greatest pre‐set force was met, to prevent tissue damage. The force intensity was determined every 5 min during 30–45 min before and 15 min after intraplantar injection of 5μl of PBS or toxin solution in each hind limb, under mild anaesthesia with isoflurane.
2.10
|Data and statistical analyses
The data and statistical analysis comply with the recommendations of the British Journal of Pharmacology on experimental design and analysis in pharmacology. Sigmoid nonlinear regressions through data points (correlation coefficient = r2) were used to calculate theoretical
concentration–response curves, according to the Hill equation (GraphPad Prism version 5 [RRID:SCR_002798] or QPatch assay soft-ware): Rt/Rc = 1/[1 + ([toxin]/IC50) nH], where Rt/Rc is the response
recorded in the presence of a given toxin (Rt) and expressed as per-centage of the value obtained in absence of toxin (Rc), [toxin] is the toxin concentration, IC50 is the toxin concentration necessary to
inhibit 50% of the response, and nHis the Hill number. The
conduc-tance (g) was calculated from the peak current amplitude (I) according to the following equation: g = I/(VT– VNa), where VTis the test‐pulse
voltage and VNais the equilibrium potential of Na ions. The Boltzmann
equation (GraphPad Prism version 5 software) was used to calculate the theoretical conductance–voltage curves corresponding to data point fit: g/gmax= 1– [1/(1 + exp((VT– VT50%)/kg))], where g/gmaxis
the conductance expressed as percentage of the maximal conductance (gmax) calculated at strongly positive test‐pulses, VT50%is the test‐
pulse voltage corresponding to 50% maximal conductance, and kgis
the slope of the curve. The Boltzmann equation was also used to cal-culate the theoretical steady‐state inactivation–voltage curves corre-sponding to data point fit: I/Imax = 1/[1 + exp((VP – VP50%)/kh)],
where I/Imaxis the peak current amplitude expressed as percentage
of the maximal amplitude (Imax) recorded in response to strongly
neg-ative pre‐pulses (VP), VP50%is the pre‐pulse voltage corresponding to
50% maximal peak amplitude of current, and khis the slope of the
curve. The evaluation of current kinetics was performed by calculating the time to peak (tp) and the time constant of the current inactivation (τh). The time to peak was defined as the time between test‐pulse trig-gering and the peak current, and the time constant of the current inac-tivation was calculated according to the following equation, assuming a mono‐exponential decay as a function of time: I(t)= I(0)e(−t/τh).
Data are expressed as means ± SDs of n different experimental biological samples. The statistical comparison of values was carried out using (a) the parametric two‐tailed Student's t test (either paired samples for comparison within a single population or unpaired samples for comparison between two independent populations) or (b) the one‐ way ANOVA (for comparison between the means of three or more independent populations) followed, if F was significant and if no var-iance inhomogeneity occurred, by post hoc pairwise t tests with Bonferroni correction. Differences were considered to be statistically significant at P < 0.05.
2.11
|Nomenclature of targets and ligands
Key protein targets and ligands in this article are hyperlinked to corre-sponding entries in http://www.guidetopharmacology.org/, the common portal for data from the IUPHAR/BPS Guide to PHARMA-COLOGY (Harding et al., 2018), and are permanently archived in the Concise Guide to PHARMACOLOGY 2017/18 (Alexander et al., 2017).
3
|R E S U L T S
3.1
|Isolation, purification, and de novo amino acid
sequencing of CyrTx
‐1a
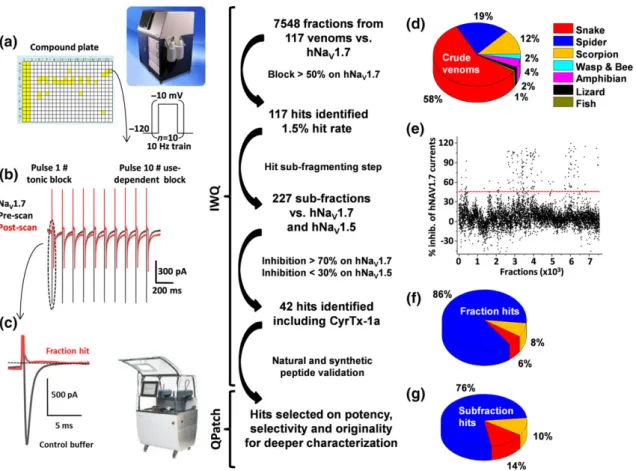
A primary high throughput screening of the Smartox venom collection was performed on automated patch‐clamp Ionworks Quattro platform using HEK‐293 cells overexpressing hNaV1.7 channels (Figure 1a).
Following successful priming and sealing steps, a 10‐pulse train proto-col from −120 to −10 mV at 10 Hz was elicited, bringing hNaV1.7
channels from closed to open configuration (Figure 1b,c). The so‐ called pre‐scan performed in the presence of extracellular buffer was used as a control signal. An average peak current from pulse 1 of 880 ± 280 pA (n = 29 plates) was elicited. A similar average amplitude was measured from pulse 10 on the same recording (no current run-down was observed under our conditions). In control experiments using the same protocol, no inhibitory effect of 0.1% BSA was found. Conversely, addition of 1μM TTX produced a full block of the elicited currents (n = 928 wells from 29 plates). This expected pharmacology was used as the internal positive control (data not shown).
As mentioned in Figure 1, a total of 7,548 fractions coming from 117 crude venoms were tested from a large variety of species includ-ing snake, spider, scorpion, wasp, bee, amphibians, lizard, and fish (see
Figure 1d). The 384‐well screening plates were prepared in such a way that individual fractions were tested at an average concentration of 0.5μg·μl−1(500 ng of dry mass suspended in water). An overview of the percentage of inhibition obtained for each fraction before and after application is given in Figure 1e. Note that 97 fractions were discarded because of a negative impact on the sealing process or because they disrupted seals over time. Also, 26 samples which elic-ited large sodium current increases were removed from the analysis. From the primary screening, 117 fractions were flagged based on their potency versus recombinant NaV1.7channels, then selected for sub‐
fractionation and compound isolation using cation exchange chroma-tography (Figure 1f). Following this process, 227 sub‐fractions from three species (snake, spider, and scorpion; Figure 1g) were prepared and used at a final estimated amount of 100 ng per well. These sub‐ fractions were tested in our functional automated patch‐clamp assays with hNaV1.7, but also hNaV1.5 channels (in conventional closed to
open configuration protocols), as a first‐line selectivity assay. From the 42 hits highlighted at this stage, 14 were discarded because of strong effects on hNaV1.5 channels.
Figure 2a,b illustrates the screening process for the spider venom C. schioedtei from primary fraction selection to individual purified com-pound selection by secondary screening. Using the IonWorks Quattro automated patch‐clamp system, a peptide was selected for its potent blocking effect on hNaV1.7 channels at 2.8μM (98.9 ± 1.2% block,
n = 6 wells from three plates) while fully sparing hNaV1.5 channels
(4.1 ± 1.2% inhibition, n = 6 wells from three plates; Figure 2b). Fol-lowing selection through the multi‐step chromatographic approach, a new peptide was identified using combined orthogonal reversed‐ phase and ion exchange techniques (Figure 2c,d). The molecular mass value of 3578.68 Da for this peptide, as determined by LC–ESI–QTOF MS, indicates that the peptide should be amenable to chemical syn-thesis (inset in Figure 2d).
As this peptide belongs to a species that has not been genotyped, its sequence was determined by de novo sequencing using MS analyses. Hence, the purified peptide was reduced using tris(2‐carboxyethyl) phosphine hydrochloride and alkylated with iodoacetamide. The alterations in molecular mass from 3578.7 to 3926.7 Da indicate that the peptide should contain six cysteine residues and hence three FIGURE 1 Screening flowchart from crude venom fraction to isolated peptide identification. (a) The collection of 117 venoms was prepared into 7,548 fractions individually added to 384‐well plates (Columns 1 and 2 are 1 μM TTX full block and Columns 3 and 4 are maximal current obtained in extracellular buffer) for testing versus hNaV1.7 channels on the Ionworks Quattro (IWQ, Molecular Devices). The train protocol described as an
insert was applied before and after 10‐min incubation of cells with the fraction containing the toxin of interest. Traces of pre‐ and post‐scan are shown in full (b). Also, tonic block obtained on hNaV1.7 channels has been enlarged (c). Source of the screened crude venom is shown in (d).
Percentage of inhibition for all tested fractions was plotted. As shown in (e), a threshold was set at 50% block (red line). From the venom library tested, only 8% hits on the hNaV1.7 channels came from scorpion venom, 6% from snake while the majority (86%) was derived from spider
venoms (f). (g) Hits were sub‐fractioned and tested against hNaV1.7 and hNaV1.5 channels to identify most promising hits to be further
characterized using whole‐cell automated patch‐clamp assays (QPatch)
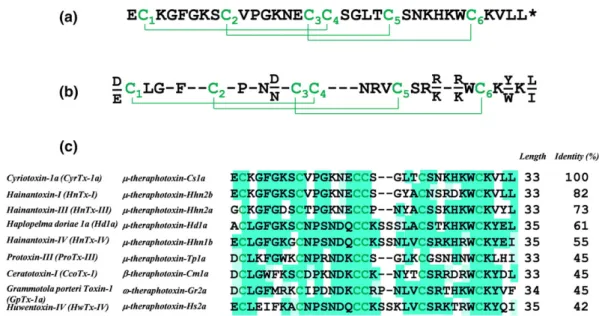
disulfide bridges if one takes into account the loss of 1 Da upon reduc-tion of disulfide bridges and the addireduc-tion of 57.02 Da upon alkylareduc-tion on each cysteine residue. Samples of the reduced/alkylated toxin were then digested overnight with either trypsin or V8 proteases. The digests were next analysed by LC–ESI–MS(/MS) for de novo sequencing. Table S1 provides the list of fragments detected and sequenced after trypsin and Glu‐C digestion. While full sequence coverage of the toxin was obtained by MS, a complementary characterization was performed using Edman degradation, especially for the precise determination of the isobaric leucine and isoleucine residues. The final sequence is reported in Figure 3a with a single post‐translational modification identified as C‐terminal amidation of the peptide.
The peptide, composed of 33 amino acids (3578.68 Da), was iden-tified as μ‐theraphotoxin‐Cs1a or cyriotoxin‐1a (CyrTx‐1a). It is the first toxin described so far from the crude venom of C. schioedtei spi-der, known as the Malaysian earth tiger tarantula, classified in the Ornithoctoninae subfamily. CyrTx‐1a contains the ICK architectural motif previously reported in toxins from the same theraphosid spider family, the NaVchannel spider toxin (NaSpTx) family 1 (Figure 3b).
Fur-thermore, comparison of amino acid sequences between CyrTx‐1a and the nine most similar toxins (of 33–35 amino acids) with analgesic properties from the NaSpTx family 1 revealed that the peptide shares 82% of identity with hainantoxin‐I and μ‐theraphotoxin‐Hhn2b, and 73% of identity with hainantoxin‐III and μ‐theraphotoxin‐Hhn2a FIGURE 2 Flowchart for hNaV1.7 channel hit peptide identification. (a) Percentage of inhibition of peak hNaV1.7 elicited current by application
of 0.05μg of each of the 64 fractions obtained from Cyriopagopus schioedtei spider venom. (b) Each fraction of interest was then separated again to isolate one peptide per well. Sub‐fractions were tested again in our automated patch‐clamp Quattro assay. At this stage, inhibition of hNaV1.7
and hNaV1.5 channels was investigated. (c) Fractionation of the crude venom from C. schioedtei by reversed‐phase chromatography and detection
by UV at 214 nm. The fraction containing the peptide of interest is highlighted in green. (d) Cation exchange sub‐fractionation of the primary fraction highlighted in (c). The inset illustrates the MS of m/z 1193.8947 [M + 3H]3+
(Figure 3c). In contrast, the well‐known potent analgesic peptides ω‐ theraphotoxin‐Gr2a (GpTx‐1) and μ‐theraphotoxin‐Hh2a (HwTx‐IV) share only 45% and 42% of identity, respectively, with CyrTx‐1a.
3.2
|Chemical synthesis and in vitro folding of
CyrTx
‐1a
CyrTx‐1a was chemically synthesized using solid‐phase Fmoc chemis-try. Figure S1a,b illustrates the HPLC profiles of the crude and purified synthesized peptide, respectively. MS data established that the purified reduced peptide had the expected mass with m/z value of 1195.9097 [M + 3H]3+. Finally, the reduced CyrTx
‐1a peptide was oxidized to pro-duce oxidized/folded CyrTx‐1a along with its three disulfide bridges (Figure S1c). The yield of oxidation was 13%, indicating good formation of the secondary structures and easy disulfide bridge connectivity during oxidation. The experimental molecular mass of the synthetic peptide (inset in Figure S1c, 1193.8956 [M + 3H]3+) was in close agree-ment with the theoretical mass (1193.8918). To confirm that the syn-thetic CyrTx‐1a was indeed identical to its native counterpart, both peptides were mixed at equal concentrations and run simultaneously onto analytical RP‐HPLC. As a single major peak was detected, we con-clude that the two peptides co‐elute, hence demonstrating identical retention times on the C18 column (Figure S1d).
3.3
|3D structure of CyrTx
‐1a
The 3D solution structure of CyrTx‐1a was determined by 2D homo-nuclear 1H‐NMR spectroscopy. Spectra were recorded at 305°K
where the amide resonances show a good dispersion. One signal set of sharp and well‐dispersed resonances is indicative of a single
structure in solution (Figure 4a). NMR‐derived interproton distances were used for structure calculations with a molecular dynamic‐based protocol. An ensemble of 20 conformations was obtained, containing a well‐determined backbone conformation of an ICK motif (Figure 4b; PDB: 6GFT). The1H‐chemical shifts of CyrTx‐1a in H2O/D2O highlight
the high precision and stereochemical quality of the ensemble of CyrTx‐1a structures (Table S2). The entire structure has an electrical dipole moment with a larger positive pole, likely to be important for CyrTx‐1a binding to NaVchannels (Figure 4c). Such a motif has also
been found for other NaV1.7 channel inhibitory peptides such as
HnTx‐IV, ProTx‐III, and HwTx‐IV (Figure 4d).
3.4
|Effects of CyrTx
‐1a on hNa
V, hCa
V, hK
V, and
hKir channels overexpressed in cell lines
Whole‐cell automated patch‐clamp (QPatch HTX) experiments per-formed on HEK‐293 cells overexpressing hNaV1.1–1.8 channels
revealed that 1 μM of synthetic CyrTx‐1a was effective to block hNaV1.1–1.2–1.3–1.6–1.7 currents while hNaV1.4–1.5–1.8 currents
were unaffected (Figure 5a). The following increasing order for IC50
values was obtained from the concentration–response curves of CyrTx‐1a effects on currents flowing through the different channels (Figure 5b): hNaV1.1 (72.0 ± 10.0 nM, n = 5) ≈ hNaV1.2
(75.5 ± 4.3 nM, n = 8)≈ hNaV1.6 (115.0 ± 7.5 nM, n = 5)≈ hNaV1.7
(129.5 ± 2.1 nM, n = 7) > hNaV1.3 (306.6 ± 15.2 nM, n = 8) > > hNaV1.4
(7.7 ± 0.2μM, n = 7) for TTX‐sensitive (TTX‐S) subtypes, and hNaV1.5
(>10μM, n = 5) = hNaV1.8 (>10μM, n = 8) for TTX‐resistant (TTX‐R)
subtypes. Additionally, the peptide had very low affinity for hCaV1.2,
3.1 and 3.2 and hKV7.1 and 11.1 and hKir2.1 channels overexpressed
in CHO, HEK‐293, and U2OS cells, since 10 μM of toxin had no marked effect on currents flowing through these six channels (Figure S2). FIGURE 3 Primary structure, disulfide bridge alignment, and sequence homologies of CyrTx‐1a. (a) Primary structure of CyrTx‐1a. Asterisk denotes amidation. Disulfide bridging, as defined by homology, occurs according to the C1–C4, C2–C5, and C3–C6 pattern. (b) Consensus sequence of the NaSpTx family 1, adapted from Klint et al. (2012). (c) Comparison of amino acid sequences between CyrTx‐1a and the nine most similar analgesic toxins from NaSpTx family 1. Sequence alignment performed with Clustal Omega (version 1.2.4 from Emboss programs, EBlosum62 matrix for two pair alignment). The green shading highlights the percentage of identity (Jalview program according to EBlosum62 matrix)
Further investigation, using whole‐cell manual patch‐clamp, pro-vided IC50values of 52.7 nM from the concentration–response curves
of CyrTx‐1a effects on currents flowing through hNaV1.7 channels
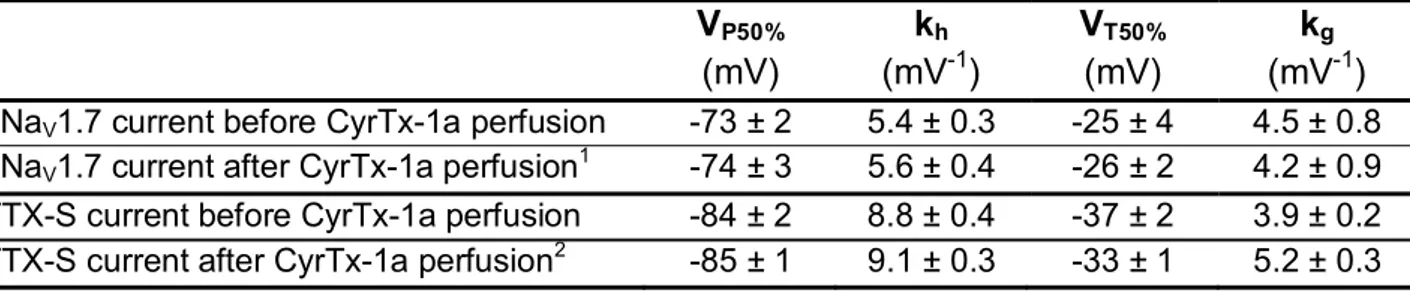
overexpressed in HEK‐293 cells (Figure 6a,b). This CyrTx‐1a‐induced blocking action occurred without any change in steady‐state inactivation‐ and conductance‐voltage relationships of hNaV1.7
chan-nels (Figure 6c and Table S3).
3.5
|Effects of CyrTx
‐1a and TTX on adult mouse
DRG neurons
Before evaluating the effects of CyrTx‐1a on the sodium currents of DRG neurons, the sensitivity of these currents to 100 nM TTX was first determined. Under this condition, two types of neurons were
recorded. The first type (76%, i.e., 16/21 neurons) had only TTX‐S cur-rent, which was blocked by the toxin to 4.5 ± 3.0% of initial peak amplitude values within 1 min. The effects of CyrTx‐1a (from 0.02 to 1μM) on these neurons were evaluated by expressing the current peak amplitude recorded in the presence of the peptide relatively to its initial value determined after washing‐out TTX with a toxin‐free solution for 8–10 min. The second type of neurons (24%, i.e., 5/21 neurons) had a mixed TTX‐S and TTX‐R current, which was decreased by the toxin to around 55% of initial peak amplitude values. The effects of CyrTx‐1a (from 5 to 20 μM) on these neurons were evalu-ated by expressing the current peak amplitude recorded in the pres-ence of the peptide relatively to its initial value determined in the presence of 100 nM TTX. It is worth noting that relatively large neu-rons (of more than 25‐pF membrane capacitance) were patched, which explains the high percent of TTX‐S and low percent of TTX‐R FIGURE 4 Representation of CyrTx‐1a identified by PyMOL. (a) Representation of the backbone peptide folding of CyrTx‐1a determined by1
H 2D NMR method. The structure topology is composed of double stranded antiparallelβ sheet. The three disulfide bonds are C2–C17, C9–C22, and C16–C29 (in yellow). Hydrophobic residues are coloured in green, and basic and acidic residues are coloured in blue and red, respectively. The other polar residues are coloured in white. (b) Superposition of 20 structures derived from a 6‐ns restrained MD simulation (all heavy atoms are shown). All backbone atoms of residues two to 31 were used for fitting. Structures were sampled in 300 ps intervals and energy minimized. The rmsd over all backbone atoms (including residues one to 33) is 0.465 Å with an SD of 0.157 Å. Considering all heavy atoms, the rmsd is 1.072Ǻ with an SD of 0.285Ǻ (PDB: 6GFT). (c) Electrostatic charged surface representation of CyrTx‐1a. The molecule is rendered as a surface coloured according to the electrostatic potential. As indicated in the coloured legend, an excess of negative and positive charges near the surface are represented in red (−1,000) and blue (1,000), respectively, while fairly neutral potentials are represented in white. The entire structure has a clear dipole potential with E1 and E15 forming a negative zone while K3, K7, K13, K25, H26, K27, and K30 form a positive zone. (d) Superposition of backbone peptide folding of CyrTx‐1a and three other toxins of the NaSpTx family 1 previously described to possess analgesic effects (PDB entries of HnTx‐IV: 1NIY, ProTx‐III: 2MXM, and HwTx‐IV: 1MB6)
cell recordings. However, the membrane capacitance of neurons hav-ing TTX‐S current was statistically smaller than that of neurons having TTX‐R current, that is, 24.9 ± 8.7 pF (n = 16) and 31.9 ± 7.9 pF (n = 5), respectively.
Exposing neurons to standard physiological solutions containing various CyrTx‐1a concentrations, using a fast solution application sys-tem, produced a decrease of sodium current amplitude (Figure 6d) which was dependent on peptide concentration and duration of expo-sure and on the current sensitivity to TTX. In particular, the concentration–response curves of CyrTx‐1a effects on the peak amplitude of TTX‐S and TTX‐R currents revealed IC50values of 0.17
and 156μM, respectively (Figure 6e). The peptide was thus approxi-mately 920 times more efficient to inhibit TTX‐S than TTX‐R sodium currents of adult mouse DRG neurons. The blocking effects of CyrTx‐1a on the peak amplitude of TTX‐S current were stationary 5 and 1.5 min after the application of 0.02 and 1 μM of peptide, respectively. Those on the peak amplitude of the TTX‐R current were stationary 4 min after the application of 20μM of peptide. The CyrTx‐ 1a effects on the TTX‐R current, not very noticeable, were not further studied, in contrast to those on the TTX‐S current.
The peak amplitude of TTX‐S current, which was 6 ± 2% of initial values after exposure to 1 μM CyrTx‐1a returned to 32 ± 5% of initial values (n = 5) by exposing neurons to a peptide‐free solution
for 12–15 min, indicating that the effect of CyrTx‐1a was, at least, partly reversible. The analyses of activation and inactivation kinetics of TTX‐S sodium current in the absence and in the presence of 0.25 and 0.5μM CyrTx‐1a showed that the peptide did not affect these kinetics, as the time to peak (tp) and the time constant of the current decay (τh) were not significantly modified (Table S4). Similarly, CyrTx‐ 1a (0.25–0.5 μM) did not produce any alteration of steady‐state inactivation‐ and conductance‐voltage relationships for neurons exhibiting TTX‐S current (Figure 6f and Table S3).
3.6
|Effects of CyrTx
‐1a on tactile and heat
sensitivity of mice in vivo
—Comparison with HwTx‐IV
Tactile and heat sensitivity testing in mice was performed by intraplantar injection of 102 nmol·kg−1of CyrTx‐1a or 49 nmol·kg−1 of HwTx‐IV. A first attempt to evaluate the antinociceptive effect of the two toxins was made using an automated von Frey assay. Tactile sensitivity testing showed that the force intensity at which the mice, injected with 102 nmol·kg−1of CyrTx‐1a or 49 nmol·kg−1of HwTx‐ IV, removed their hind limb in response to fibre pressure, that is, 8.6 ± 1.1 g (n = 8) and 8.5 ± 1.4 g (n = 8), respectively, had tendency (P < 0.17) to increase compared to animals injected with PBS, that is, FIGURE 5 Effects of CyrTx‐1a on HEK‐293 cells overexpressing hNaV1.1–1.8 channels, using whole‐cell automated patch‐clamp. (a)
Representative traces of sodium currents flowing through hNaV1.1–1.8 channels, recorded before (control) and after exposure to 1 μM CyrTx‐
1a. (b) Histograms of IC50values obtained from the concentration–response curves of CyrTx‐1a effects on HEK‐293 cells overexpressing
hNaV1.1–1.8 channels. Each value represents the mean ± SD of data obtained from n cells (numbers in parentheses). Mean value ± SD of nHwas
1.0 ± 0.3
7.0 ± 1.7 g (n = 19; Figure 7a). However, these effects were not signif-icant. Thus, the antinociceptive effect of the two toxins was further investigated using a hot‐plate assay. A significant increase in the treated‐mouse reaction time to heat, that is, the latency either to shake one of the two hind limbs or to jump, was observed compared to animals injected with PBS (Figure 7b). In particular, the reaction time was increased by 1.83 times for mice injected with CyrTx‐1a (17.2 ± 1.7 s, n = 13) and by 1.64 times for animals injected with HwTx‐IV (15.4 ± 1.9 s, n = 13), compared with animals injected with PBS (9.4 ± 0.6 s, n = 12). The injection itself did not have any effects as there was no difference in the reaction time or force intensity between mice injected with PBS and non‐injected animals (Figure 7).
3.7
|Effects of CyrTx
‐1a, compared to HwTx‐IV, on
the mouse neuromuscular system in vivo
Online recordings revealed that the major effect of intramuscular injections of PBS solutions containing various concentrations of either CyrTx‐1a (from 0.3 to 448.7 nmol·kg−1 mouse) or HwTx‐IV (from 4.1 pmol·kg−1to 41.4 nmol·kg−1mouse) to anaesthetized mice was a marked decrease of CMAP amplitude. This is exemplified in Figure 8 a for CMAP recordings performed before and between 10 and 15 min after injections of 29.4 nmol kg−1of CyrTx‐1a and 41.4 nmol kg−1 of HwTx‐IV. The maximal CMAP amplitude measured 30 min after injections of PBS solution alone, and compared to values before FIGURE 6 Effects of CyrTx‐1a on HEK‐293 cells overexpressing hNaV1.7 channels (a–c) and on TTX‐S and TTX‐R sodium currents of adult
mouse DRG neurons (d–f), using whole‐cell manual patch‐clamp. Representative traces of sodium currents flowing through hNaV1.7 channels
(a) and of TTX‐S sodium currents of DRG neurons (d), recorded before (black) and after (blue) exposure to 100 and 250 nM CyrTx‐1a, respectively. Concentration–response curves of CyrTx‐1a effects on hNaV1.7 channel current (b) and on TTX‐S and TTX‐R sodium currents of DRG neurons (e).
Each value, expressed as percentage of that obtained before toxin application, represents the mean ± SD of data obtained from five HEK‐293 cells and five DRG neurons from four different cell cultures. IC50and nHvalues were, respectively, 52.7 nM and 1.0 for hNaV1.7 current (r2= 0.954),
0.17μM and 1.5 for TTX‐S current (r2= 0.961), and 156μM and 0.7 for TTX‐R current (r2= 1.000). Steady‐state inactivation‐ (circles) and
conductance‐ (squares) voltage relationships for HEK‐293 cells overexpressing hNaV1.7 channels (c) and for neurons having TTX‐S current (f),
before and after exposure to 50 nM and 0.25–0.5 μM CyrTx‐1a, respectively. Each value represents the mean ± SD of data obtained from five HEK‐293 cells and eight DRG neurons from four different cell cultures and is expressed as percentage of either maximal peak amplitude of current at strongly negative pre‐pulse voltages or maximal conductance calculated at strongly positive test voltages. The theoretical curves correspond to data point fits with the mean VP50%, kh, VT50%, and kgvalues indicated in Table S3
injections, was not significantly affected, that is, 97.8 ± 2.3% (n = 8 mice), indicating that injections of the toxin vehicle had no effect on the maximal CMAP amplitude and that no marked run‐down of the response occurred.
The toxin blocking effect was quantified by establishing the concentration–response curves and determining the IC50 values. As
shown in Figure 8b, the concentration–response curves for CyrTx‐1a and HwTx‐IV revealed IC50values of 152.3 and 0.9 nmol·kg−1mouse,
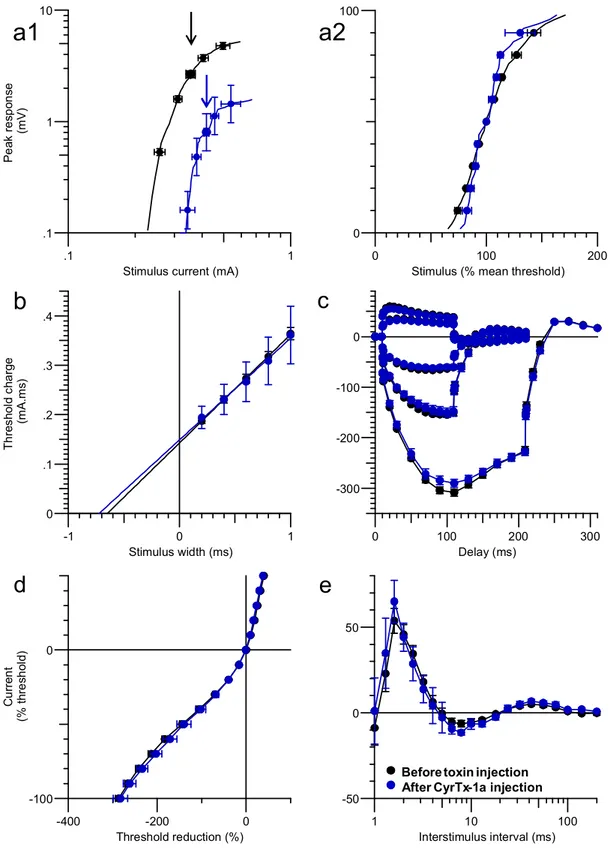
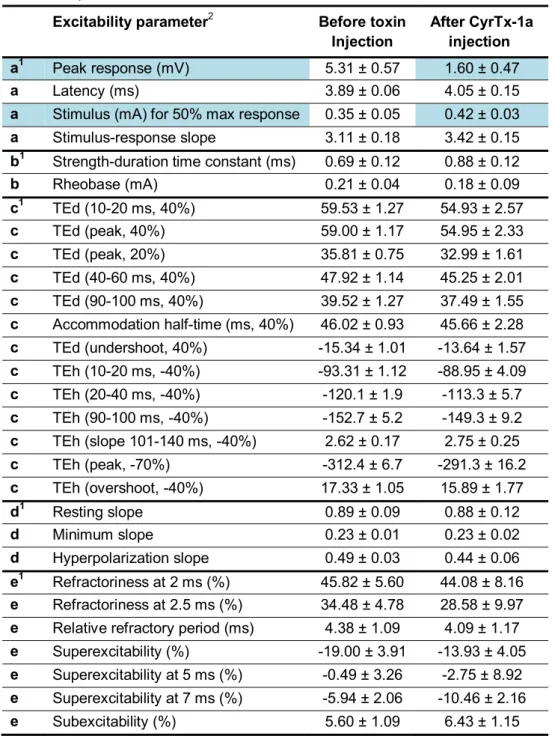
respectively. The five different excitability tests (stimulus–response, strength–duration, and current–threshold relationships, as well as threshold electrotonus and recovery cycle) were performed together before and 30 min after intramuscular injections of PBS solution con-taining CyrTx‐1a (448.7 nmol·kg−1mouse), and the derived neuromus-cular excitability parameters were determined (Figure S3 and Table S5). With the exception of decreased maximal CMAP amplitude and increased stimulus intensity required to generate a 50% maximal amplitude CMAP (stimulus–response relationship), analysis of strength–duration relationship, threshold electrotonus, current– threshold relationship, and recovery cycle did not reveal other CyrTx‐1a effects. The CyrTx‐1a‐induced effects were completely reversed within 12 hr after peptide injections.
3.8
|In vivo toxicity of CyrTx
‐1a, compared to
HwTx
‐IV, in mice
No deaths followed the intraplantar injection of 102 nmol kg−1 of CyrTx‐1a and 49 nmol kg−1of HwTx‐IV in mice. In contrast, intramus-cular injection of 144.4 nmol kg−1of CyrTx‐1a (a concentration which produced an inhibition of ~50% of maximal CMAP amplitude), at the tail base, caused death of 50% (2/4) of animals within 1 hr. By compar-ison, a similar in vivo toxicity (60% of animals [3/5] died within 1 hr) was observed following injection of an approximatively 3.5 times lower HwTx‐IV concentration, that is, 41.4 nmol·kg−1. These results strongly suggest a lower in vivo toxicity of CyrTx‐1a, compared to HwTx‐IV, following intramuscular injections of toxins at the base of mouse tail.
4
|D I S C U S S I O N
This study was undertaken to identify a peptide with antinociceptive properties, among the Smartox venom collection. The strategy consisted of (a) a high throughput screening of 117 different venoms using automated patch‐clamp platforms on cells overexpressing the antinociceptive target hNaV1.7 and the cardiac hNaV1.5 channels, (b)
the isolation and identification of a new peptide, CyrTx‐1a, from the C. schioedtei venom, (c) its structure characterization and chemical syn-thesis, and (d) the evaluation of the synthetic peptide functional prop-erties using multiscale (from individual cell to in vivo) approaches.
With the identification of a large number of hits from our primary screening campaigns, a triage was performed based on potency, in both tonic‐ and use‐dependent current inhibition protocols. The use of venoms from different species (snakes, spiders, scorpions, wasps, bees, amphibians, lizards, and fishes) provided interesting information with regard to the target on which these libraries were screened on. The most striking observation was that spider venoms contain by far the greatest number of compounds active on hNaV1.7 channels with
FIGURE 7 Effects of CyrTx‐1a on tactile and heat sensitivity of mice in vivo. (a) The tactile sensitivity of mice was assessed using an automated plantar von Frey apparatus, by determining the force intensity at which the animals removed their hind limb submitted to an increasing fibre pressure. The same mice were tested before (no injection) and 15 min after intraplantar injection in each hind limb of 5μl of PBS, CyrTx‐1a (i.e., 102 nmol·kg−1) or HwTx‐IV (i.e., 49 nmol·kg−1). (b) The heat sensitivity of mice was assessed using a hot‐plate set at 55.0 ± 0.2°C, by determining the latency for the animals either to shake one of their two hind limbs or to jump. Three groups of mice were tested 60 min after intraplantar injection in each hind limb of 5μl of PBS, CyrTx‐1a (i.e., 102 nmol·kg−1) or HwTx‐IV (i.e., 49 nmol·kg−1), while another group of animals was tested without any injection. (a) and (b) Means ± SD of data obtained from n mice (numbers in parentheses) under each condition.*P < 0.05, significantly different as indicated
a hit rate (for the primary screening) that was seven times higher than scorpion venoms and up to 40‐fold higher than snake venoms. These data point to the impressive specialization of spider venoms for targeting NaV channels. Based on this screening procedure, we
focused our attention on CyrTx‐1a which was identified in the screen-ing and highlighted for progression in our flowchart for more exten-sive in vitro and in vivo investigation.
The isolation of CyrTx‐1a followed a two‐step purification proce-dure using a double in vitro‐guided assay (block of hNaV1.7 channels
and inactivity on the cardiac safety‐compromising hNaV1.5 channels).
Once the activity of the purified compound was confirmed by patch‐ clamp, the toxin entered the phase of sequence deconvolution. Any doubts on Leu or Ile residues were solved by Edman sequencing. The peptide was then synthesized and properly folded according to mass determination and coelution properties, a sine qua non condition for in vitro characterization and in vivo evaluation.
Despite a high sequence identity with HnTx‐I (82%), CyrTx‐1a shares more pharmacological properties with less similar toxins, such as HwTx‐IV (42% identity) and GpTx‐1 (45% identity). This is likely to be mainly due to the presence of Asn23 instead of Ser23in the HnTx‐I sequence that excludes any NaV1.7 channel activity (Klint,
Chin, & Mobli, 2015), while a high potency for NaV1.7 channels
asso-ciated with a good selectivity against NaV1.5 and NaV1.4 channels is
due to the conservation of highly functional residues (Murray et al., 2015; Xiao et al., 2008). Indeed, CyrTx‐1a possesses several highly conserved and crucial amino acids, known to govern the NaVchannel
activity, such as the Phe5, Pro11, Leu20, Ser23, His26, and more
impor-tantly the Trp28and Lys30 residues (Minassian et al., 2013; Murray
et al., 2016; Shcherbatko et al., 2016). In addition, its sequence includes a hydrophobic patch (Gly4, Gly6, and Val31) that has been
described to reinforce the inhibitory potency of ICK toxins at NaV1.7
channels (Agwa, Huang, Craik, Henriques, & Schroeder, 2017). Due to these similarities, CyrTx‐1a may share the same binding site on TTX‐sensitive NaVchannels as the one determined by mutational
anal-ysis and in silico docking for HnTx‐IV, HwTx‐IV, and GpTx‐1a (Cai et al., 2015; Minassian et al., 2013; Murray et al., 2016). Indeed, pos-itively charged amino acids Lys25, His26, Lys27, and Lys30, surrounded
by hydrophobic Phe5and Trp28clustered on one toxin face may be involved in interactions with negatively charged Glu753, Glu811,
Asp816, and Glu818 or aliphatic residues (Met750) located in S1–S2
and S3–S4 loops of DII domain of TTX‐sensitive NaVchannels (Klint
et al., 2014; Li et al., 2004; Liu et al., 2012; Xiao et al., 2008; Xiao, Blumenthal, Jackson, Liang, & Cummins, 2010).
The first step to evaluate CyrTx‐1a functional properties was to study the effects of the synthetic peptide on cells overexpressing hNaV1.1–1.8 channels, using patch‐clamp techniques. This study
allowed (a) to test whether the potent blocking effect of the synthetic peptide, compared to the native molecule, was conserved on hNaV1.7
channels and (b) to reinforce the evaluation of its selectivity profile on the various NaVchannels.
Synthetic (1 μM) and native (0.57 μM) CyrTx‐1a produced 89.1 ± 4.1% (n = 14 wells from seven plates) and 98.8 ± 0.7% (n = 6 wells from three plates) inhibition of hNaV1.7 channels, respectively,
indicating that the two peptides were similarly, and highly, potent in interacting with this channel. The mean IC50values of CyrTx‐1a
inter-action with hNaV1.7 channels, obtained from automated and manual
FIGURE 8 Effects of CyrTx‐1a and HwTx‐IV on the CMAP recorded in vivo from mouse tail muscle in response to caudal motor nerve stimulation. (a) Superimposed traces of CMAP following increasing intensities of stimulation (scheme), before (control), and after CyrTx‐1a (29.4 nmol·kg−1, full blue arrow in (b)) or HwTx‐IV (41.4 nmol·kg−1, full black arrow in (b)) injection. (b) Concentration–response curves of the effects of CyrTx‐1a and HwTx‐ IV on the maximal CMAP amplitude. Each value, expressed as percentage of that obtained before injection, represents the mean ± SD of data obtained from four (CyrTx‐ 1a) and five (HwTx‐IV) mice. IC50and nH
values were, respectively, 152.3 nmol·kg−1 and 0.6 for CyrTx‐1a (r2= 0.992) and
0.9 nmol·kg−1and 0.5 for HwTx‐IV (r2= 0.998). The dashed arrows indicate the
toxin concentrations used for hot‐plate and von Frey assays
patch‐clamp experiments, were 129.5 and 52.7 nM, respectively. From this point of view and compared to toxins belonging to the NaSpTx family 1 such as HnTx‐I, HnTx‐III, Hd1a, HnTx‐IV, ProTx‐III, Cm1a, GpTx‐1, and HwTx‐IV previously reported to interact with this subtype, CyrTx‐1a is thus among the most efficient peptides (Cardoso et al., 2015; Klint et al., 2014; Klint et al., 2015; Liu et al., 2012; Liu et al., 2013; Murray et al., 2015; Murray et al., 2016; Shcherbatko et al., 2016; Xiao et al., 2008). In addition to hNaV1.7 channels,
CyrTx‐1a was also shown to be highly potent to block the TTX‐S hNaV1.1, 1.2, 1.3, and 1.6 channels with the following increasing order
for mean IC50 values (between approximately 75 and 300 nM):
hNaV1.1≈ hNaV1.2≈ hNaV1.6≈ hNaV1.7 > hNaV1.3. The recent
discovery that NaV1.1 and 1.3 channels are involved in pain pathways
(Cardoso & Lewis, 2018; Chen et al., 2014; Osteen et al., 2016) and that the NaV1.2 channel is only located in the CNS (de Lera Ruiz &
Kraus, 2015) does not impair further development of CyrTx‐1a as a potential antinociceptive agent to access only peripheral NaVchannel
subtypes. In agreement, no central side effect was detected when the toxin was locally injected to mice for studying its action on neuromus-cular system and on heat and tactile sensitivity, in vivo. In addition, the analgesic property of CyrTx‐1a seems not to be associated with inhi-bition of hCaV3.1 and hCaV3.2, two channels known to be involved
in pain process (Choi, Yu, Hwang, & Llinas, 2016; Sekiguchi, Tsubota, & Kawabata, 2018). Moreover, the synthetic peptide has low, at best micromolar, affinities for hNaV1.5, hCaV1.2, hKV7.1, hKV11.1, and
hKir2.1 channels, well‐known targets in cardiac safety (Crumb, Vicente, Johannesen, & Strauss, 2016). However, although fully spar-ing the skeletal muscle hNaV1.4 channel, CyrTx‐1a also targets the
peripheral nerve hNaV1.6 channel. This may represent a limitation
for the in vivo efficacy of the toxin, despite the fact that this channel has been reported to be is up‐regulated in various peripheral pain pathways (Gonçalves, Benoit, Partiseti, & Servent, 2018). The develop-ment of analogues with improved hNaVchannel selectivity will thus be
required.
The second step to evaluate CyrTx‐1a functional properties was to study the peptide effects on TTX‐S and TTX‐R sodium currents of adult mouse DRG neurons, including mainly the TTX‐S NaV1.1,
1.6, and 1.7 channels and the TTX‐R NaV1.8 and 1.9 channels (Rush,
Cummins, & Waxman, 2007). This study was motivated by the well‐ known physiological importance of DRG neurons in pain signalling. As expected, the preferential blocking effect of TTX‐S NaVchannels
by CyrTx‐1a was confirmed on mouse DRG neurons since the pep-tide was 920 times more efficient to inhibit the peak amplitude of TTX‐S than TTX‐R sodium currents recorded from these neurons. These results are consistent with previous observations on adult rodent DRG neurons showing that other potential antinociceptive toxins, such as HnTx‐IV, GpTx‐1, and HwTx‐IV, inhibit TTX‐S current without markedly affecting TTX‐R current (Liu et al., 2003; Murray et al., 2015; Peng, Shu, Liu, & Liang, 2002). Most of these peptides, including CyrTx‐1a, inhibit hNaV17 and/or TTX‐S currents without
any significant modification of activation and inactivation kinetics and/or voltage dependence. From a general point of view, CyrTx‐ 1a was therefore more efficient to block TTX‐S than TTX‐R channels
overexpressed in HEK‐293 cells, as well as TTX‐S than TTX‐R cur-rents of DRG neurons. These results may suggest that the toxin interacted with the TTX receptor binding site, or the other way around, of the NaV channel protein. However, this hypothesis is
not further supported taking into account that the affinity of CyrTx‐1a for the TTX‐S hNaV1.4 channel was relatively low (mean
IC50of≈8 μM).
The third step to evaluate CyrTx‐1a functional properties, and to go deeper in the antinociceptive appraisal of the peptide, was to study its effects on heat and tactile sensitivity of mice in vivo, using hot‐plate and von Frey assays, respectively. Following intraplantar injections, the peptide (102 nmol·kg−1) was as efficient as HwTx‐IV (49 nmol·kg−1) in increasing the time to first pain manifestation of animals to nociceptive heat, while non‐significant change was detected in the force intensity at which the mice, injected with CyrTx‐1a, HwTx‐IV or PBS, removed their hind limb in response to fibre pressure. Similar results were obtained from mice lacking the NaV1.7 channels (global NaV1.7 knockout animals) which were
reported to be insensitive to thermal pain while the tactile sensitivity measured with von Frey testing was unchanged (Gingras et al., 2014). These results highlight the more pronounced involvement of the NaV1.7 channels in heat than tactile sensitivity. The fact that
CyrTx‐1a also targets the NaV1.6 channel with high affinity, a
sub-type located in motor axons innervating skeletal muscles (Caldwell, Schaller, Lasher, Peles, & Levinson, 2000), could limit the safe use of this peptide as an antinociceptive agent. Experiments were thus also conducted to test CyrTx‐1a effects on the mouse neuromuscu-lar system in vivo. These effects mainly consisted of CMAP inhibi-tion, as shown in the present work and previously reported for HwTx‐IV (Gonçalves, Boukaiba, et al., 2018). These results strongly suggest that the two peptides produce a marked decrease of the density of functional“transient” NaVchannels. Besides these effects,
CyrTx‐1a, as HwTx‐IV (Gonçalves, Boukaiba, et al., 2018), did not modify other excitability parameters, indicating that the peptide does not affect the density of other functional ion channels, receptors, and pumps, nor the passive membrane properties of the neuromus-cular system (Kiernan & Bostock, 2000; Krishnan et al., 2008). CyrTx‐1a was approximately 170 times less efficient than HwTx‐IV to inhibit CMAP. Assuming that both toxins have also similar affinity on the mouse NaV1.6 channels, we infer that the accessibility to this
subtype, located mainly at the nodes of Ranvier of motor myelinated axons (Caldwell et al., 2000), is somehow more limited for CyrTx‐1a than for HwTx‐IV.
In conclusion, the present results highlight that CyrTx‐1a purified from C. schioedtei spider venom is a new toxin interacting with hNaV1.7 channels associated with an antinociceptive effect. Further
structure–activity relationships and engineering studies will be neces-sary to improve the NaV channel selectivity profile and analgesic
potency of CyrTx‐1a. In particular, it is likely that synthetic modified homologues, associated with molecular dynamics simulation using CyrTx‐1a and NaVchannels, will reinforce the potential use of the
peptide as a lead molecule for the potential development of novel pain therapeutic agents.