Do Classified Boards Protect Top Management?
Evidence from Shareholder Proposals
by
Fernando Miguel Pinto Martins B.A. Economics
Nova School of Business and Economics, 2010 M.A. Finance
Nova School of Business and Economics, 2012
SUBMITTED TO THE SLOAN SCHOOL OF MANAGEMENT IN PARTIAL FULFILLMENT OF THE REQUIREMENTS FOR THE DEGREE OF
MASTER OF SCIENCE IN MANAGEMENT RESEARCH AT THE
MASSACHUSETTS INSTITUTE OF TECHNOLOGY
JUNE 2018
2018 Massachusetts Institute of Technology. All rights reserved.
Signature of Author...
Certified by ... ...
Signature redacted
Sloan School of Management May 11, 2018Signature redacted
Signature redacted
Accepted by ... MASSACHUSETTS INSTITUTE OF TECHNOLOGYJUN 15 2018
LIBRARIES
David Thesmar Professor of Finance Thesis Supervisor Catherine Tucker Sloan Distinguished Professor of Management Professor of Marketing Chair, MIT Sloan PhD ProgramDo Classified Boards Protect Top Management?
Evidence from Shareholder Proposals
by
Fernando Miguel Pinto Martins
Submitted to the Sloan School of Management on May 11, 2018 in Partial Fulfillment of the Requirements for the Degree of Master of Science in
Management Research
ABSTRACT
This paper examines the relationship between classified boards and managerial entrenchment by applying a panel regression discontinuity design to shareholder proposals on board declassification. We focus on shareholder proposals that pass or fail by a small margin of votes in order to provide a causal estimate of the impact of board declassification. We find that shareholder proposal approval leads to a reduction in CEO compensation, an increase in the likelihood of CEO replacement, a positive but insignificant impact on pay-performance elasticity, and an increase in firm value. The reduction in CEO compensation is strongest among firms who possess weaker levels of corporate governance. These findings suggest that classified boards protect top management and lead to higher levels of managerial entrenchment.
Thesis Supervisor: David Thesmar Title: Professor of Finance
I.
Introduction
The existence of agency conflicts between the many stakeholders of a company has led to the creation of systems of rules, practices and processes often denoted as corporate governance. In the context of managers and shareholders these provisions often grant managers a higher degree of autonomy which allows them to independently manage a company, thus reducing the involvement of shareholders in quotidian or even long-term decisions. On the one hand, advocates of these measures claim that they contribute to long-term value generation since they protect boards from short-termism (Stein, 1988; Bebchuck and Stole, 1993; and Bebchuck and Cohen, 2005). On the other hand, these increased levels of independence also lead to reduced control and monitoring from shareholders (Shleifer and Vishny, 1997).
The empirical literature has generally supported the view of managerial entrenchment in which the protection granted by corporate provisions, and in particular classified boards, hurts sharehold-ers by diminishing the threat of removal (Manne, 1965) and thereby increasing shirking, empire-building, and the extraction of private benefits by incumbents. Gompers, Ishii and Metrick (2003) show that the G-Index2 is negatively correlated with firm value (as measured by Tobin's
Q).
Be-bchuck, Cohen and Ferrell (2009) show that the E-Index3 also exhibits a strong negative correlation with firm value. Cufiat, Gine and Guadalupe (2012) utilize a regression discontinuity design on the outcome of shareholder proposal votes and find positive cumulative abnormal returns for compa-nies who approve proposals on the removal of corporate governance provisions. Specific to classified boards, Bebchuck and Cohen (2005) find that staggered boards are associated with an economi-cally meaningful reduction in firm value. Faleye (2007) associates this reduction in firm value to measures of managerial entrenchment based on findings of decreased CEO turnover and lower pay-performance sensitivity. Although there exists a large amount of empirical findings that support the view of managerial entrenchment, most analysis rely on descriptive rather than causal estimation which potentially suffers from endogeneity. In addition, while it is less prominent, you can also find conflicting empirical evidence that exhibit a positive impact from classified boards. Cremers and Ferrell (2014) evaluate a longer panel of corporate provisions between 1978 and 2006 and shows a positive link between classified boards and firm value using time-series models with firm level fixed effects. They later attribute this positive impact to the fact that classified boards typically require 'Short-termism consists of a set of actions taken by companies that bolster short-term profitability at the cost of long-term value creation. This concept relies on the existence of activists whose intention is to generate profits in a short amount of time (myopic activist). In addition, the concept also relies on market inefficiencies that would drive a wedge between short-term and long-term market values. Under an efficient market current market prices would immediately adjust to long-term value destruction rendering activists unable to profit from such misguided decisions.2A corporate governance index comprised of 28 different provisions but only 24 of them are unique. As a
result, the index takes values from 1 to 24. 3
A smaller corporate governance index comprised of 6 different provisions: staggered boards, poison
pills, golden parachutes, and super-majority requirements for charter amendments, bylaws amendments and mergers.
bilateral support from management and shareholders in order to be adopted.
Our purpose is to improve on previous findings by providing causal estimates of the impact of corporate governance on measures of managerial entrenchment. To evaluate the impact of classified boards on executive compensation, and other relevant measures, we build on the panel regression discontinuity design initially proposed by Cellini, Ferreira and Rothstein (2010) and apply it share-holder proposals on board declassification. This identification approach relies on the assumption that vote outcomes close to the majority threshold, typically 50% of the votes, are likely to be random given the existence of at least some degree of randomness in the voting process. It is important to note that shareholder proposals are non-binding, however, as long as there exists a discontinuity in the probability of treatment we can still rely on this approach as argued by Lee and Lemieux (2010).
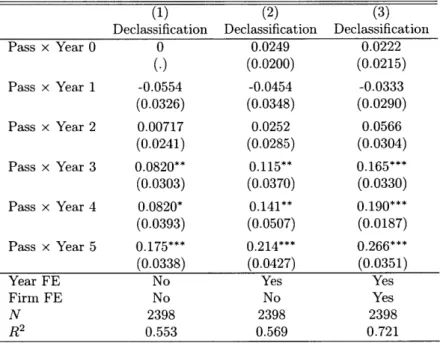
We find that passing a shareholder proposal to repeal the classified board increases the likeli-hood of board declassification by 26.6% at the discontinuity, consistent with the findings of Ertimur et al. (2010) and Cufiat et al. (2012). This effect takes five years to materialize since the process of board declassification has a long period of implementation. A typical board declassification process involves waiting one year for management to vote on the shareholder proposal followed by three years of actual implementation. The later requires a long time since directorial terms usually last three years under a classified board and state law often protects directors from early removal, thereby slowing down the change of the election process as directors elected prior to the repeal are slowly phased-out.
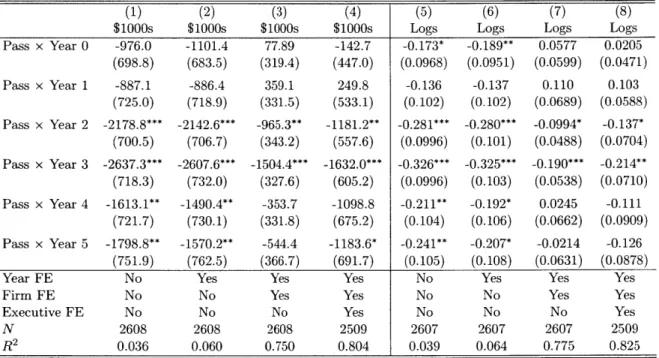
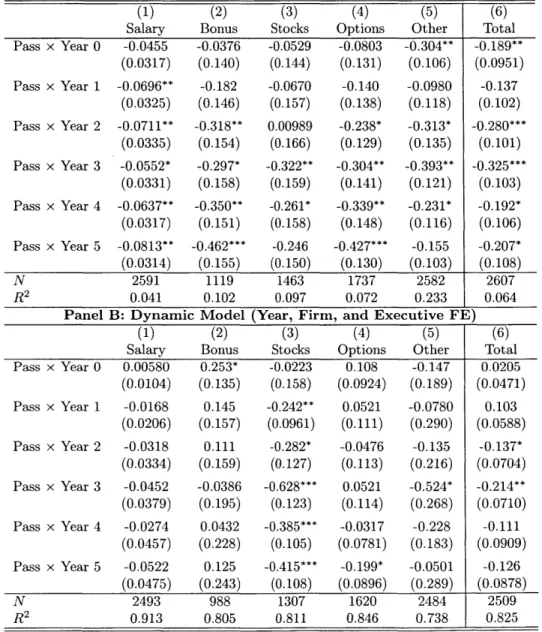
When applying our framework to compensation and other CEO related variables we find that total CEO compensation declines by approximately 8% after approving a shareholder proposal. This reduction in total CEO compensation is comprised of declines in stock grants, options grants, and other forms of compensation such as the non-equity component of long-term incentive plans. Both the salary and the bonus components do not decline in our dynamic specifications. Note that the underlying effect of board declassification is considerably higher since not all of the firms who approve the proposals implement the measure. When this aspect is taken into account we find that the underlying board declassification generates a reduction in total CEO compensation of about 28%4. This estimate mainly results from scaling the effect by the inverse of the probability of implementation.
The CEO replacement indicator experiences an increase of 4% during the first year and 6% 4This estimate decreases to 15% if we rely on model specifications that do not include executive level fixed effects. Furthermore, this estimate is sensitive to the probability of board declassification (26.6%) which might also increase if we extend our period of analysis to more than five years. Since the likelihood of implementation and the effect of classified boards are negatively related, an increase in the probability of board declassification will further reduce our inferred impact of board declassification.
during the second year which suggests an increased CEO turnover after the approval of a share-holder proposal on board declassification, consistent with Falaye (2007). Furthermore, the CEO pay-performance elasticity, modeled in accordance with Hall, and Liebman (1998), exhibits a posi-tive but insignificant coefficient of 0.04 over the five years after the vote. This either suggests that pay-performance elasticity remains unchanged during this period of time or that we do not have enough power in our tests.
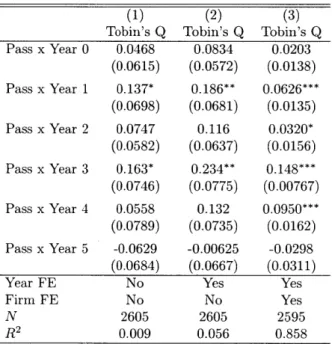
To determine if these findings provide evidence of managerial entrenchment we further evalu-ate the impact of board declassification on the firm value as measured by the Tobin's
Q.
We find that the Tobin's Q increases by about 0.055 after a shareholder proposal approval, indicative of a positive impact coming from board declassification. When we scale this effect by the probability of implementation we determine that board declassification increases the Tobin's Q by 0.21 which closely matches findings by Bebchuck and Cohen (2005), and Falaye (2007).Overall, we find that total CEO compensation declines, CEO replacement increases, CEO pay-performance elasticity suffers a positive but insignificant increase, and firm value improves after passing the shareholder proposal. In addition, the decrease in total CEO compensation is higher for firms that possess a weaker level of corporate governance. These findings are consistent with the "managerial power view" (Bebchuck and Fried, 2003) in which managers utilize the increased protection from classified boards to extract additional levels of compensation, effectively entrench-ing themselves.
The remainder of the paper is organized as follows. Section II provides a description of classified boards and how they interact with executive compensation. In addition, we also provide the theoretical foundation under which we frame our findings. Section III describes the data and its sources. Section IV presents the methodology and identification strategy. Section V addresses concerns on the validity of our quasi-experiment. Section VI and VII present the results on the impact of shareholder proposal approval and the impact of classified boards, respectively. Section VIII concludes.
II.
Classified Boards and Executive Compensation
A. Classified Boards
A classified or staggered board is a governance practice in which directors are grouped into dif-ferent classifications and only one group stands for re-election at each annual meeting5. This type
5
To illustrate this provision consider the case of a firm with 9 directors split into 3 groups. The directors in each group serve 3 year long terms and only one of the groups is voted on per year. This implies that you need at least 2 years to replace the majority of directors in a board. This framework is similar to the way in which senators are elected in the USA.
of structure differs from annual boards in which all directors stand for re-election every year. The adoption of a staggered board commits shareholders to longer directorial terms thus introducing a bias towards institutional stability. Longer directorial terms effectively increase the difficulty of shareholders reneging on prior engagements with managers and other stakeholders. Furthermore, staggered boards act as an anti-takeover provision as they increase the difficulty and the time frame needed to replace the majority of a board.
Advocates of classified boards claim that this measure benefits shareholders since it induces man-agement to make efficient long-term investments (Stein, 1988; and Bebchuck and Stole, 1993) and avoid inefficient actions that it might otherwise undertake to reduce the probability of a takeover. In essence, classified boards mitigate the limited commitment problem defined by Bebchuck and Cohen (2005) in which market prices may fail to fully capture the long-term implications of direc-torial decisions. Under asset-pricing inefficiency, and vested with strong exit rights, shareholders are unable to credibly commit to long-term value creation as they cannot distinguish whether bad performance realizations are due to mismanagement or the pursuit of long-term value creation. Nevertheless, this increased protection might hurt shareholders as it diminishes the threat of re-moval (Manne, 1965) and thereby increases shirking, empire-building, and the extraction of private benefits by incumbents.
Several empirical findings suggest that staggered boards are associated with a decrease in firm value. Jarrel and Poulsen (1987) study antitakeover charter amendments and determine a nega-tive but insignificant average abnormal return for classified board announcements. Bebchuck and Cohen (2005) evaluate the impact of classified boards on firm value as measured by Tobin's
Q
and find a significant negative relationship between classified boards and firm value. Faleye (2007) determines a significant negative relationship between classified boards and firm value both using cross-sectional regressions and event studies. He later links this negative impact to managerial entrenchment and provides evidence of decreased CEO turnover and pay-performance sensitivity. There is also a large amount of empirical research conducted on aggregate measures of corporate governance, a fraction of which is comprised by classified boards, that identifies similar negative links to firm value6.We intend to improve on the current literature by providing a causal estimation of the impact of classified boards over measures of managerial entrenchment, the most relevant of which is total CEO compensation. Not only does this address concerns of endogenity present in previous findings but it also directly quantifies the impact of classified boards on managerial behavior.
Our analysis is restricted to classified boards for several different reasons. First, this measure
6
Some examples include Gompers, Ishii and Metrick (2003), Bebchuck, Cohen and Ferrell (2009), and Cufiat, Gine and Guadalupe (2012).
constitutes one of the most important corporate governance provisions that a company may adopt.
Not only are classified boards a principal component of current widely used governance indices7 but they are also a gateway that facilitates the removal of other governance provisions (Klausner, 2013). Second, there has been a considerable amount of attention given to board declassification and the number of shareholder proposal votes on this issue vastly outnumbers other governance provisions8
This gives us a large database which is valuable when conducting empirical research. Third, by aggregating different measures we risk improperly identifying the impact of any individual measure as we dilute it across the sample. Cremers and Ferrell (2014) suggest that different provisions have very different impacts on firm value and some provisions even exhibit positive effects. Last but not least, the implementation of a classified board is binary and stable which facilitates the interpretation of our findings.
B. Executive Compensation
There are two main views in the executive compensation literature with potentially different predictions towards the impact of board declassification. The first view identifies executive pay as a product of arm's length contracting between directors and management executives. These contracts are established in order to solve existing conflicts of interest between the different stake-holders of corporations, thus reducing agency problems in line with the principal agent problem presented by Holmstrong (1979). We shall denominate this view as the "optimal contracting view" in accordance with Bebchuck and Weisbach (2010). The second view, which we denote as "man-agerial power view", states that executive compensation might not be the result of arm's length contracting and sees it instead as a direct consequence of an agency problem (Bebchuck and Fried, 2003). As the name suggests this last view perceives executive compensation as a consequence of a problem instead of a solution.
We depart from the hypothesis that classified boards are capable of insulating incumbents thereby increasing shirking, empire-building, and the extraction of private benefits. Under this hy-pothesis the "managerial power view" suggests that management would use the protection granted by these boards to entrench themselves thus extracting additional compensation, decreasing the sensitivity of their compensation to firm performance and maybe even decreasing the likelihood of being replaced. These predictions are somewhat in line with Bertrand and Mullainathan (2003). In the event of a board declassification we would expect these effects to be reverted as management
7
Staggered boards are contained in the "Antidirector Index" (Porta, Lopez-de-Silanes, Shleifer and Vishny, 1998), "G-Index" (Gompers, Ishii and Metrick, 2003) and the "E-Index" (Bebchuck, Cohen and Ferrell, 2009).
8
The ISS shareholder proposal database contains 1,184 shareholder proposal votes for board declassi-fication between 1997-2014. This number compares to 607 shareholder proposal votes for the removal of poison pills which constitutes the second most voted issue on shareholder sponsored proposals. In addition, Gillan and Starks (2010) claim that board declassification was also the most popular shareholder proposals between 1987-1994. This suggests that there have been more votes on board declassification than any other governance provision for the last three decades.
becomes more exposed to shareholder discipline. As a result, the approval of shareholder proposals on board declassification should produce a decline in CEO compensation, an increase in the CEO pay-performance sensitivity and potentially even an increase in the likelihood of CEO replacement.
The declassification of a board can have different implications under the "optimal contracting view". If we follow the framework suggested by Core, Holthausen and Larcker (1999), in which the decision to implement a staggered board results from the same economic determinants as executive compensation, then classified boards should have absolutely no impact on CEO compensation and CEO pay-to-performance sensitivity when we control for those determinants9. However, one may argue that it is optimal for compensation to increase as classified boards provide management the ability to generate long-term value and management should be rewarded for doing so. This would suggest that it is possible for compensation to increase in both the "managerial power view" and the "optimal contracting view". One way to distinguish between both theories is to evaluate the impact on firm value. Board declassification will increase the firm value if CEO compensation is higher due to entrenchment, and it will instead decrease the firm value if CEO compensation is higher due to optimal contracting. This provides an easily testable implication that ultimately allows us to determine which view is supported by our findings.
III. Data and Summary Statistics
This section lists the sources of the data used in our analysis and describes how we construct or define the variables most relevant to our approach. Throughout this section we also highlight some of the empirical issues related to each topic and the manner in which we tackle them.
Information on shareholder proposals is collected by the Institutional Shareholder Services (ISS), formerly known as RiskMetrics, which contains 10,849 governance proposals by S&P1500 compa-nies between 1997 and 2014. This includes company name, ticker, company identifiers, date of the meeting, percentage of votes in favor of the proposal10, vote majority requirements 1 , issue codes, name of the proposal sponsor and resolutions.
'The panel RDD that we present in the next section relies on the random sampling of firms within a small interval around the majority threshold. This sampling procedure should match firms on underlying economic determinants allowing us to test this view given that classified boards are assumed to be a noisy measure with no impact on executive compensation.
ioCompanies have different ways of addressing abstentions, however, we do not have information on the percentage of votes against or the percentage of abstentions. Considering that a sizable portion of the firms in our data set do not count abstention votes we contacted ISS and obtained confirmation that the percentage of votes in favor is adjusted based on each firm's treatment of abstentions. This implies that our identification approach, which relies on the discontinuity at the majority threshold, is valid for all votes.
"These requirements state the percentage of votes needed to approve the proposal. Most cases require 50% of the votes to be in favor, however, a total of 8 firms in our sample deviate from this rule as they possess super-majority requirements. The distance to threshold variable defined in the next section takes this into account.
Board declassification is the most commonly observed proposal with a total of 1,184 shareholder proposals within this period. Note that a considerable amount of these observations do not have information on the vote outcome as firms may choose to omit it. Once this and a few other issues1 are taken into consideration we obtain a final panel consisting of 778 year-firm observations on non-binding board declassification proposals. Table I displays the number of proposals and the percentage of votes that are approved for different ranges around the majority threshold. Panel A includes information on all of the votes which includes not only the first vote of each firm but also all of the consecutive votes on board declassification. The table shows that the number of proposals in the full-sample has remained constant over time while the percentage of approved proposals has significantly increased throughout the sample period. Furthermore, the number of votes that fall within the regions closest to the majority threshold have decreased. These findings suggest that shareholder proposals on board declassification are not only being approved at much higher rates during recent times but they are also being approved with much higher percentages of votes in favor. This is consistent with the idea that shareholders have become increasingly more aggressive at pursuing the removal of anti-takeover provisions, an event which is partially attributed to the rise of empirical research suggesting a negative link between shareholder value and weaker corporate governance.
Panel B restricts our sample to the first vote of each firm which accounts for 451 votes in our panel, indicative of a high degree of consecutive voting. The percentage of approved votes falls slightly when we look at each firm's first vote which is not surprising given the strong time trends in the approval rate. Table II displays additional information on consecutive voting and it high-lights how persistent some shareholders are regarding the removal of classified boards with almost 80 firms voting at least 3 times on this issue. It also illustrates that non-binding proposals are often ignored by management especially when the proposals are approved by small margins. Ertimur, Ferri, and Stubben (2010) estimate the discontinuity in the probability of treatment at the major-ity threshold to be around 21% which leaves room for a considerable amount of proposals to be ignored. In addition, they also show that the probability of implementation increases in the vote share with the probability of implementation jumping to 79% for proposals with more than 90% of the votes in favor. The fact that not all firms implement approved proposals does not invalidate our identification approach. As long as there exists a discontinuity on the probability of treatment we can still utilize the RDD to conduct inference (Lee, 2010).
We separate first votes from consecutive votes due to concerns of non randomness. It is plausible that shareholders adjust their vote outcome expectations by observing the vote share of previous voting instances. This could in turn lead to a certain persistence in the outcome of the vote. In addition, repeatedly voting on the issue may also skew later votes in favor of approval since the
1 2
The percentage of votes in favor variable was rounded to the closest integer for data prior to 2009. As a result, a small number of votes were coded at exactly the majority threshold and we had no way to determine if they were passed or rejected. These observations were removed from our sample.
Table I
Shareholder Proposals on Board Declassification
The annual number of proposals and percentage of approved votes are reported across three samples: full sample, sub-sample of votes within 20 percentage points of the majority threshold, and sub-sample of votes within 10 percentage points of the majority threshold. Panel A reports on all votes and panel B only reports on the first vote of each firm. Data was collected by ISS for all S&P1500 companies.
Full Sample Sub-sample [-20%,20%] Sub-sample [-10%,10%] Year Number % Approved Number % Approved Number % Approved
Panel A: All Votes
1997 43 27.9 39 28.2 22 31.8 1998 43 32.6 34 29.4 23 30.4 1999 46 39.1 41 43.9 34 44.1 2000 52 63.5 40 65.0 28 57.1 2001 46 69.6 37 70.3 30 73.3 2002 41 87.8 29 86.2 14 100.0 2003 48 85.4 37 81.1 18 61.1 2004 36 94.4 15 86.7 11 81.8 2005 44 81.8 22 81.8 9 66.7 2006 57 82.5 21 76.2 12 66.7 2007 37 75.7 14 71.4 5 60.0 2008 60 83.3 34 76.5 16 62.5 2009 55 80.0 26 61.5 13 30.8 2010 49 65.3 34 52.9 15 46.7 2011 33 97.0 7 85.7 2 100.0 2012 49 93.9 10 70.0 4 25.0 2013 24 95.8 5 80.0 3 100.0 2014 15 93.3 0 - 0 -Total 778 73.5 445 62.9 259 56.0
Panel B: First Vote
1997 43 27.9 39 28.2 22 31.8 1998 25 32.0 18 33.3 13 38.5 1999 22 31.8 21 33.3 16 31.3 2000 21 71.4 14 64.3 8 50.0 2001 17 64.7 14 71.4 12 75.0 2002 10 80.0 8 75.0 4 100.0 2003 19 84.2 12 75.0 5 40.0 2004 16 87.5 5 60.0 4 50.0 2005 30 80.0 13 84.6 5 80.0 2006 34 82.4 11 63.6 6 50.0 2007 22 77.3 8 62.5 4 75.0 2008 41 85.4 23 73.9 12 58.3 2009 33 78.8 15 53.3 9 33.3 2010 37 64.9 26 53.8 10 40.0 2011 21 100.0 2 100.0 0 -2012 36 100.0 5 100.0 1 100.0 2013 14 100.0 0 - 0 -2014 10 90.0 0 - 0 -Total 451 72.1 234 55.6 131 48.1
decision to repeatedly vote already underlines a certain desire to approve the measure. We address some of these concerns in later sections, nevertheless, the removal of consecutive votes is expected to improve the cleanliness of our identification strategy.
Table II
Shareholder Proposals by Number of Consecutive Votes
The table reports information on consecutive shareholder proposals that took place between 1997 and 2014. A consecutive vote is a repeat of a shareholder proposal. The number of proposals and percentage of approved votes are reported across three samples: full sample, sub-sample of votes within 20 percentage points of the vote approval threshold, and sub-sample of votes within 10 percentage points of the vote approval threshold. Data was collected by ISS for all S&P1500 companies.
Consecutive Full Sample Sub-sample [-20%,20%] Sub-sample [-10%,10%] Votes Number % Approved Number % Approved Number % Approved
1 152 67.8 93 61.3 57 54.4 2 79 78.5 56 76.8 37 70.3 3 53 81.1 34 76.5 17 70.6 4 23 87.0 14 78.6 8 62.5 5 14 92.9 10 90.0 6 83.3 6 4 100.0 2 100.0 2 100.0 7 1 100.0 1 100.0 1 100.0 8 1 100.0 1 100.0 0 -Total 327 73.5 211 62.9 128 56.0
ISS also collects information on corporate governance which is available between 1990 and 2015. This data set includes indicator variables for each governance provision13, and the governance index (G-Index) developed by Gompers, Ishii and Metrick (2003). We utilize this information to look for evidence of shareholder proposal implementation since we can track whether or not companies have declassified their boards for up to five years after each vote. In addition, we also utilize this information to rank companies in accordance with their corporate governance level and determine for which type of firms the board declassification exhibits a larger impact.
Information on executive compensation and CEO related variables is collected from Execucomp between 1992 and 2015. Given the large number of executive compensation elements and the evolu-tion of compensaevolu-tion reporting standards over the years we decided to ensure the continuity of our variables by adopting the 1992 compensation reporting format. As a result, total executive com-pensation matches the Execucomp variable denoted "tdcl" which is comprised of salary, bonus, stock grants, option grants, and other compensation. Stock grants include compensation in the "The data provided by ISS is split into two different files: the legacy file ranging from 1990-2007 and their current file ranging from 2007-2015. The legacy file includes a substantially larger amount of information on corporate governance since it reports on all of the 28 provisions included in the G-Index. The current file reports on a smaller amount of provisions and it no longer contains the G-Index but it has more accurate data collection and it is internally linked with the shareholder proposal data which allows for better data matching. While the G-Index is not available after 2007 both files contain indicators for classified boards.
form of restricted stock grants and the equity component of long term incentive plans after 200614. Option grants include all options granted to the executive valued using the Black-Scholes model. The last element denominated other compensation includes the non equity portion of long-term incentive plants along with other considerably smaller elements. Examples of such elements in-clude tax reimbursements and personal benefits. Note that contrary to SEC reporting standards our definition of total compensation does not include pension changes. We do not include pen-sion changes since this information is not available for data prior to 2006 and we wish to avoid data breaks in our series for total compensation. We also conduct inference on an alternative measure of total compensation in which we utilize the value realized from exercising options in-stead of the Black-Scholes model. This variable is denominated "tdc2" in the Execucomp database.
We determine each firm's CEO by utilizing the "ceoann" variable that flags executives as CEOs for every firm-year cell. However, there is a considerable amount of firms for which this flag is missing. To tackle this issue we follow Landier et al. (2013) and use the variables "becameceo" and "leftofc" to determine the period in which every executive served as a CEO. The variable "becameceo" reports the exact date in which an executive became the CEO while the "leftofc" variable reports the date in which the executive left office. Since CEO positions are filled through-out different dates of the year we tackle potential duplicates by attributing the CEO position to the executive who held the office for most of the fiscal year. This allows us to match on a higher amount of firm-year cells. The CEO leave indicator also makes use of the "leftofc" variable to pin down the year in which the CEO left and we remove cases in which the CEO died.
Other data includes accounting statements, financial market variables, and institutional own-ership data collected from Compustat, CRSP, and Thomson Reuters (13f), respectively. All of the data described in this section is matched on firm identifiers15 and we validate the matching process by manually looking at tickers and company names. This is doable since the shareholder proposals data is limited to 778 firm-year observations. In addition, given the existence of large outliers'6 we winsorized problematic variables below the 5th percentile and above the 95th percentile. Table III "Prior to 2006 long term incentive plans (LTIPs) were valued as a single component and we do not have sufficient information from Execucomp to separate them into equity and non-equity components. As a result, there exists a data break in the series of "stock grants" - prior to 2006 the variable only includes restricted stock grants and after 2006 it includes restricted stock grants and the equity portion of incentive plans. The reverse break occurs in the "other compensation" variable albeit it is less noticeable since this variable possesses high volatility. Note that all measures of total compensation are unaffected by this lack of detail in the breakdown.
"The identifiers we utilize include gvkey, permno, cusip, ISS ID, and IRRC ID. Since some of these identifiers change over time we make use of Compustat link tables and match on year-firm cells to ensure the matching is correct.
16Data outliers were mostly observed in measures of institutional ownership collected from Thomson
Reuters. There are several instances in which the number of shares outstanding is lower than the num-ber of shares owned by managers. Matching the numnum-ber of shares outstanding from CRSP alleviated some of this concern but did not fully correct it. Other variables include measures of compensation, namely individual components with very large volatility, and the Tobin's
Q.
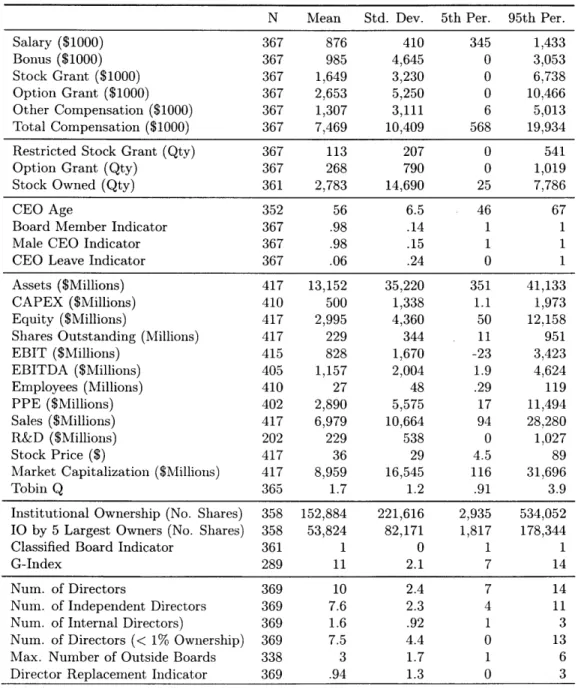
reports summary statistics for the variables utilized in our analysis. Table III
Summary Statistics
Information for each variable includes the number of observations, mean, standard deviation, 5th percentile and 95th percentile. Executive compensation is collected by Execucomp; accounting statements are collected Compustat; stock market data is collected by CRSP; institutional ownership is collected by Thomson Reuters (13f); and governance and director data are collected by ISS. We display information matched on the year of each firm's first board declassification vote.
N Mean Std. Dev. 5th Per. 95th Per.
Salary ($1000) 367 876 410 345 1,433 Bonus ($1000) 367 985 4,645 0 3,053 Stock Grant ($1000) 367 1,649 3,230 0 6,738 Option Grant ($1000) 367 2,653 5,250 0 10,466 Other Compensation ($1000) 367 1,307 3,111 6 5,013 Total Compensation ($1000) 367 7,469 10,409 568 19,934
Restricted Stock Grant (Qty) 367 113 207 0 541
Option Grant (Qty) 367 268 790 0 1,019
Stock Owned (Qty) 361 2,783 14,690 25 7,786
CEO Age 352 56 6.5 46 67
Board Member Indicator 367 .98 .14 1 1
Male CEO Indicator 367 .98 .15 1 1
CEO Leave Indicator 367 .06 .24 0 1
Assets ($Millions) 417 13,152 35,220 351 41,133
CAPEX ($Millions) 410 500 1,338 1.1 1,973
Equity ($Millions) 417 2,995 4,360 50 12,158
Shares Outstanding (Millions) 417 229 344 11 951
EBIT ($Millions) 415 828 1,670 -23 3,423 EBITDA ($Millions) 405 1,157 2,004 1.9 4,624 Employees (Millions) 410 27 48 .29 119 PPE ($Millions) 402 2,890 5,575 17 11,494 Sales ($Millions) 417 6,979 10,664 94 28,280 R&D ($Millions) 202 229 538 0 1,027 Stock Price ($) 417 36 29 4.5 89
Market Capitalization ($Millions) 417 8,959 16,545 116 31,696
Tobin
Q
365 1.7 1.2 .91 3.9Institutional Ownership (No. Shares) 358 152,884 221,616 2,935 534,052 IO by 5 Largest Owners (No. Shares) 358 53,824 82,171 1,817 178,344
Classified Board Indicator 361 1 0 1 1
G-Index 289 11 2.1 7 14
Num. of Directors 369 10 2.4 7 14
Num. of Independent Directors 369 7.6 2.3 4 11
Num. of Internal Directors) 369 1.6 .92 1 3
Num. of Directors (< 1% Ownership) 369 7.5 4.4 0 13
Max. Number of Outside Boards 338 3 1.7 1 6
IV.
Methodology and Identification Strategy
This section describes the panel regression discontinuity design from Cellini, Ferreira, and Roth-stein (2010) in which the regression discontinuity design (RDD) is adapted to an event study. In addition, we borrow from the work of Cufnat, Gine, and Guadalupe (2012) who expand on this approach and apply it to shareholder proposal votes.
A. Regression Discontinuity Design
The intent of our analysis is to determine the impact of shareholder proposals by comparing firms in which the proposal is approved to firms in which the proposal is rejected. In order to do so we specify the group of firms that have approved the proposal as the treatment group and the group of firms that have rejected the proposal as the control group.
Let us define the distance to the vote majority threshold as vf,t = vf,t -;vf,t where vf,t represents the percentage of votes in favor of approving the board declassification for firm
f
in year t, andVf,t represents the majority threshold that is required for the proposal to pass. A vote is approved
when the vote outcome exceeds the majority threshold, and it is rejected when the opposite takes place. As a result, we can define our treatment or pass indicator as Df,t = 1{i9,t ;>
0}.
In the absence of selection bias, the impact of approving a shareholder proposal on variable Yft can be determined by simply estimating the average difference between the treatment and control groups. This corresponds toY = a + 3Df,t + Ej,t (1)
Under this specification our coefficient
#
tells us exactly how Yf,t differs between the two groups. The problem of estimating a regression such as (1) is that the shareholder proposal outcome is en-dogenous. As a result, passing or rejecting a proposal is not random and the estimate / is likely to be biased.In order to overcome the issue of endogeneity we restrict our focus to a small range of votes around the majority threshold for which the outcome of the vote is random. As long as some randomness exists in the process of voting, which makes the vote outcome unpredictable to some degree1 7, then we can always determine an arbitrarily small interval1 8 around the majority thresh-old (if,t) where the approval or the rejection of the vote is random, as formally shown by Lee (2008). Intuitively, we argue that passing a vote with 51% of the votes in favor, or failing it with 49% of the votes in favor, is random since we are very close to the majority threshold and the underlying uncertainty of the voting process does not allow us to predict such a small deviation.
1 7
Some examples include shareholder turnout, undecided voters, and information timing.
8The smaller the randomness in the process of voting the smaller the interval, however, the size of the
Our identification strategy is fully reliant on this assumption and our estimates are biased if our assumption does not hold.
There are different specifications for the RDD setting ranging from parametric to non-parametric formulations with each type possessing its own benefits and drawbacks. We utilize the paramet-ric19 formulation used by Lee and Lemieux (2010) which approximates the continuous relationship between Yf,t and the running variable Tj,t through a polynomial in fOf,t. Similarly to Cufiat et al. (2012) we define the polynomial to the left of the threshold by Pi(3f,t, 01) and the polynomial to the right of the threshold by Pr(xft, 0'). Our RDD specification takes the form
Yf,t = a + Pi ( f,t, ) + 3Dft + Pr(fif,t, 0') + ef,t (2) where each of our polynomials can be written as
p1 (i f t, 01) = V f, t + 01 2,t + ... + 0
~
Prrif it,+ o(fiyt+ + ... + or~l
Df,t
In this specification the impact of the shareholder proposal is once again determined by the coefficient
0,
however, the estimate 3 is no longer biased and it correctly represents the causal effect of board declassification on variable Yft.B. Panel Regression Discontinuity Design
Our intent is to capture the causal impact of the proposal for up to 5 years20 after the vote takes place. One way to do this is to apply the specification (2) separately to every year. While this is a valid approach we can improve on it by stacking all of the annual realizations of our outcome variable Yf,t since there exist firm specific time invariant characteristics that are different across firms (Cellini, Ferreira, and Rothstein, 2010). For each shareholder proposal vote we stack observations from t - 2 to t + 5 and introduce calendar year, relative year, and firm level fixed effects. Our panel RDD takes the form
Yf,t+r = a + P i(ft,t,
4')
+ )3t+TDJ,t + Pr(f3 ,t,)+
5f + -/T + 0t+T + ef,t+r (3)
In this specification the subscript t corresponds to the calendar year in which the vote takes place and
r
corresponds to the number of years that have occurred since the vote took place (relative9
We utilize the parametric formulation followed by Lee and Lemieux (2010) instead of the non-parametric formulation followed by Imbens and Kalyanaraman (2011) since the parametric formulation utilizes all of our data when estimating the impact of shareholder proposals. This is desired due to sample size concerns given that we only include the first proposal on board declassification for each firm.
"We evaluate a range of 5 years since it can take a considerable amount of time for a company to declassify their board. A typical declassification process involves waiting 1 year for management to vote on the issue
year). The parameters Jf,
y,
and Ot+r are fixed effects for firms, relative years, and calendar years, respectively. Note that the indicator Dft and the polynomials need to be interacted with relative year indicator variables so that we can separate the effect for every relative year. This is why we introduce the subscript - in all of their respective coefficients. For instance, the coefficient 3t+2 for
T = 2 represents the effect of the proposal two years after the vote. Our estimation includes values
of T E [-2, 5] and we restrict the coefficients 1,
45,
and#t+r
to be equal to zero for T < 0. This allows us to capture the dynamics in the impact of the vote when firm level fixed effects are included.One last aspect to consider is that there exist a few cases in which the same executive serves as a CEO for different firms during different periods. This allows us to potentially observe the same executive in firms that have approved and firms that have rejected the vote. To take advantage of this variation and also address concerns associated with time invariant CEO characteristics we also construct a specification with executive level fixed effects. Our executive level panel RDD takes the form
Yi,f,t+r = a + Pl(3f,t, #1) + t+rDf,t + Pr( f,t, 4) + 6f + Y + 0t+r
+ Ai + Ei,f,t+r (4)
In this final specification the subscript i represents an individual executive and the parameter Ai captures the executive level fixed effects. It is important to highlight that the panel RDD yields exactly the same empirical estimates as the RDD if we only include relative year fixed effects. The benefit of the panel RDD comes from the application of the other fixed effects, especially firm level and executive level fixed effects as this changes the design from a purely cross sectional model to a dynamic model.
Throughout our analysis we make use of a linear parametric formulation since it offers a good fit for the impact of shareholder proposals on board declassification. The appendix section includes scatter plots of the annual RDD which illustrate this feature. Most findings are impervious to changes in the polynomial21.
C. Non-binding Nature of Proposals
A common concern surrounding the use of shareholder proposals as the source of an identifi-cation strategy lies with the fact that the outcome of these votes is non-binding. In truth, it is often the case that management either rejects or fails to vote on issues approved during shareholder annual meetings. Such occurrences may undermine the effectiveness of our approach, however, our identification is still valid as long as there exists a discrete jump in the probability of treatment at the discontinuity (Lee and Lemieux, 2010). From an empirical standpoint, both Ertimur et al. (2010) and Cufiat et al. (2012) provide evidence of a discontinuity in the probability of treatment. Nevertheless, we also apply our estimation procedure to board declassification indicators and find
similar results.
One of the most effective ways for shareholders to pressure management consists in withholding votes during director elections as documented by Guercio et al. (2008) and Yermack (2010). ISS itself provides a monitoring service to its institutional clients in which ISS actively monitors man-agement in order to determine if the measures approved in shareholder meetings are ignored by management22. If management fails to properly address shareholder concerns ISS will recommend all of its institutional clients to vote against the board during the next election cycle thus pressuring the board to conduct the desired changes.
V.
Validity of Quasi-Experiment
In this section we test the validity of our regression discontinuity design by conducting a series of statistical tests. The first subsection evaluates the density of the assignment variable in order to detect manipulation in the vote outcome. The second subsection evaluates the effect of consecutive voting in the vote outcome. The third subsection compares preexisting characteristics between firms on each side of the majority threshold.
A. Shareholder Proposal Density
The identification strategy behind our specifications relies on the random assignment of out-comes around the vote threshold. This implies that vote outout-comes cannot be endogenously deter-mined when you are in the neighborhood of the vote threshold. As such, the density of the running variable (ifjt) should not exhibit any sharp declines or bunching around the discontinuity since this would indicate that firms are somehow affecting the outcome of their shareholder proposals.
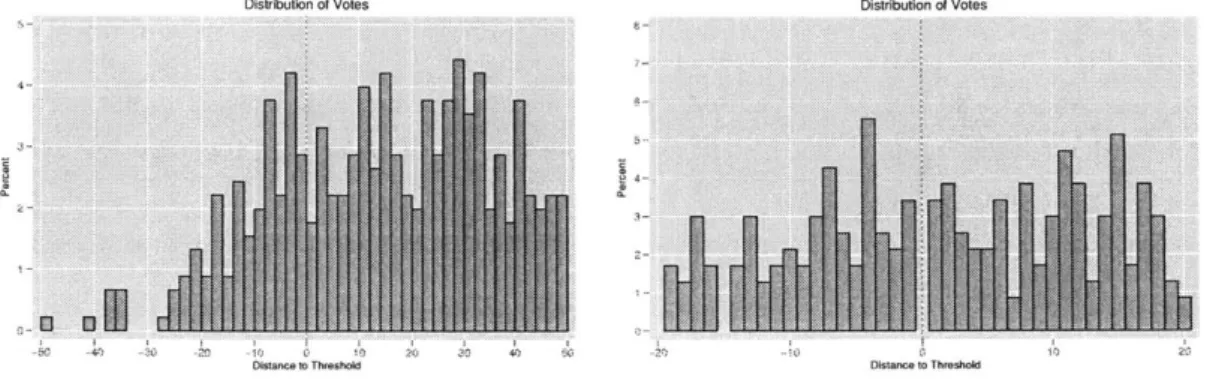
In order to address this concern figure 1 shows the distribution of first shareholder proposal vote outcomes between the years of 1997 and 2014. The graph on the left contains all observations of each firm's first vote and the graph on the right restricts the sample to realizations within 20 percentage points of the majority threshold. The figure suggests that most shareholder proposals on board declassification are approved with a high percentage of votes in favor. Nevertheless, the density of the assignment variable is stable and smooth around the threshold with no evidence of bunching.
In addition to the histograms we also conduct the McCrary (2008) density test which formally attempts to identify manipulation related to the continuity of the running variable density func-tion. In essence, the test determines the statistical significance of the running variable's density discontinuity estimate. A valid model would exhibit no discontinuity in which we fail to reject the null. For our particular dataset the McCrary test displays a log difference in height of 0.129 and a
2 2
This is explicitly highlighted in the responsiveness section of the ISS annual summary proxy voting guidelines.
Figure 1. Distribution of First Shareholder Proposal Votes (1997-2014)
Distribution of Votes Distribution of Votes
2
4-Dstance to Thrmshol Distan to Threshokd
standard error of 0.431 which puts the coefficient's t-statistic at 0.298. As a result, we fail to reject the null hypothesis which supports the validity of our RDD when applied to first votes.
B. Randomness of Consecutive Voting
In line with our previous assessment we begin by evaluating the density of the running variable for the sub-sample of consecutive votes. Figure 2 shows the distribution on consecutive shareholder proposal vote outcomes between the years of 1997 and 2014. The graph on the left contains all observations of each firm's consecutive votes and the graph on the right restricts the sample to realizations within 20 percentage points of the majority threshold. While there is a stark difference in the amount of votes falling in each side of the threshold there is no obvious evidence of bunching around the majority threshold.
Figure 2. Distribution of Consecutive Shareholder Proposal Votes (1997-2014)
Distribution of Votes Distribution ot Votes
In addition to the histograms we also conduct the McCrary density test for the sub-sample of consecutive votes. The test displays a log difference in height of 0.249 and a standard error of 0.391 which puts the coefficient's t-statistic at 0.637. The discontinuity is larger for consecutive votes, however, we still fail to reject the null hypothesis which supports the validity of our RDD when
applied to consecutive votes.
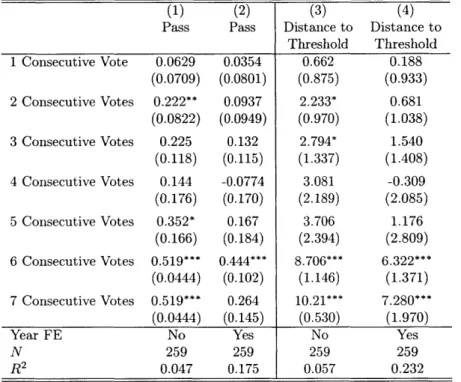
As a final test we estimate the effect of consecutive voting on the likelihood of passing a share-holder proposal and on the "distance to threshold" running variable. In columns (1) and (2) of Table IV we regress the pass indicator Dft on the number of consecutive votes. Results from panel A suggest that every consecutive vote increases the likelihood of passing the shareholder proposal by about 16%, however, the coefficient estimate decreases to 7% and becomes insignificant when we include calendar year fixed effects. In columns (3) and (4) we regress the assignment variable ,bf,t on the number of consecutive votes. Results from panel A suggest that every consecutive vote increases the "distance to threshold" by about 1.9%, however, the coefficient estimate decreases to 0.66% and becomes insignificant when we include calendar year fixed effects. Panel B2 3 provides a more detailed breakdown of this effect as we regress on separate indicators for each number of votes. While the results are broadly in line with previous findings, it is interesting to note that the effects are quite small when you only have one consecutive vote.
We ultimately decide to restrict our regression analysis to first votes as this provides a cleaner identification, however, it is still important to know that consecutive voting is not necessarily problematic. ISS only collects information on companies included in the S&P1500 and they do not contain information prior to the moment in which they join the index. As a result, we have no way to determine if they have voted on board declassification prior to joining the sample. Our findings mitigate this concern as consecutive voting is only problematic when it is undertaken a large amount of times.
C. Preexisting Heterogeneity
A standard test of the RDD consists in evaluating if there exist systematic differences between the firms on either side of the majority threshold before the shareholder meeting. Since our anal-ysis focuses on variables that are reported annually we compare firms the year before the date of each vote. Recall that our identification requires companies that lie in close proximity to the vote threshold to be comparable. Table V reports estimates of preexisting differences in firm charac-teristics across several dimensions: firm value, profitability, size, investment, leverage, institutional ownership, corporate governance, and board characteristics. Each row corresponds to a different regression and we only include the first vote of each firm. Column (1) reports coefficient estimates of the average difference for firms within 10 percentage points of the majority threshold. Results suggest that companies are similar across most dimensions as coefficients are either small or not statistically significant. Exceptions include the coefficients for the percentage of internal directors and the average number of outside boards. It appears that firms who pass shareholder proposals "Coefficients become increasingly less precise as we have very few observations with a high level of
con-secutive voting. For instance, there exist only 2 firms with 6 concon-secutive votes and I firm with 7 concon-secutive votes.
Table IV
Impact of Consecutive Voting on Vote Outcome
The table reports estimates of the impact of consecutive voting on the likelihood of passing shareholder proposals and the "distance to threshold" variable. All of the regressions are restricted to a sub-sample of votes within 10 percentage points of the majority threshold and include standard errors clustered at the firm level. Significance at the 10%, 5% and 1% levels is indicated by *,**, and ***, respectively.
Panel A: No. of Consecutive Votes
(1) (2) (3) (4)
Pass Pass Distance to Distance to Threshold Threshold Consecutive Vote 0.160** 0.0700 1.894** 0.655
Indicator (0.0570) (0.0658) (0.708) (0.782)
Year FE No Yes No Yes
N 259 259 259 259
R2 0.026 0.165 0.025 0.218
Panel B: Separate Indicators by No. of Consecutive Votes
(1) (2) (3) (4)
Pass Pass Distance to Distance to Threshold Threshold 1 Consecutive Vote 0.0629 0.0354 0.662 0.188 (0.0709) (0.0801) (0.875) (0.933) 2 Consecutive Votes 0.222** 0.0937 2.233* 0.681 (0.0822) (0.0949) (0.970) (1.038) 3 Consecutive Votes 0.225 0.132 2.794* 1.540 (0.118) (0.115) (1.337) (1.408) 4 Consecutive Votes 0.144 -0.0774 3.081 -0.309 (0.176) (0.170) (2.189) (2.085) 5 Consecutive Votes 0.352* 0.167 3.706 1.176 (0.166) (0.184) (2.394) (2.809) 6 Consecutive Votes 0.519*** 0.444*** 8.706*** 6.322*** (0.0444) (0.102) (1.146) (1.371) 7 Consecutive Votes 0.519*** 0.264 10.21*** 7.280*** (0.0444) (0.145) (0.530) (1.970)
Year FE No Yes No Yes
N 259 259 259 259
R2 0.047 0.175 0.057 0.232
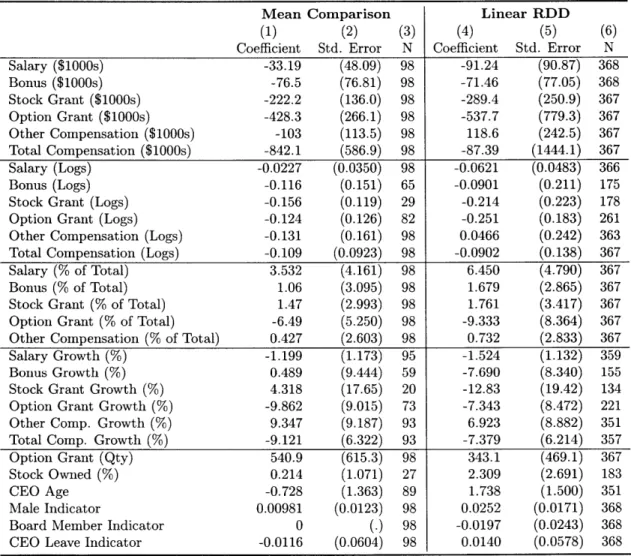
tend to have less internal directors and their board members tend to serve on more outside boards. Column (4) reports coefficient estimates when we apply the linear RDD instead of a simple com-parison of averages, thus offering a better approximation to the discontinuity. Most coefficients decrease in size and none of them are statistically significant thus providing evidence in favor of our underlying identification assumption. It appears that the significant coefficients in column (1) were a result of selection bias that vanished as we approached the threshold.
Table V
Preexisting Firm and Board Heterogeneity
The table reports preexisting differences between the treatment and control groups. The treatment group is comprised of companies who approve the board declassification proposal while the control group is comprised of those who fail it. All of the dependent variables relate to the year prior to each firm's first vote and every row corresponds to a separate regression. Column (1) reports the estimated effect of passing a vote on the outcome variables during year (t - 1). This regression is restricted to a sub-sample of votes within 10 percentage points of the majority threshold. Column (4) reports the estimated effect using a panel linear parametric regression discontinuity design. All of the regressions include calendar year fixed effects and standard errors are clustered at the firm level. Significance at the 10%, 5% and 1% levels is indicated by
and ***, respectively.
Mean Comparison Linear RDD
(1) (2) (3) (4) (5) (6)
Coefficient Std. Error N Coefficient Std. Error N
Tobin's
Q
0.0190 (0.224) 86 0.0785 (0.224) 328 ROA -0.00304 (0.0168) 96 0.0173 (0.0208) 366 Sales (Logs) -0.260 (0.249) 85 -0.0725 (0.241) 320 CAPEX (% of Assets) 0.00397 (0.0125) 92 0.00187 (0.0137) 360 Leverage (Debt\Assets) 0.00866 (0.0398) 98 0.0123 (0.0429) 368 Institutional Ownership (%) 5.392 (7.382) 49 2.619 (5.218) 250 10 5 Largest Owners (%) 1.435 (3.869) 49 -1.998 (2.964) 250 G-Index -0.460 (0.460) 85 -0.492 (0.506) 222Independent Directors (% of Total) 3.996 (3.356) 93 0.889 (3.309) 342 Internal Directors (% of Total) -3.566** (1.741) 93 0.589 (1.908) 342
Number of Directors 0.152 (0.593) 93 -0.818 (0.570) 342
Director Replacement Indicator 0.399 (0.305) 93 0.0887 (0.246) 342 Avg. Number of Outside Boards 0.319* (0.176) 67 0.0714 (0.168) 294
In addition to firm and board characteristics we also evaluate the CEOs of firms falling on either side of the majority threshold.
preexisting differences across Table VI reports estimates of preexisting differences in CEO characteristics across several dimensions: compensation level, com-pensation structure, comcom-pensation growth, company stock owned, and CEO indicators. Estimates from columns (1) and (4) are not statistically significant at conventional levels thus supporting our identification. Nevertheless, some of the compensation variables display coefficients that are far from zero. This concern is somewhat appeased as the panel RDD specifications with firm and executive level fixed effects take this initial statistically insignificant difference into account and partial it out as they only capture time dynamics. Overall, our underlying assumption holds as we do not find statistical evidence of preexisting differences between the firms on either side of the discontinuity.