HAL Id: hal-00296954
https://hal.archives-ouvertes.fr/hal-00296954
Submitted on 26 Sep 2006
HAL is a multi-disciplinary open access
archive for the deposit and dissemination of
sci-entific research documents, whether they are
pub-lished or not. The documents may come from
teaching and research institutions in France or
abroad, or from public or private research centers.
L’archive ouverte pluridisciplinaire HAL, est
destinée au dépôt et à la diffusion de documents
scientifiques de niveau recherche, publiés ou non,
émanant des établissements d’enseignement et de
recherche français ou étrangers, des laboratoires
publics ou privés.
Model based distributed water balance monitoring of
the White Volta catchment in West Africa through
coupled meteorological-hydrological simulations
S. Wagner, H. Kunstmann, A. Bárdossy
To cite this version:
S. Wagner, H. Kunstmann, A. Bárdossy. Model based distributed water balance monitoring of the
White Volta catchment in West Africa through coupled meteorological-hydrological simulations.
Ad-vances in Geosciences, European Geosciences Union, 2006, 9, pp.39-44. �hal-00296954�
Adv. Geosci., 9, 39–44, 2006 www.adv-geosci.net/9/39/2006/
© Author(s) 2006. This work is licensed under a Creative Commons License.
Advances in
Geosciences
Model based distributed water balance monitoring of the
White Volta catchment in West Africa through coupled
meteorological-hydrological simulations
S. Wagner1, H. Kunstmann1, and A. B´ardossy2
1Forschungszentrum Karlsruhe, Institute for Meteorology and Climate Research (IMK-IFU), Garmisch-Partenkirchen,
Germany
2Institute for Hydraulic Engineering, University of Stuttgart, Germany
Received: 23 January 2006 – Revised: 22 May 2006 – Accepted: 3 July 2006 – Published: 26 September 2006
Abstract. Sustainable water management requires the quan-tification of the spatial and temporal changes of water bal-ance variables. Fully distributed hydrological simulations of these variables are especially in regions with weak in-frastructure challenging, because the required meteorologi-cal input data are often not available in a sufficient spatial and temporal resolution. One possibility to deal with this limitation is to provide the required input data with a me-teorological model. This combination results in a one way meteorological-hydrological coupling system. Within the framework of the GLOWA-Volta project it is investigated to what extent meteorological models are able to provide the re-quired meteorological fields with sufficient accuracy for the hydrological modeling. For this study the mesoscale mete-orological model MM5 and the fully distributed water bal-ance simulation model WaSiM-ETH were first adapted and validated separately. The research area is the White Volta catchment in the semi-arid to sub-humid climate zone in West Africa. The meteorological simulations tend toward overestimating measured precipitation sums. The coupled meteorological-hydrological runoff simulations show simi-lar model performances as the simulations driven by obser-vations indicating the potential of this system for a contem-porary estimation of the terrestrial water balance.
1 Introduction
Sustainable water management in the Volta Basin of West Africa is hampered by the fact that only little hydro-meteorological information is available. The central ques-tion to be solved therefore is, whether a mainly model based water balance monitoring system can be used to provide sci-entifically sound quantification of the spatial and temporal
Correspondence to: S. Wagner
(sven.wagner@imk.fzk.de)
changes of water fluxes in the catchment. This information is of central importance for decision making in water resources management in the Volta basin.
In the northern part of the basin rain-fed agriculture is the major source of livelihood. Due to high population growth the demand for water supply, food and energy production in-creases permanently. The energy production, especially in Ghana, which shares around 40% of the Volta basin, is di-rectly linked to water availability because the main energy source is hydropower at Akosombo, a dam which was built in 1965 and impounds since then Lake Volta, one of the largest artificial lakes in the world. Because of weak infrastructure in the basin, observations of meteorological and hydrologi-cal variables are rare and no basin-wide long-term time se-ries are available. Furthermore, there is a delay of more than one year before measuring data of the complete basin are col-lected and digitised. This means that for near-term decision making the required information is not available by measur-ing data. Thus, it is investigated if a model based approach may provide this information. For the model based approach the results of the meteorological simulations are used as in-put data for the hydrological modeling.
2 Research area
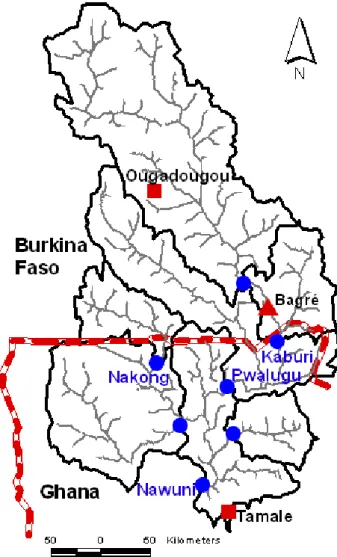
This one-way coupling system was applied for one of the main tributaries of the Volta basin, the White Volta catchment (94 044 km2) which is situated upstream of Lake Volta in Northern Ghana and Burkina Faso (Fig. 1). The White Volta basin is very flat particularly in the southern part (<0.1%). The predominant land use types are Guinea savannah in the southern and Sudan savannah in the northern part. The main geological systems of the basin are a Precambrian plat-form and a sedimentary layer, the Voltaian sandstone basin. The predominant soil types are lixisols in the southern and arenosols in the northern part (Jung, 2006). Since 1993 the
40 S. Wagner et al.: Water balance monitoring of the White Volta catchment
Fig. 1. Location of subcatchments and their outlets in the White
Volta catchment (resolution: 1 km).
White Volta catchment is disturbed by a dam and hydropower generation in Bagr´e in the South of Burkina Faso. For this reason and data availability the study focuses on the Ghana-ian part of the White Volta basin.
The Volta basin is situated in the semi-arid to sub-humid climate zone with mean annual temperature between 27 and 36◦C in the northern and between 24 and 30◦C in the south-ern part. Mean annual precipitation ranges from less than 300 mm (North) to more than 1500 mm in the South whereof around 80% falls between July and September. Evapotran-spiration is a very important factor in this region. The mean annual potential evaporation lies between 2500 mm in the North and 1500 mm in the South. Approximately 80% of the precipitation amount evapotranspirates during the rainy season (Oguntunde, 2004).
Fig. 2. Nesting strategy (3 domains) for the meteorological
model-ing with MM5 for the Volta basin.
3 Meteorological modeling
For the meteorological simulations the mesoscale meteo-rological model MM5 (Grell et al., 1994) was used. For this study MM5 was applied in non-hydrostatic mode to dynamically downscale the global atmospheric fields from 1◦ to 9 km resolution stepwise using three domains with horizontal resolutions of 81×81 km2 (61×61 gridpoints), 27×27 km2 (85×67 gridpoints) and 9×9 km2 (157×121 gridpoints) (Fig. 2). The required global analysis fields are obtained from the National Centers for Environmental Pre-diction (NCEP) with a temporal resolution of 6 h. For the vertical resolution 26 layers from the surface up to 30 hPa were chosen. In Domain1 available observations obtained from radiosondes were incorporated into the simulations to include vertical profiles of atmospheric variables into the modeling process. Kunstmann and Jung (2003) determined an adequate configuration of the available parameterisations for the Volta basin which was used for this study. These are the OSU-Land-Surface Model (Chen and Dudhia, 2001), the MRF-PBL scheme (Hong and Pan, 1996) for the planetary boundary layer, the convective (i.e. cumulus) parameterisa-tion according to Grell et al. (1994), the microphysics ac-cording to Reisner et al. (1998) (Mixed phase Graupel) and the cloud-radiation scheme (Grell et al., 1994). For this study the MM5 version 3.6 in the one-way nesting approach was used. The output was saved every 3 h.
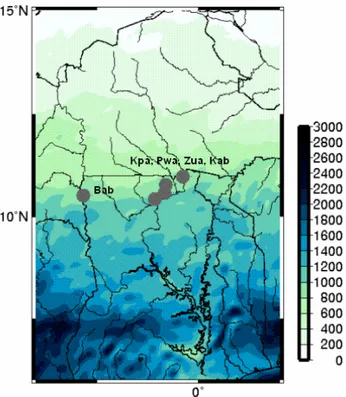
The simulation period was the year 2004. Figure 3 shows the spatial distribution of the simulated annual precipitation
S. Wagner et al.: Water balance monitoring of the White Volta catchment 41
Figure 3: Simulated annual precipitation sum for 2004 (Domain3: 9 x 9 km²) for the Volta basin and location of observation stations Kaburi, Kpasenkpe, Pwalugu, Babile and Zuarungu (North Ghana).
Figure 4: Comparison of simulated and measured monthly precipitation sums in 2004 for Kaburi, Kpasenkpe, Pwalugu, Babile, Zuarungu.
10
Fig. 3. Simulated annual precipitation sum for 2004 (Domain3:
9×9 km2)for the Volta basin and location of observation stations Kaburi, Kpasenkpe, Pwalugu, Babile and Zuarungu (North Ghana).
[mm] for Domain3 (9×9 km2). The precipitation distribution shows a strong North-South gradient with values of less than 300 mm in the North and over 1800 mm in the South. The scatter plot in Fig. 4 shows a comparison of the available ob-served and simulated monthly precipitation sums, because so far no continuous time series were available for the complete year 2004. Additionally, the scatter plot shows the variability of both the observation and the simulation. The coefficient of variation of the intra 9×9 km2-scale rainfall variability ranges between 0.25 and 0.4 (Friesen, 2003). Figure 4 shows a fairly well agreement for low and medium rainfall sums but for months with heavy rainfall the simulation overestimates the measured rainfall amount significantly. The coefficient of determination R2varies between 0.80 and 0.91. For the comparison it has to be considered that a point measurement (observation) is compared here with a result of the meteoro-logical model which is only able to simulate precipitation av-erages on a scale that is 2–4 times the model resolution. This is especially relevant for regions with a high spatial variabil-ity.
4 Hydrological modeling
For the hydrological simulations the Water balance Simu-lation Model WaSiM-ETH (Schulla and Jasper, 2000) was used. It is a deterministic, fully distributed modular model
Figure 3: Simulated annual precipitation sum for 2004 (Domain3: 9 x 9 km²) for the Volta basin and location of observation stations Kaburi, Kpasenkpe, Pwalugu, Babile and Zuarungu (North Ghana).
Figure 4: Comparison of simulated and measured monthly precipitation sums in 2004 for Kaburi, Kpasenkpe, Pwalugu, Babile, Zuarungu.
10
Fig. 4. Comparison of simulated and measured monthly
precip-itation sums in 2004 for Kaburi, Kpasenkpe, Pwalugu, Babile, Zuarungu.
for the simulation of the hydrologically important parts of the water balance and uses physically based algorithms for most processes. Fluxes in the unsaturated zone are calculated with the Richards-equation (Richards, 1931). The poten-tial evapotranspiration is calculated after Penman-Monteith (Monteith, 1975) and the real evapotranspiration is estimated by using a relation between soil moisture and actual capillary pressure. The calculation of interception is based on a sim-ple bucket approach. Groundwater fluxes are calculated by a two-dimensional flow model which is dynamically coupled to the unsaturated zone. Discharge routing is based on a cin-ematic wave approach.
The White Volta catchment was subdivided into 7 sub-catchments. The outlets of the subcatchments are located at hydrological stations, that simulated discharges can be com-pared with available measurements. The White Volta flows into Lake Volta, but because of backwater effects which can not be calculated by the model, the outlet of the model setup is not Lake Volta but the station Nawuni. The spatial reso-lution for this study is 1×1 km2 which results in a regular grid of 411×631 grid points. The temporal resolution de-pends on the availability of measurement data during the cal-ibration period which is 24 h for this study. In the vertical the soil is represented by 20 equidistant layers of 1 m thick-ness each. The model requires digital elevation data, grid-ded soil properties (derived from the global FAO soil map (FAO, 1971–81)) and gridded land use and hydrogeology in-formation (e.g. saturated hydraulic conductivity, residual and saturation water content) obtained from Martin and van de Giesen (2005). Due to the flat topography in the catchment and an independence of vegetation with altitude the inverse distance weighting method inclusive anisotropy was applied as interpolation method for the observed meteorological in-put data. The anisotropy impacts significantly the spatial pre-cipitation distribution in the White Volta basin which is char-acterised by strong latitudinal dependence. Relevant model
42 S. Wagner et al.: Water balance monitoring of the White Volta catchment
Figure 5: Simulated vs. measured river discharge at Nakong and Nawuni for the calibration period 1968.
Figure 6: Simulated vs. measured river discharge at Pwalugu and Nawuni for the validation period 1961-67.
11
Fig. 5. Simulated vs. measured river discharge at Nakong and Nawuni for the calibration period 1968.
parameters were adapted to the specific climatological con-ditions in the region.
The calibration of the model was done specific for each subcatchment. The recession of direct runoff and interflow both follow a single linear storage concept which required the calibration of the corresponding recession constants. Fur-thermore, the empirical scaling parameter drainage density (dr) which controls linearly the strength of interflow had to be calibrated. The groundwater model requires the cali-bration of two empirical parameters, the recession constant (krec), which describes the reduction of the saturated
hy-draulic conductivity with depth, and the initialisation of the groundwater level in a specific soil layer. The model cali-bration was performed manually. The calicali-bration period for this study was the year 1968. Especially in areas with weak infrastructure the most important criteria for the selection of a calibration period is the availability of measurement data in the required temporal resolution. For the year 1968 both me-teorological and hydrological measurement data were avail-able for both countries Burkina Faso and Ghana. Further-more, the flow regime of the White Volta was comparatively natural compared to now with the Bagr´e dam which splits the basin since 1993.
Figure 5 shows the results of the calibration for Nakong (a source basin) and Nawuni (complete basin). It can be seen that the general discharge hydrograph could be simulated
Figure 5: Simulated vs. measured river discharge at Nakong and Nawuni for the
calibration period 1968.
Figure 6: Simulated vs. measured river discharge at Pwalugu and Nawuni for the
validation period 1961-67.
11
Fig. 6. Simulated vs. measured river discharge at Pwalugu and
Nawuni for the validation period 1961–1967.
fairly well with Nash-Sutcliff model efficiencies of 0.72 for Nakong and 0.69 for Nawuni for daily discharges between April and December 1968. Nash-Sutcliff model efficiencies for all available subcatchments vary between 0.18 and 0.72. The validation of the hydrological model was performed for the period 1961–1967. For this period observation data at Pwalugu and Nawuni were only available. The simulation quality of the validation period is comparable, even slightly better with model efficiencies of 0.74 for Nawuni and 0.64 for Pwalugu (calibration period: 0.48) with one year pre-run (Fig. 6). One reason for the better model efficiencies for the validation period is the relative good agreement between sim-ulation and observation at low flow conditions during the dry season from November until April.
5 Coupled meteorological-hydrological modeling After both models were adapted to the White Volta basin the next step was the one-way coupling of the meteorological and hydrological model (Fig. 7). For the coupling, an inter-face was developed which generates the required meteoro-logical input data for the hydrometeoro-logical model from the results of the meteorological model. Five meteorological fields are passed: 2m-temperature, precipitation, 2 m-relative humid-ity, global radiation and 10 m-wind velocity.
S. Wagner et al.: Water balance monitoring of the White Volta catchment 43
Figure 7: Flowchart of the coupled meteorological-hydrological modeling system.
12
Fig. 7. Flowchart of the coupled meteorological-hydrological
mod-eling system.
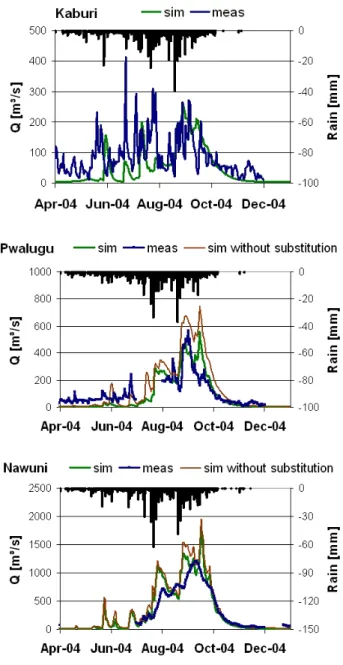
The results from the meteorological simulations for 2004 were processed with the developed interface. For the hydro-logical modeling the setup from the calibration period 1968 with meteorological observations was taken without recal-ibration for the coupled simulations. Figure 8 shows the discharge hydrographs of the coupled simulations for three stations along the White Volta. The observed discharges in Kaburi could not be simulated accurately because of the Bagr´e dam a few kilometres upstream which disturbed the natural flow regime. The discharge hydrographs downstream depend strongly on the management of the Bagr´e dam. Therefore, the simulated runoff was replaced by the mea-sured runoff at the next gauging station downstream which is Kaburi, to avoid the transmission of errors to the stream catchments. The discharge hydrographs of the down-stream catchments (Fig. 8, Pwalugu and Nawuni) could be simulated fairly well with Nash-Sutcliff model efficiencies of 0.52 for Pwalugu and 0.63 for Nawuni for daily discharges between April and December 2004. Additionally, the simu-lated hydrographs without substitution of simusimu-lated by mea-sured runoff at Kaburi are plotted to show the influence but also to demonstrate that the model efficiency downstream is not dominated by the substitution which could compensate the results of the coupled meteorological-hydrological model system.
The simulation in Pwalugu underestimates the hydrograph during the first months. The reason is that the storages are empty at the beginning of the model run and these storages have to be filled first before runoff accumulates. So far only one year was simulated but using the same year as pre-run did not work, because the storage processes are long-term (>1a) in this region. As 2005 data become available the simulations will be continued.
Figure 8: Coupled simulated vs. measured river discharge, plus simulated
hydrograph without substitution of simulated by measured values at Kaburi, for
Kaburi, Pwalugu and Nawuni.
Fig. 8. Coupled simulated vs. measured river discharge, plus
sim-ulated hydrograph without substitution of simsim-ulated by measured values at Kaburi, for Kaburi, Pwalugu and Nawuni.
The coupled meteorological-hydrological simulations show similar model performances as the simulations driven by observations.
6 Summary and conclusions
The distributed hydrological model WaSiM-ETH was adapted to the White Volta catchment. The results of the hydrological simulations driven by measuring data for the required meteorological input show that for the calibration and validation period the overall discharge hydrograph could be simulated satisfactorily considering the large catchment
44 S. Wagner et al.: Water balance monitoring of the White Volta catchment
size and weak data availability. The meteorological sim-ulation tends toward overestimating measured precipitation sums especially during rain intensive months. This issue will be analysed further as recent data of 2005 and 2006 and more observations become available. In spite of this trend the re-sults of the coupled meteorological-hydrological simulations show that the general course of the hydrographs can be repro-duced fairly well. The discharge is still partly overestimated but in a more moderate magnitude. This means that short-comings of the meteorological model in simulating the exact location and magnitude of precipitation are partly lessened in sub- and catchment scale considering the results of the hydrological simulations. The model efficiencies of the sim-ulations driven by observations and by meteorological model output are comparable. It is therefore concluded that the teorological simulations are able to provide the required me-teorological fields for hydrological simulations.
This coupled system has the potential for a model based contemporary estimation of the spatial and temporal changes of water balance variables. The basin-wide near-term esti-mation will provide crucial inforesti-mation for water resources management for the Volta basin.
Acknowledgements. This work was funded by the BMBF (German Ministry of Education and Research) through the project GLOWA-Volta. The collaboration with the Hydrological- and Meteorological Services Department in Ghana is gratefully acknowledged. The authors thank the reviewers for their suggestions for improvement. Edited by: R. Barthel, J. G¨otzinger, G. Hartmann, J. Jagelke,
V. Rojanschi, and J. Wolf Reviewed by: anonymous referees
References
Chen, F. and Dudhia, J.: Coupling an Advanced Land-Surface/Hydrology Model with the Penn State/NCAR MM5 Modeling System. Part I: Model Implementation and Sensitivity, Mon. Wea. Rev., 129, 569–585, 2001.
FAO: Soil map of the world, United Nations Food and Agriculture Organization, 1971–81.
Friesen, J.: Spatio-temporal Patterns of Rainfall in Northern Ghana, Diploma Thesis, University of Bonn, 63, 2003.
Grell, G., Dudhia, J., and Stauffer, D.: A description of the fifth-generation Penn State/ NCAR mesoscale model (MM5), NCAR Technical Note, NCAR/TN-398+STR, 1994.
Hong, S. and Pan, H.: Nonlocal boundary layer vertical diffusion in a medium-range forecast model, Mon. Wea. Rev., 124, 2322– 2339, 1996.
Jung, G.: Regional Climate Change and the Impact on Hydrology in the Volta Basin of West Afrika, PhD thesis at Forschungszentrum Karlsruhe, Garmisch-Partenkirchen, 12–15, 2006.
Kunstmann, H. and Jung, G.: Investigation of feedback mechanisms between soil moisture, land use and precipitation in West Africa, IAHS publications No. 280, Water Resources Systems- Water Availability and Global Change, 160–164, 2003.
Martin, N. and van de Giesen, N.: Spatial distribution of groundwa-ter production and development potential in the Volta river basin of Ghana and Burkina Faso, Water International, 30, 239–249, 2005.
Monteith, J. L.: Vegetation and the atmosphere, Vol. 1: Principles, Academic Press, London, 1975.
Oguntunde, P.: Evapotranspiration and complimentary relations in the water balance of the Volta basin: field measurements and GIS-based regional estimates, Cuviliier Verlag G¨ottingen, PhD Thesis, 15–16, 2004.
Reisner, J., Rasmussen, R., and Bruintjes, R.: Explicit forecast-ing of supercooled liquid water in winter storms usforecast-ing the MM5 mesoscale model, Quart. J. Roy. Meteor. Soc., 124B, 1071–1107, 1998.
Richards, L.: Capillary Conduction of liquids through porous medium, Physics, 1, 318–333, 1931.
Schulla, J. and Jasper, K.: Model Description WaSiM-ETH, ETH Z¨urich, 1–167, 2000.