HAL Id: hal-02987964
https://hal.archives-ouvertes.fr/hal-02987964
Submitted on 4 Nov 2020
HAL is a multi-disciplinary open access archive for the deposit and dissemination of sci-entific research documents, whether they are pub-lished or not. The documents may come from teaching and research institutions in France or abroad, or from public or private research centers.
L’archive ouverte pluridisciplinaire HAL, est destinée au dépôt et à la diffusion de documents scientifiques de niveau recherche, publiés ou non, émanant des établissements d’enseignement et de recherche français ou étrangers, des laboratoires publics ou privés.
in Paranthropus robustus from Swartkrans, South Africa
Christopher Dean, Clément Zanolli, Adeline Le Cabec, Mirriam Tawane, Jan
Garrevoet, Arnaud Mazurier, Roberto Macchiarelli
To cite this version:
Christopher Dean, Clément Zanolli, Adeline Le Cabec, Mirriam Tawane, Jan Garrevoet, et al.. Growth and development of the third permanent molar in Paranthropus robustus from Swartkrans, South Africa. Scientific Reports, Nature Publishing Group, 2020, 10 (1), pp.19053. �10.1038/s41598-020-76032-2�. �hal-02987964�
Growth and development
of the third permanent molar
in Paranthropus robustus
from Swartkrans, South Africa
Christopher Dean1,2*, Clément Zanolli3,4, Adeline Le Cabec3,5, Mirriam Tawane6,
Jan Garrevoet7, Arnaud Mazurier8 & Roberto Macchiarelli9,10
Third permanent molars (M3s) are the last tooth to form but have not been used to estimate age at dental maturation in early fossil hominins because direct histological evidence for the timing of their growth has been lacking. We investigated an isolated maxillary M3 (SK 835) from the 1.5 to 1.8-million-year-old (Mya) site of Swartkrans, South Africa, attributed to Paranthropus robustus. Tissue proportions of this specimen were assessed using 3D X-ray micro-tomography. Thin ground sections were used to image daily growth increments in enamel and dentine. Transmitted light microscopy and synchrotron X-ray fluorescence imaging revealed fluctuations in Ca concentration that coincide with daily growth increments. We used regional daily secretion rates and Sr marker-lines to reconstruct tooth growth along the enamel/dentine and then cementum/dentine boundaries. Cumulative growth curves for increasing enamel thickness and tooth height and age-of-attainment estimates for fractional stages of tooth formation differed from those in modern humans. These now provide additional means for assessing late maturation in early hominins. M3 formation took ≥ 7 years in SK 835 and completion of the roots would have occurred between 11 and 14 years of age. Estimated age at dental maturation in this fossil hominin compares well with what is known for living great apes.
The most easily observable and widely employed measure of dental maturation in modern humans, dental eruption, is in fact one of the least reliable1,2. Paradoxically, however, molar eruption has been the measure of
maturation most often used in comparative studies of humans with great apes and with fossil hominins3–8.
Min-eralised tooth tissues (enamel and dentine), on the other hand, contain daily increments of growth that are often well-preserved, even in fossil teeth9,10. These have been used to calibrate the eruption times of first permanent
molars (M1s) in fossil hominins and this has proved to be a reasonably successful method for assessing the time and patterning of dento-skeletal maturation in a broad comparative context6,11–16, if perhaps a less successful
proxy for other life history variables17–20. Nonetheless, despite the fact that greater numbers of late juvenile and
sub-adult fossil hominins of unknown chronological age are now associated with skeletal material approaching maturity21–28, assessing the end of the tooth maturation process remains problematic, as too few data exist to
reconstruct the timing of late third permanent molar (M3) development. Indeed, to date, the age at completion of the “wisdom tooth”, i.e., the measure of late dental maturity, has never been directly reconstructed, but only inferred in australopiths (Australopithecus and Paranthropus) and early Homo29,30.
The initial mineralisation of the M3 tooth in both great apes and early fossil hominins occurs at a chronologi-cally younger age than in modern humans. In Pan and Gorilla, the age range reported, albeit for relatively few individuals (Supplementary Text S1), spans almost 2.5 years, from 2.9 to 5.3 years31–37, but for a large number of
modern humans the range is much greater, at least 7 years, from 5 to 12 years38–41. Radiographically, in great apes,
either a large empty crypt in the jaw bone, or a minute mineralising M3 cusp tip within a crypt, appears close
OPEN
1Department of Earth Sciences, Natural History Museum, London, UK. 2Department of Cell and Developmental
Biology, University College London, London, UK. 3Univ. Bordeaux, CNRS, MCC, PACEA, UMR 5199, 33600
Pessac, France. 4Department of Maxillofacial and Oral Surgery, Sefako Makgatho Health Sciences University,
Ga-Rankuwa, Pretoria, South Africa. 5Department of Human Evolution, Max Planck Institute for Evolutionary
Anthropology, Leipzig, Germany. 6Ditsong National Museum of Natural History, Pretoria, South Africa. 7Deutsches
Elektronen-Synchrotron DESY, Hamburg, Germany. 8IC2MP, UMR 7285 CNRS, Université de Poitiers, Poitiers,
France. 9UMR 7194 CNRS, Muséum National D’Histoire Naturelle, Musée de L’Homme, Paris, France. 10Unité de
to the time of true M3 initiation. This happens as the premolars and second permanent molars (M2s) complete enamel formation (between the radiographically-defined fractional stages of tooth Crown ¾ complete and Root initiation) and as the first permanent molars (M1s) are close to root completion (between radiographic stages Root ¾ formed and Apex ½ closed) (Supplementary Table S1, Supplementary Figs. S1–S3).
Just one fossil hominin, the Early Pleistocene StW 151 from Sterkfontein, South Africa, variably attributed to early Homo42 or A. africanus43, or even considered as taxonomically indeterminate16, shows evidence of a large
empty M3 crypt, and is aged 4.62–4.70 years16,42. Unfortunately, the age at death of another fossil specimen with
an empty M3 crypt, the Early Pleistocene early Homo KNM-ER 820 from Koobi Fora, Kenya44,45, is yet to be
determined.
Clearly, there is insufficient evidence to determine a mean age for M3 initiation in early hominins. However, the comparative information increasingly available about the timing and sequence of these events in great apes and fossil specimens, notably for the stages of dental development both before and after M3 initiation16,37, strongly
suggests M3 initiation occurred in australopiths and early Homo sometime between 4 and 7 years of age. Early hominin specimens aged ~ 4 years or less at death, such as the SK 63 P. robustus specimen from Swartkrans, or the A. africanus Taung child, both from South Africa, show no evidence of M3 initiation16,46–49. Even with
a possible 3-year age range for M3 initiation, knowing the time taken for M3 crown and root formation in an early hominin would allow us to address a number of issues, including the likely age range at dental maturation.
Here we present the first histological data for the timing of M3 development in an early hominin. SK 835 is a maxillary left M3 attributed to the hominin taxon P. robustus and was recovered from the Early Pleistocene cave site of Swartkrans50. Following high-resolution virtual scanning and 3D imaging performed by X-ray
micro-tomography (µXCT; Supplementary Fig. S4), we made thin ground sections through the crown and roots that captured the whole of tooth growth (Supplementary Texts S2–S4, Supplementary Figs. S5–S7).
We used a combination of transmitted light microscopy (TLM) and synchrotron X-ray fluorescence (SXRF) to image the daily incremental growth markings in enamel and dentine. SXRF of this specimen revealed that apparently random bands of Sr enrichment were laid down in the crown and roots of this tooth during develop-ment. These, together with other prominent accentuated markings in enamel and dentine visible in TLM, were used to align the cusps and roots of SK 835 that formed at the same time. In this way we cross-matched daily incremental growth markings from different locations within the tooth and reconstructed the growth processes involved in enamel and dentine formation. One aim of this study was to shed light on the physical nature of the circadian growth increments preserved in the enamel and dentine.
There is now good evidence that circadian clocks operate in ameloblasts and odontoblasts51–54 and that
they regulate amelogenin secretion and other ameloblast activities55 as enamel prism formation cycles through
alternating fast and slow phases56–61. How exactly this circadian rhythm manifests as a fine dark cross striation
across the narrow slowly formed constriction of a prism body is however less clear55,56. Cross striations are more
porous62 and show a compositional contrast in back-scattered electrons-based (BSE) microscopic images that has
been attributed to increased carbonate content56, or perhaps to an alternating dominance of matrix over mineral
deposition during the day55. It is also likely that abrupt changes in enamel crystallite orientation and/or
continu-ity contribute to the appearance of cross striations in TLM and in polarised light microscopy (PLM)63,64. Raman
microscopy has previously shown that the peak intensity of OH, Ca2+ and PO4- occurs at the prism varicosity
and that the intensity of all three ions co-vary in a cyclic manner65.
Daily incremental markings in enamel and dentine enable the rates and timing of crown and root forma-tion to be retrieved from fossil teeth. A second aim of this study was thus to quantify the changing daily rates of enamel and dentine secretion throughout the entire growth of the SK 835 early hominin M3. A further aim was to put a time scale to the fractional stages of tooth formation commonly used in comparative radiographic and other imaging studies of modern humans, great apes and fossil hominins28,37,38,66,67. Since tooth growth is
a continuous and seamless process, we also reconstructed growth curves describing cuspal enamel secretion and the increase in tooth length along the once developmental boundaries between tissues, the enamel–dentine junction (EDJ) and the cementum–dentine junction (CDJ), and compared these with similar data for living hominids and fossil hominins.
Results
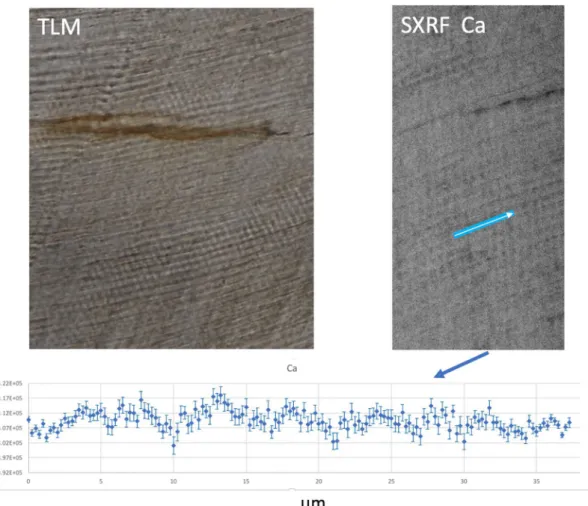
The nature of daily incremental markings. Two regions of SK 835 that in TLM showed clear daily enamel cross striations and daily dentine increments, were scanned with SXRF (at 0.25 µm resolution). In both tissues, the alternating light and dark increments visible in TLM corresponded most strongly with fluctuations in Ca concentration (Figs. 1 and 2). This suggests the brighter increments seen in TLM are relatively mineral dense and the darker increments less dense, which is consistent with previous BSE-based findings56,62. Broader
irregu-lar accentuated markings were also associated with more diffuse shifts in Ca concentration that spanned the underlying daily rhythms (Figs. 1 and 2). The regular daily changes in Ca concentration do not, however, occur abruptly at cross striations in the SXRF scans but more closely resemble the circadian fluctuations reported68 for
plasma ionized Ca2+. Interestingly in this SXRF study, unlike previous studies65, there was no discernible
varia-tion in phosphorus concentravaria-tion (a major component of hydroxyapatite) where the circadian rhythm has been reported to peak twice in a day68.
Rates of enamel formation. Four prism tracks were defined in the first-formed cuspal enamel of the SK 835 crown (Supplementary Fig. S7). Cumulative counts of daily increments were made at 100 µm intervals through the whole thickness of enamel, as well as measurements of cross striation spacings within ten succes-sively formed 60-day zones of cuspal enamel formation (Supplementary Text S3, Supplementary Figs. S7–S11). Some surface enamel was lost through wear, but 575–580 daily increments are still preserved in the tallest
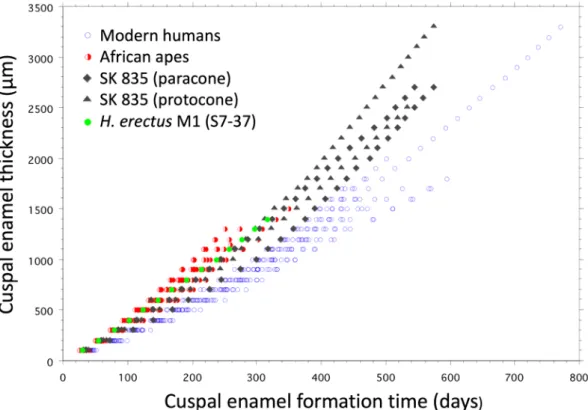
pro-tocone cusp of this P. robustus M3. Formation rates ranged between 3.2 µm/day, close to the EDJ, and rose to 8.28 µm/day before reducing again to ~ 7.3 µm/day close to the enamel surface. Formation rates in modern human molars rarely exceed 6.5 µm/day in outer cuspal enamel, but can also take 600–700 days to form thick molar cuspal enamel, as was likely the case in SK 835 (Supplementary Figs. S8–S11). The gradient of enamel formation through the cusps of this upper M3 are greater than measured in a sample of modern human molars (Fig. 3), but similar to that in some living great apes and other early hominin molars69–71.
By combining the four trajectories of the defined prism tracks, the average time (Y) taken to form a given thickness of occlusal enamel (X) in the SK 835 P. robustus tooth can be predicted from the equation (Eq. 1) given here (see Supplementary Text S3 for 95% confidence intervals):
Growth in tooth length. Teeth grow in length as cohorts of secretory cells differentiate in continuity, first along the boundaries between the EDJ in the crown, then beyond this in the root between the CDJ. The rate of differentiation (the extension rate), can be reconstructed from the daily formation rate and the slope of incre-mental or accentuated lines that represent the former position of the ameloblast or odontoblast cell sheet72–76.
To calculate the time and rate of extension in SK 835 between initial mineralisation of the tooth and completion of its root length, we used the average times taken to form an initial 200 µm thickness of enamel (61 days) or dentine (80 days), and the orientation of incremental markings to the EDJ or CDJ, respectively (Supplementary Texts S3–S4, Supplementary Figs. S12–S14). This was possible between protocone initiation to the end of its damaged palatal root. It was also possible in the preserved part of the paracone and separately in the detached distobuccal root (Fig. 5, Supplementary Text S4, Supplementary Fig. S7). Since each of these preserved compo-nents contain an intense SXRF Sr marker-line (Fig. 5), that formed at 4.1 years into tooth formation, they could be cross-matched in time and the cumulative tooth length plotted against formation time (Fig. 4).
(1) Y = 12.651 + .284X − 3.459e−5X2
R2
= .979 .
Figure 1. Transmitted light micrograph (TLM) of cervical enamel in the SK 835 protocone showing a region
with clear daily incremental markings (left image). A SXRF (synchrotron X-ray fluorescence) image in the same general region showing periodic fluctuations in Ca concentration. The plot across the blue transect is ~ 35 µm long and shows ~ 7 peaks and troughs (from left to right) in Ca concentration that fluctuate between 402,000 and 417,000 ppm. Error bars associated with each datapoint represent SD. The blue line represents the scan transect. (200 × 100 µm2, 17.0 keV, 0.25 µm, 10 ms, scan time 1 h).
For any given length (X) along the EDJ/CDJ, formation time (Y) in this P. robustus maxillary M3 can be predicted from the equation (Eq. 2) given here:
Fractional stages of tooth growth. For modern humans and many non-human primates, defined frac-tions of tooth formation in cross-sectional studies have proved a more practical way of compiling chronological growth standards than longitudinal growth curves for each tooth type1,2,37,66,67. However, they remain just
snap-shots of a continuous and seamless growth process.
Rates of tooth growth in early hominins differ from those compiled for modern humans and so the age standards for the fractional stages defined for modern humans do not compare77–79. To reconstruct the most
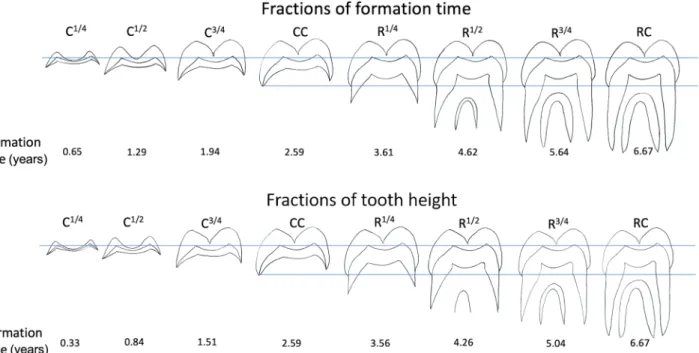
commonly used fractional stages of increasing tooth length (quarters of crown height and quarters of root length) for SK 835, we used the pattern of Sr banding and the accentuated markings in enamel and dentine together with the time scale derived from daily incremental markings. Figure 5 summarises the key formation times of each component in this fossil M3. In addition, we reconstructed new stages of tooth formation that represent the amount of tooth formed in quarters of crown and root formation time (Fig. 6; Supplementary Fig. S15). The last stage of root formation represented in Fig. 6 is root length completed (RC), that was attained in SK 835 at 6.67 years into M3 formation. The equation for cumulative increase in EDJ/CDJ length also allows M3 formation time in SK 835 to be predicted for any given length (Supplementary Table S2).
Using the evidence for root apex closure in SK 835 derived from its shorter mesiobuccal root to reconstruct final completion in the longer and last formed root apexes, which are damaged, is problematic, but a reasonable estimate is that this may have taken a year, or so, to close (Supplementary Text S4). A safe conclusion is that the whole of M3 formation in SK 835, from the dentine horn in the crown to root apex closure, would have taken no less than 7 years, and possibly longer.
Discussion
The estimate of ≥ 7 years for the time taken to grow an M3 in a representative of P. robustus, based on the data collected from the upper third molar specimen SK 835 from the 1.5–1.8 Mya site of Swartkrans, South Africa, represents the first direct evidence of this kind for any early hominin. Given a likely 4–7-year age range for M3 initiation, it now becomes possible to say that completion of the permanent dentition and root apex closure in SK 835 would have occurred sometime between 11 and 14 years of age. This estimate appears to compare well with what is known for dental maturation in living great apes19,32,34,37,80–82.
With respect to somatic growth, it has been suggested P. robustus showed a gorilla-like pattern of extended male growth (bimaturism)83. By assuming that, in principle, among samples of early hominins larger specimens
(2) Y = .018+8.875e−5X +4.414e−8X2
− 3.009e−12X3+ 4.581e−17X4+ 6.494e−22X5 R2= .993 .
Figure 2. Transmitted light micrograph (TLM) of daily dentine increments in the apical root dentine of the
palatal root of SK 835 (left image). A SXRF image of Ca concentration of the dentine in the same general region. The blue line is ~ 160 µm long and shows the transect represented in the plot of Ca concentration (from top to bottom) against distance (µm). Error bars associated with each datapoint represent SD. Across more than 30 incremental markings, Ca concentration fluctuated between 410,000 and 430,000 ppm but broader zones of lower Ca concentration spanned daily increments in some regions. (300 × 300 µm2, 17.0 keV, 0.25 µm, 10 ms,
are more likely males and the smaller ones females84, one could argue that SK 835 more likely represents a female
individual. Indeed, crown size in SK 835, especially for the mesiodistal diameter (M-D: 13.9 mm) but, to a lesser extent, also for the buccolingual diameter (B-L: 16.6 mm)50, is lower than the average values reported for the
P. robustus upper M3s sample from Swartkrans (n = 16; M-D: 14.9 mm, range 12.7–17.2 mm; B-L: 17.0 mm,
range 15.9–18.2 mm)85, and also lower, but only for the M-D diameter, than measured in the assemblage of P.
robustus M3s from the South African sites of Swartkrans, Kromdraai and Drimolen (n = 25; M-D: 14.5 mm,
range 12.1–17.2 mm; B-L: 16.5 mm, range 14.2–18.2 mm)86. Nonetheless, given the extent of tooth crown size
variation, and especially of the “wisdom tooth”, this remains a hazardous exercise for all early hominins, includ-ing P. robustus87.
Despite the large range of daily enamel secretion rates in M3 cuspal enamel reported in this study (3.28–8.28 µm/day), the average cuspal rate in SK 835 (overall protocone average 5.56 µm/day, SD = 1.63; over-all paracone average 4.89 µm/day, SD = 1.24) compares well with the data for KB 5223, another Paranthropus specimen43 from the Early Pleistocene site of Kromdraai B (5.05 µm/day) but which has also previously been
attributed to early Homo88. In general, these cuspal rates also compare well with the average estimates provided
for P. robustus (5.7 µm/day)89 and with those previously determined for other fossil hominins such as StW 151
(5.53 µm/day) and early Homo (6.06 µm/day)16. Previously published data for inner cuspal enamel formation
rates in P. robustus (4.07–4.25 µm/day) have, however, tended to be higher89–91 than measured in SK 835 (3.28 µm/
day). In fact, the inner rates of occlusal enamel formation reported here for SK 835 align better with rates previ-ously reported and summarised by Lacruz et al.71 for Pan troglodytes (3.62 µm/day), A. afarensis (3.31 µm/day),
P. aethiopicus (3.5 µm/day), P. boisei (2.94 µm/day), H. rudolfensis (3.01 µm/day), H. habilis (3.68 µm/day), and H. erectus (3.05 µm/day). When comparing such data sets, much depends on how close to the EDJ cross
stria-tion spacing measurements have been possible and on the different definistria-tions of inner cuspal enamel. These new results for SK 835 do however suggest it may be premature to use summary differences in rates of enamel formation rather than gradients through time to support taxonomic differences55,92.
Figure 3. Plot showing increase of enamel thickness against enamel formation time (days). For each 100-µm
thickness of cuspal enamel, the number of daily increments were counted along prism tracks and summed. In SK 835 the trajectories between the EDJ and the enamel surface are shown as grey filled diamonds (paracone) and triangles (protocone). The lowest of these is the buccal paracone trajectory that overlaps with data for modern humans of all three molar types pooled (n = 20, open blue circles). The trajectories for SK 835 are similar to a sample of African apes of all three molar types pooled (n = 12 Pan, n = 8 Gorilla, red half-filled circles) and a single M1 specimen of H. erectus (S7-37) (filled green circles). Thick cuspal enamel in SK 835 continues to form over a longer period of time than in African apes and early H. erectus. Modern human molars follow a slower trajectory. This results from slower inner rates of enamel secretion continuing at a slow rate for a longer time. Cusps may grow thick or thin along either trajectory. One human molar (M3) is exceptionally thick ~ 3,300 µm and took more than 2 years to form cuspal enamel. Daily cross striation spacings in the same human M3 are also profiled in Supplementary Fig. S10.
Ramirez Rozzi79 has calculated that secretory ameloblasts in thick enamelled molars attributed to P. boisei
continue to form cuspal enamel for a greater proportion of the total crown formation time (53.8%, range in
n = 14 M3s, 43–73%) than, for example, in thinner enamelled gorillas (15–23%, n = 8 molars). In SK 835, cuspal
enamel in the protocone continued to form for 580/945 days, or 61% of the total crown formation time. Enamel thickness seems likely to be an adaptation to extend the chewing-lifespan of a tooth in the face of an abrasive diet93, but average enamel thickness (AET) is also a major component of absolute crown strength (ACS) that
confers resistance to fractures associated with mechanically resistant foods94. The weaving (or decussation) of
enamel prisms as they pass from the EDJ to the enamel surface is also a crack-stopping adaptation95, but strong
decussation, especially close to the EDJ, is one factor that slows the rate at which cuspal enamel thickness accu-mulates. Prisms in P. boisei and P. robustus enamel run straighter for longer and form at a faster rate through cuspal enamel and this creates a different pattern of more tightly spaced Hunter-Schreger bands than in early
Homo and modern humans85,96. This narrow banding pattern may be one manifestation of a trade-off to both
form thick enamel resistant to a lifetime’s abrasion in as short a time as possible, but which also confers maximal fracture-resistant properties with minimal decussation. However, despite P. robustus and modern humans both exhibiting relatively thick-enamelled molars (i.e., similar relative enamel thickness [RET] values; Supplementary Text S5, Supplementary Table S3, Supplementary Fig. S16), this condition is achieved in different ways. Molar cuspal enamel close to the EDJ in modern humans forms more slowly for a longer period of time than in P.
robustus (Fig. 3) and other australopiths70. Cuspal enamel formation rates in P. robustus (SK 835) immediately
start to increase from the EDJ and reach rates in the outer enamel that exceed those in modern humans (Sup-plementary Figs. S9–S10). Together with differences in crown shape, this relatively thick but faster-formed cuspal enamel in P. robustus, confers a higher crown resistance to fractures in P. robustus M3s than in modern humans (as assessed by the ACS index; Supplementary Table S3).
Crown formation time in SK 835 (2.59 years; Figs. 5 and 6; Supplementary Text S3) compares well with previ-ous estimates of 2.12–2.59 years of molar crown formation times in P. boisei from Koobi Fora, Kenya77, and with
those of 2.7 years estimated for n = 14 Plio-Pleistocene hominin M3s from the Omo Valley, Ethiopia79. Both the
crown formation time of SK 835 and the total tooth formation time (≥ 7 years) also compare well with the only other fossil hominin molar for which the whole of tooth formation has been reconstructed histologically: the S7-37 upper M1 attributed to H. erectus from the Early Pleistocene site of Sangiran, Java97. In this latter specimen,
crown formation took 2.6 years and total tooth formation time 7.3 years70,98,99. Figure 7 shows that the difference
in growth between SK 835 and the Indonesian fossil hominin molar lies largely in the fast root extension rates
Figure 4. Combined plot of increase in tooth length in both cusps along the EDJ and then up to crown
completion in the protocone (arrow at 2.59 years) and continuing beyond this along the CDJ in the damaged palatal root and then onwards to root length complete in the distobuccal root (arrow at 6.75 years). The roots are cross-matched at 4.12 years (Sr line). The plot is extended here to apex closure (AC) at 7.75 years. Each of the component crown and root plots are combined as a single best-fit cumulative growth curve. The plot shows increasing distance along the EDJ/CDJ (µm) against formation time (years) and is expressed here by a 5th order polynomial that allows formation time (Y) to be predicted from a known value of EDJ/CDJ length (X). Although apex closure is extended to 7.75 years here, it may have taken less time. Predictions, using the following formula, of tooth formation time for each successive 1 mm of growth in length along the EDJ/CDJ are also given in Supplementary Table S2: (Eq. 2) Y = .018 + 8.875e−5X + 4.414e−8X2 − 3.009e−12X3 + 4.581e−17X4 + 6.494e−22X5;
that set the P. robustus tooth apart from extant humans, Pan and Gorilla as well as this single representative of
H. erectus. Considered here in a comparative context, SK 835, with absolutely longer tooth roots, shows faster
rates of root extension, and as far as can be judged from a limited sample size, most closely resembles molar tooth root growth in gorillas.
It must of course be acknowledged that these new data for M3 formation times, derived from the analysis of the P. robustus specimen SK 835 from Swartkrans, are for a single tooth and that the age range for M3 initia-tion among early hominins remains uncertain. However, they provide another line of evidence for assessing maturation during late development in fossil hominins and, importantly, one that is independent of standards established for great apes and/or modern humans1,2,37,66,67. Specifically, if the 3-year range of initiation times and
stages of M3 development in SK 835 were to encompass those in other fossil hominins, they would bracket the still debated chronological age at death in TM 1517, the holotype of P. robustus where M3 root formation is at stage R¾28, to between 9.04 and 12.04 years. Extending these kind of age estimates to other P. robustus specimens
with incomplete M3s seems reasonable in the absence of any other direct evidence, although age estimates for other early fossil hominins remain speculative.
Supplementary Table S4 lists some key specimens with incompletely formed M3s. For one thing it dem-onstrates how many early fossil hominins are known with incompletely formed M3s but for which no age at death estimates, however broad, have been possible using the M3. Based on the present results obtained for SK 835, a range of age at death estimates, all be it a wide range, is now possible when virtual histology15,16 or other
approaches are either impossible or impractical, or pending. Notably, the MH1 Early Pleistocene A. sediba from Malapa, South Africa, and another individual with a well-preserved partial skeleton attributed to H. erectus from West Turkana, Kenya (KNM-WT 15000), both have a complete or near-complete M3 crown14,24,30,100. Based on
the findings of this study, these early hominins would both fall within the age range 6.59–9.59 years. Moreover, a further H. erectus specimen with associated postcranial elements from the Early Pleistocene site of Dman-isi, Georgia (D2700/D2735), with approximately half of the M3 root formed, would fall within the age range 8.26–11.26 years23,101. Based on the evidence from SK 835, it is possible to state that completion of the permanent
dentition and root apex closure in early hominins generally would have been between 11 and 14 years of age. The data presented here also allow us to re-examine previous studies of M3s in early hominins that have focused on australopith paleobiology and behaviour. Especially relevant are the contextual issues relating to australopith habitat, mobility, and growth102,103. Previous research using strontium isotope analysis suggested
that P. robustus had a chimpanzee-like residence pattern implying male philopatry and female exogamy, i.e.,
Figure 5. Mosaic of five SXRF montaged images showing Sr concentration (intensity) of three ground sections
of SK 835. These are cross-matched to a prominent Sr line in the three separate roots (yellow arrows) that formed at 4.1 years (1505 days) into M3 formation. Tooth formation (initiation) is denoted at zero days (red arrow) in the protocone. The formation times for crown completion (945 days, green arrow) and the stage of tooth root length complete at 2465 days, (RC, purple arrow) are derived from the histological data for daily increments of growth in the crown and root and rates of root extension. Daily rates of dentine formation in the mesiobuccal root apex (2.87 µm/day) were used to estimate the time taken to complete closure of the distobuccal root apex (< 362 days, blue dotted line). Total tooth formation time is estimated to have been ≥ 7 years.
with the adolescent females emigrating from their natal groups102. More recently, Sillen and Balter103 measured
the ratio 87Sr/86Sr in eight M3s from Swartkrans, all attributed to P. robustus but of undiagnosed sex. Given that
their laser ablation scan-tracks closely follow the cuspal/occlusal trajectories defined in this study, and based on our results for cuspal enamel formation times in SK 835, it can be now estimated that these laser ablation tracks are likely to span 500–600 days of enamel formed during the first half of M3 crown formation. Assuming a 3-year range for M3 initiation in P. robustus, this suggests that only enamel formed between ~ 5.5 and 8.5 years of age was sampled in all eight individuals examined by Sillen and Balter103. It is significant that all individuals
showed 87Sr/86Sr signatures consistent with having lived and died in their immediate locality at these ages, with
no evidence of having moved in from elsewhere103. However, it is clear from this study that 5 or 6 years of M3
development still remained and, as Sillen and Balter103 pointed out, this more than ever now leaves open questions
about seasonal and/or permanent spatial displacement of P. robustus individuals across the differing landscapes during the later stages of M3 development. The presence of such clear Sr banding in the roots of SK 835 (Fig. 5) suggests the prospect of answering such questions is promising.
The data for M3 development presented in this study fill a gap in our knowledge about late dental develop-ment in early hominins. They provide a new and independent line of evidence for assessing the age at death of sub-adult specimens. They also demonstrate the potential of combining high-resolution elemental analysis with more traditional histological analysis of fossil tooth tissues.
Methods
X-ray micro-tomography (µXCT). The microtomographic acquisition of SK 835 was performed in 2015 at the PLATINA platform of the IC2MP set at the (University of Poitiers, France), with the EasyTom XL Duo laboratory device (RX-solutions, France). A sealed microfocus X-ray source (L12161-07, Hamamatsu Photonics, Japan) was used coupled to a flat panel detector (PaxScan 2520DX, Varian, USA). The specimen was scanned at a spatial resolution of 25 µm according to the following acquisition parameters: 70 kV (tube voltage); 350 µA (tube current); 1184 projections; 9.3 frames per second; averaging of 15 frames per projection; filtration of the beam by a 1.2 mm aluminium filter; a source-to-detector distance and a source-to-object distance of 368 mm and 72.5 mm, respectively. We applied a procedure using random shifts of the detector to avoid the presence of ring artefacts on the reconstructed images. We also recorded 32 reference images at the end of the microtomographic scan to correct for possible beam drift. The data were reconstructed in 16 bits TIF images with the XAct software (RX-solutions). For the reconstruction, we applied a filtered back projection algorithm based on the Feldkamp method for cone beam geometry associated with a Tukey filter and beam hardening artefacts were corrected through linearization with a polynomial function.
Figure 6. Diagrammatic representations of a P. robustus M3, based on SK 835, showing successive ¼ fraction
stages of time between crown initiation (Ci) and root completion (RC) as well as ¼ fraction stages of crown height and root height. Either stages of time fractions or of height fractions can be matched to any developing hominin M3, which ever fits best, and to the formation time estimated for SK 835 (given here in years). Adding a 3-year range (from 4 to 7 years) for M3 initiation times to the age given for any fractional stage provides a range of chronological ages for dental development that, although wide, may bracket the undoubted variation there would be in M3 growth and development generally. Supplementary Table S4 lists 21 Plio-Pleistocene hominins with incomplete M3s. Note that crown completion (CC) and root completion (RC) are identical in both formation stage sequences.
Image processing, virtual reconstruction and enamel thickness assessment. A semiautomatic threshold-based segmentation of SK 835 was conducted using Avizo v.8.0 (FEI Visualization Sciences Group, Hillsboro), following an adaptation of the half-maximum height method104. The segmented tooth fragments
were then refitted together using landmarks on corresponding aspects to reconstruct the original tooth and a constrained smoothing was applied to generate its 3D surface (Supplementary Fig. S4). Linear and surface meas-urements of enamel, crown dentine and pulp were taken on the virtual buccolingual section passing through the mesial dentine horns. Two bidimensional indices assessing enamel thickness were then computed based on these variables: the relative enamel thickness index (2D RET) and the absolute crown strength (ACS)94. Data for
SK 835 were compared with microtomographic-based records of M3s representing P. robustus (original data), modern humans (original data), Pan (105 and collections of the Institut Català de Paleontologia Miquel
Crusa-font), Gorilla105, and Pongo (Ref.105, collections of the Institut Català de Paleontologia Miquel Crusafont, Museo
di Storia Naturale di Trieste, Musée Zoologique de Strasbourg).
Histological section preparation. SK 835 consists of three separate crown fragments and three separate root fragments (Supplementary Text S2, Supplementary Figs. S4–S7). These were all first cleaned, scanned and imaged using µXCT (see above), and then either partially reassembled for sectioning or, in the case of two roots, sectioned separately. The dentine horns within the cusps were located with µXCT images to help define best planes of histological section. Histological methods are also provided in Dean et al.106,107. Crown and root
frag-ments were sectioned longitudinally with a low speed diamond saw (Buehler IsoMet). The cut block face that contained the best plane of section was lightly lapped through a series of silicon carbide abrasive papers
(Bue-hler CarbiMet, P800-P1200) and then taken to a mirror finish using 1 µm aluminium oxide powder (Bue(Bue-hler, MicroPolish) and deionised water on a felt polishing pad (Buehler ChemoMet). Polishing and cutting residue
was cleared from the block in an ultrasonic bath. After 24 h in a silica gel desiccator, the polished block face was fixed under pressure for 48 h to a 1 mm thick glass slide using a low viscosity slow-curing dual component epoxy resin designed for glass (Huntsman Araldite 2020). A second cut was then made parallel with the block face/glass slide leaving ~ 300 µm tooth tissue attached to the slide. This was lapped plane-parallel to ~ 100 µm in a hand-held extrudable steel slide holder (Buehler) first on fine wet abrasive papers (P2500) and then for final polishing on a soft polishing cloth (Buehler MicroCloth) with a 1 µm diamond suspension (MetaDi Poly 1 µm) to ensure
Figure 7. Increase in cumulative tooth length against tooth formation time. The plot shows increasing distance
along the EDJ/CDJ (µm) against formation time (years) for a sample of modern human molars (M2, n = 8; M3, n = 8; blue open circles), Pan M3s (n = 10; green half-filled circles) and Gorilla (M1, n = 2; M2, n = 2; M3, n = 2; red open circles), data from9,75. Superimposed onto these extant taxa are SK 835 (black filled circles) and an M1,
S7-37 from Java, attributed to H. erectus, (dark blue filled circles), data from70,75. Increase in crown height along
the EDJ in SK 835 overlaps with some modern humans and some Gorilla specimens. However, root growth in SK 835, that begins at 2.59 years, stands out as faster than all but a few Gorilla M2s and M3s. Despite having considerably longer roots than, for example the H. erectus M1 root, completion in these two contrasting fossil molars occurs at approximately the same time in ~ 7 years from tooth initiation since rates of root extension are faster in SK 835.
no surface contamination (e.g., with alumina powder) that might affect SXRF scans. While SXRF scans were performed without a coverslip, sections were cleared in xylene and mounted with DPX (Distyrene, Phthalate plasticiser in xylene) for transmitted light microscopy.
Synchrotron X-ray fluorescence (SXRF) imaging. Experiments were performed on the P06 Beamline108,109, Petra III, at DESY (Deutsches Elektronen-Synchrotron, Hamburg, Germany, a member of the
Helmholtz Association HGF). The storage ring was operated in 40-bunch mode using top-up filling mode with a current of 100 mA ± 0.5 mA. The primary X-ray beam was monochromatised to 17.0 keV using a dou-ble crystal Si111 monochromator and focused using a Kirkpatrick-Baez (KB) mirror system (JTEC, Japan) to 500 × 500 nm2. For this experiment, the set-up comprised a Maia 384C detector system110, ideally used in
“back-scatter” geometry to maximise the solid angle during analysis of thin polished samples (~ 100 µm-thick in this study) and allowing for large area SXRF imaging with a sub-µm resolution using millisecond dwell times111.
Further details on the set-up are provided in Dean et al.106,107. Elements of primary interest were Ca and Sr.
Spec-tral analysis, deconvolution and initial image analysis of the fluorescence data were performed using GeoPIXE 7.4f.112. The X-ray yield calculations were performed assuming a hydroxyapatite matrix (Ca
10(PO4)6(OH)2) with
density 3.1 g/cm3 close to enamel113 and final sample thickness of 80–100 µm. Glass slides were included in the
overall sample model as appropriate. Concentrations were determined using a conversion factor (photon counts to equivalent charge) through measurement of a standard Ni foil with areal density 50.0 µg/cm2 (Micromatter
Technologies Inc. Canada). Elemental distribution maps were normalised to the incoming X-ray flux. SXRF
con-centrations are reported as parts-per-million (ppm or µm/g).
Overview scans of the mesiobuccal and distobuccal roots of SK 835 were made at 10 µm, 10 ms, and each took 5.0 h. Scans of the central cuspal/occlusal enamel, the protocone and palatal root together, and the paracone, were also performed at 10 µm, 10 ms, and took between 1.3 and 5.5 h. Two regions of interest were then scanned to image daily enamel cross striations (at 0.25 µm 10 ms and 1 h) and daily dentine increments (at 0.25 µm 10 ms and 4.5 h). Using GeoPIXE 7.4f., two sets of elemental profiles for Ca were made along transects defined on the SXRF scans of enamel and dentine daily increments (Figs. 1 and 2).
Histological methods. Data for daily rates of enamel and dentine formation were collected with TLM (Supplementary Texts S3–S4). Groups of ameloblasts secret prisms (long bundles of hydroxyapatite crystallites) that extend from the EDJ to the enamel surface. The change in spacing (or repeat interval) of daily enamel cross striations along prisms was measured and counted through enamel in SK 835 to provide rates and times of cuspal enamel formation. Repeated measurements across groups of daily increments in enamel and dentine were made at multiple locations within a 200-µm zone of the EDJ or CDJ and an average value was used as the rate of for-mation for this given thickness of tissue. Previous methods of calculating total enamel forfor-mation times58,59,72,114
were adapted to estimate the rate at which ameloblasts and odontoblasts differentiated, or extended, across the whole length of the crown and/or root73–75,115. At the start of crown or root formation, a line was projected from
the EDJ or CDJ (point ‘a’ in Supplementary Fig. S14) along the direction of enamel or dentine apposition to a point 200 µm deep (point ‘c’ in Supplementary Fig. S14). Accentuated incremental markings representing the slope of the original forming cell sheet were identified at point ‘c’ and traced back to, but further along, the EDJ or CDJ in the direction of crown and root formation (point ‘b’ in Supplementary Fig. S14). The rate of increase in crown or root length (defined as the extension rate72) equals the distance between points ‘a’ and ‘b’ divided by
the time taken to form the 200-µm thickness of tissue between ‘a’ and ‘c’ (Supplementary Fig. S14). This proce-dure was repeated consecutively to the end of tooth formation and the cumulated data plotted as a growth curve.
Data availability
Raw images and derived data supporting the findings of this study are available from the corresponding author (C.D.) on request.
Received: 5 August 2020; Accepted: 15 October 2020
References
1. Konigsberg, L. & Holman, D. L. 11 Estimation of age at death from dental emergence and implications. In Human Growth in the Past: Studies from Bones and Teeth vol. 25 (eds Hoppa, R. D. & FitzGerald, C. M.) 264–289 (Cambridge University Press, Cambridge, 1999).
2. Liversidge, H. M. Variation in modern human dental development. In Growth and Development in the Genus Homo (eds Thompson, J. L. et al.) 73–113 (Cambridge University Press, Cambridge, 2003).
3. Dart, R. A. Australopithecus africanus: The Man-Ape of South Africa. Nature 115, 195–199 (1925).
4. Schultz, A. H. Eruption and decay of the permanent teeth in primates. Am. J. Phys. Anthropol. 19, 489–581 (1935). 5. Schultz, A. H. The Life of Primates (Universe Books, Bloomington, 1969).
6. Smith, B. H. Dental development as a measure of life history in primates. Evolution 43, 683–688 (1989).
7. Smith, B. H. Life history and the evolution of human maturation. Evol. Anthropol. Issues News Rev. 1, 134–142 (1992). 8. Kelley, J. & Schwartz, G. T. Life-history inference in the early hominins Australopithecus and Paranthropus. Int. J. Primatol. 33,
1332–1363 (2012).
9. Dean, M. C. Retrieving chronological age from dental remains of early fossil hominins to reconstruct human growth in the past. Philos. Trans. R. Soc. B Biol. Sci. 365, 3397–3410 (2010).
10. Dean, C. How the microstructure of dentine can contribute to reconstructing developing dentitions and the lives of hominoids and hominins. C. R. Palévol. 16, 557–571 (2017).
11. Bromage, T. G. & Dean, M. C. Re-evaluation of the age at death of immature fossil hominids. Nature 317, 525–527 (1985). 12. Smith, B. H. Dental development in Australopithecus and early Homo. Nature 323, 327–330 (1986).
13. Dean, M. C. Tooth microstructure tracks the pace of human life-history evolution. Proc. R. Soc. B Biol. Sci. 273, 2799–2808 (2006).
14. Le Cabec, A., Tafforeau, P., Smith, T. M., Carlson, K. J. & Berger, L. R. Dental development of the Australopithecus sediba juvenile MH1 determined from synchrotron virtual paleohistology. In Proceedings of the European Society for the study of Human Evolu-tion 3 103 (2014).
15. Le Cabec, A., Tang, N. K. & Tafforeau, P. Accessing developmental information of fossil hominin teeth using new synchrotron microtomography-based visualization techniques of dental surfaces and interfaces. PLoS ONE 10, e0123019 (2015). 16. Smith, T. M. et al. Dental ontogeny in pliocene and early pleistocene hominins. PLoS ONE 10, e0118118 (2015). 17. Robson, S. L. & Wood, B. Hominin life history: reconstruction and evolution. J. Anat. 212, 394–425 (2008).
18. Smith, T. M. et al. First molar eruption, weaning, and life history in living wild chimpanzees. Proc. Natl. Acad. Sci. 110, 2787 (2013).
19. Machanda, Z. et al. Dental eruption in East African wild chimpanzees. J. Hum. Evol. 82, 137–144 (2015).
20. Kelley, J., Schwartz, G. T. & Smith, T. M. Age at first molar emergence in Pan troglodytes verus and variation in the timing of molar emergence among free-living chimpanzees. J. Hum. Evol. 145, 102823 (2020).
21. Brown, F., Harris, J., Leakey, R. & Walker, A. Early Homo erectus skeleton from west Lake Turkana, Kenya. Nature 316, 788–792 (1985).
22. Walker, A. & Leakey, R. (eds) The Nariokotome Homo erectus Skeleton (Harvard University Press, Cambridge, 1993). 23. Lordkipanidze, D. et al. Postcranial evidence from early Homo from Dmanisi, Georgia. Nature 449, 305–310 (2007). 24. Berger, L. R. et al. Australopithecus sediba: A new species of Homo-like australopith from South Africa. Science 328, 195–204
(2010).
25. Berger, L. R. et al. Homo naledi, a new species of the genus Homo from the Dinaledi Chamber, South Africa. eLife 4, e09560 (2015).
26. Cameron, N., Bogin, B., Bolter, D. & Berger, L. R. The postcranial skeletal maturation of Australopithecus sediba. Am. J. Phys. Anthropol. 163, 633–640 (2017).
27. Bolter, D. R., Elliott, M. C., Hawks, J. & Berger, L. R. Immature remains and the first partial skeleton of a juvenile Homo naledi, a late Middle Pleistocene hominin from South Africa. PLoS ONE 15, e0230440 (2020).
28. Cazenave, M. et al. Reassessment of the TM 1517 odonto-postcranial assemblage from Kromdraai B, South Africa, and the maturational pattern of Paranthropus robustus. Am. J. Phys. Anthropol. 172, 714–722 (2020).
29. Beynon, A. D. & Dean, M. C. Distinct dental development patterns in early fossil hominids. Nature 335, 509–514 (1988). 30. Dean, M. C. & Smith, B. H. Growth and development of the nariokotome youth, KNM-WT 15000. In The First Humans—Origin
and Early Evolution of the Genus Homo: Contributions from the Third Stony Brook Human Evolution Symposium and Workshop October 3rd–October 7th (eds Grine, F. E. et al.) 101–120 (Springer, Dordrecht, 2009).
31. Anemone, R. L., Watts, E. S. & Swindler, D. R. Dental development of known-age chimpanzees, Pan troglodytes (primates, pongidae). Am. J. Phys. Anthropol. 86, 229–241 (1991).
32. Anemone, R. L., Mooney, M. P. & Siegel, M. I. Longitudinal study of dental development in chimpanzees of known chronological age: implications for understanding the age at death of Plio-Pleistocene hominids. Am. J. Phys. Anthropol. 99, 119–133 (1996). 33. Beynon, A. D., Dean, M. C. & Reid, D. J. Histological study on the chronology of the developing dentition in gorilla and
oran-gutan. Am. J. Phys. Anthropol. 86, 189–203 (1991).
34. Kuykendall, K. L. Dental development in chimpanzees (Pan troglodytes): The timing of tooth calcification stages. Am. J. Phys. Anthropol. 99, 135–157 (1996).
35. Dean, C. & Wood, B. A digital radiographic atlas of great apes skull and dentition. In Digital Archives of Human Paleobiology (eds Bondioli, L. & Macchiarelli, R.) (ADS Solutions, Milan, 2003).
36. Schwartz, G. T., Reid, D. J., Dean, M. C. & Zihlman, A. L. A faithful record of stressful life events recorded in the dental devel-opmental record of a juvenile gorilla. Int. J. Primatol. 27, 1201–1219 (2006).
37. Kralick, A. E. et al. A radiographic study of permanent molar development in wild Virunga mountain gorillas of known chrono-logical age from Rwanda. Am. J. Phys. Anthropol. 163, 129–147 (2017).
38. Liversidge, H. M. Timing of human mandibular third molar formation. Ann. Hum. Biol. 35, 294–321 (2008).
39. Liversidge, H. M. Predicting mandibular third molar agenesis from second molar formation. Acta Stomatol. Croat. 42, 311–317 (2008).
40. AlQahtani, S. J., Hector, M. P. & Liversidge, H. M. Brief communication: the London atlas of human tooth development and eruption. Am. J. Phys. Anthropol. 142, 481–490 (2010).
41. Reid, D. J. & Guatelli-Steinberg, D. Updating histological data on crown initiation and crown completion ages in southern Africans. Am. J. Phys. Anthropol. 162, 817–829 (2017).
42. Moggi-Cecchi, J., Tobias, P. V. & Beynon, A. D. The mixed dentition and associated skull fragments of a juvenile fossil hominid from Sterkfontein, South Africa. Am. J. Phys. Anthropol. 106, 425–465 (1998).
43. Zanolli, C. et al. What is South African early Homo? New insights from the molar endostructural signature. Proc. Eur. Soc. Study Hum. Evol. 7, 206 (2018).
44. Leakey, R. E. F. & Wood, B. A. New evidence of the genus Homo from East Rudolf, Kenya. II. Am. J. Phys. Anthropol. 39, 355–368 (1973).
45. Dean, M. C. The dental developmental status of six East African juvenile fossil hominids. J. Hum. Evol. 16, 197–213 (1987). 46. Conroy, G. C. & Vannier, M. W. Dental development in South African australopithecines. Part I: Problems of pattern and
chro-nology. Am. J. Phys. Anthropol. 86, 121–136 (1991).
47. Dean, M. C., Beynon, A. D., Thackeray, J. F. & Macho, G. A. Histological reconstruction of dental development and age at death of a juvenile Paranthropus robustus specimen, SK 63, from Swartkrans, South Africa. Am. J. Phys. Anthropol. 91, 401–419 (1993). 48. Dean, M. C. Hominoid tooth growth; using incremental lines in dentine as markers of growth in modern human and fossil primate teeth. In Human Growth in the Past. Studies from Bones and Teeth (eds Hoppa, R. & FitzGerald, C.) 111–127 (Cambridge University Press, Cambridge, 1999).
49. Lacruz, R. S., Ramirez Rozzi, F. V. & Bromage, T. G. Dental enamel hypoplasia, age at death, and weaning in the Taung child. South Afr. J. Sci. 101, 567–569 (2005).
50. Robinson, J. T. The Dentition of the Australopithecinae (Transvaal Museum, Pretoria, 1956).
51. Athanassiou-Papaefthymiou, M. et al. Molecular and circadian controls of ameloblasts. Eur. J. Oral Sci. 119, 35–40 (2011). 52. Lacruz, R. S. et al. The circadian clock modulates enamel development. J. Biol. Rhythms 27, 237–245 (2012).
53. Zheng, L. et al. The tick tock of odontogenesis. Exp. Cell Res. 325, 83–89 (2014).
54. Papakyrikos, A. M. et al. Biological clocks and incremental growth line formation in dentine. J. Anat. 237, 367–378 (2020). 55. Lacruz, R. S. Chapter 4: genetic regulation of amelogenesis and implications for hominin ancestors. In Developmental Approaches
to Human Evolution (eds Boughner, J. C. & Rolian, C.) 61–75 (Wiley, Hoboken, 2015).
56. Boyde, A. Carbonate concentration, crystal centers, core dissolution, caries, cross striations, circadian rhythms, and composi-tional contrast in the SEM. J. Dent. Res. 58, 981–983 (1979).
57. Boyde, A. E. In Handbook of Microscopic Anatomy (eds Oksche, A. & Vollrath, L.) Vol. 6, 309–473 (Springer, Berlin Heidelberg, 1989).
59. Risnes, S. Enamel apposition rate and the prism periodicity in human teeth. Eur. J. Oral Sci. 94, 394–404 (1986).
60. Bromage, T. G. Enamel incremental periodicity in the pig-tailed macaque: a polychrome fluorescent labeling study of dental hard tissues. Am. J. Phys. Anthropol. 86, 205–214 (1991).
61. Zheng, L. et al. Circadian rhythms regulate amelogenesis. Bone 55, 158–165 (2013).
62. Shellis, R. P. Relationship between human enamel structure and the formation of caries-like lesions in vitro. Arch. Oral Biol. 29, 975–981 (1984).
63. Risnes, S. Growth tracks in dental enamel. J. Hum. Evol. 35, 331–350 (1998).
64. Li, C. & Risnes, S. SEM observations of Retzius lines and prism cross-striations in human dental enamel after different acid etching regimes. Arch. Oral Biol. 49, 45–52 (2004).
65. Desoutter, A. et al. Cross striation in human permanent and deciduous enamel measured with confocal Raman microscopy. J. Raman Spectrosc. 50, 548–556 (2019).
66. Moorrees, C. F. A., Fanning, E. A. & Hunt, E. E. Jr. Age variation of formation stages for ten permanent teeth. J. Dent. Res. 42, 1490–1502 (1963).
67. Demirjian, A., Goldstein, H. & Tanner, J. M. A new system of dental age assessment. Hum. Biol. 45, 211–227 (1973). 68. Markowitz, M., Rotkin, L. & Rosen, J. Circadian rhythms of blood minerals in humans. Science 213, 672 (1981).
69. Beynon, A. D., Dean, M. C. & Reid, D. J. On thick and thin enamel in hominoids. Am. J. Phys. Anthropol. 86, 295–309 (1991). 70. Dean, C. et al. Growth processes in teeth distinguish modern humans from Homo erectus and earlier hominins. Nature 414,
628–631 (2001).
71. Lacruz, R. S., Dean, M. C., Ramirez Rozzi, F. V. & Bromage, T. G. Megadontia, striae periodicity and patterns of enamel secretion in Plio-Pleistocene fossil hominins. J. Anat. 213, 148–158 (2008).
72. Shellis, R. P. Variations in growth of the enamel crown in human teeth and a possible relationship between growth and enamel structure. Arch. Oral Biol. 29, 697–705 (1984).
73. Dean, M. C. A histological method that can be used to estimate the time taken to form the crown of a permanent tooth. In Forensic Microscopy for Skeletal Tissues: Methods and Protocols Vol. 915 (ed. Bell, L. S.) 89–100 (Humana Press, Berlin, 2012). 74. Guatelli-Steinberg, D., Floyd, B. A., Dean, M. C. & Reid, D. J. Enamel extension rate patterns in modern human teeth: two
approaches designed to establish an integrated comparative context for fossil primates. J. Hum. Evol. 63, 475–486 (2012). 75. Dean, M. C. & Cole, T. J. Human life history evolution explains dissociation between the timing of tooth eruption and peak
rates of root growth. PLoS ONE 8, e54534 (2013).
76. Dean, M. C., Humphrey, L., Groom, A. & Hassett, B. Variation in the timing of enamel formation in modern human deciduous canines. Arch. Oral Biol. 114, 104719 (2020).
77. Beynon, A. D. & Wood, B. A. Patterns and rates of enamel growth in the molar teeth of early hominids. Nature 326, 493–496 (1987).
78. Ramirez Rozzi, F. V. Tooth development in East African Paranthropus. J. Hum. Evol. 24, 429–454 (1993).
79. Ramirez Rozzi, F. V. Time of crown formation in Plio-Pleistocene Hominid teeth. In Structure, Function and Evolution of Teeth (ed. Moggi-Cecchi, J.) 217–238 (International Institute for the Study of Man, Firenze, Italy, 1995).
80. Fooden, J. & Izor, R. J. Growth curves, dental emergence norms, and supplementary morphological observations in known-age captive orangutans. Am. J. Primatol. 5, 285–301 (1983).
81. Zihlman, A., Bolter, D. & Boesch, C. Wild chimpanzee dentition and its implications for assessing life history in immature hominin fossils. Proc. Natl. Acad. Sci. U. S. A. 101, 10541–10543 (2004).
82. Zihlman, A. L., Bolter, D. R. & Boesch, C. Skeletal and dental growth and development in chimpanzees of the Taï National Park, Côte D’Ivoire. J. Zool. 273, 63–73 (2007).
83. Lockwood, C. A., Menter, C. G., Moggi-Cecchi, J. & Keyser, A. W. Extended male growth in a fossil hominin species. Science 318, 1443 (2007).
84. Plavcan, J. M. Sexual dimorphism in hominin ancestors. In The International Encyclopedia of Anthropology (eds Callander, H. & Coleman, S.) 1–6 (American Cancer Society, New York, 2018).
85. Wood, B. A. Koobi Fora research project Vol. 4 (Clarendon Press, Oxford, 1991).
86. Moggi-Cecchi, J., Menter, C., Boccone, S. & Keyser, A. Early hominin dental remains from the Plio-Pleistocene site of Drimolen, South Africa. J. Hum. Evol. 58, 374–405 (2010).
87. Plavcan, J. M. A re-analysis of sex differences in landscape use in early hominins: a comment on Copeland and colleagues. J. Hum. Evol. 63, 764–769 (2012).
88. Braga, J. & Thackeray, J. F. Early Homo at Kromdraai B: probabilistic and morphological analysis of the lower dentition. C. R. Palevol 2, 269–279 (2003).
89. Lacruz, R. S. Enamel microstructure of the hominid KB 5223 from Kromdraai, South Africa. Am. J. Phys. Anthropol. 132, 175–182 (2007).
90. Lacruz, R. S. & Bromage, T. G. Appositional enamel growth in molars of South African fossil hominids. J. Anat. 209, 13–20 (2006).
91. Lacruz, R. S., Ramirez Rozzi, F. V. & Bromage, T. G. Variation in enamel development of South African fossil hominids. J. Hum. Evol. 51, 580–590 (2006).
92. Wood, B. & Harrison, T. The evolutionary context of the first hominins. Nature 470, 347–352 (2011). 93. Pampush, J. D. et al. Homoplasy and thick enamel in primates. J. Hum. Evol. 64, 216–224 (2013).
94. Schwartz, G. T., McGrosky, A. & Strait, D. S. Fracture mechanics, enamel thickness and the evolution of molar form in hominins. Biol. Lett. 16, 20190671 (2020).
95. Ziscovici, C., Lucas, P. W., Constantino, P. J., Bromage, T. G. & van Casteren, A. Sea otter dental enamel is highly resistant to chipping due to its microstructure. Biol. Lett. 10, 20140484 (2014).
96. Beynon, A. D. & Wood, B. A. Variations in enamel thickness and structure in East African hominids. Am. J. Phys. Anthropol. 70, 177–193 (1986).
97. Grine, F. E. & Franzen, J. L. Fossil hominid teeth from the Sangiran Dome (Java, Indonesia). Cour. Forsch. Senckenberg 171, 75–103 (1994).
98. Dean, M. C. & Liversidge, H. M. Age estimation in fossil hominins: comparing dental development in early Homo with modern humans. Ann. Hum. Biol. 42, 415–429 (2015).
99. Dean, M. C. Measures of maturation in early fossil hominins: events at the first transition from australopiths to early Homo. Philos. Trans. R. Soc. B Biol. Sci. 371, 20150234 (2016).
100. Smith, B. H. The physiological age of KNM-WT 15000. In The Nariokotome Homo erectus skeleton (eds Leakey, R. E. & Walker, A.) 195–220 (Harvard University Press, Cambridge, 1993).
101. Vekua, A. et al. A New Skull of Early Homo from Dmanisi, Georgia. Science 297, 85 (2002).
102. Copeland, S. R. et al. Strontium isotope evidence for landscape use by early hominins. Nature 474, 76–78 (2011).
103. Sillen, A. & Balter, V. Strontium isotopic aspects of Paranthropus robustus teeth; implications for habitat, residence, and growth. J. Hum. Evol. 114, 118–130 (2018).
104. Coleman, M. N. & Colbert, M. W. Technical note: CT thresholding protocols for taking measurements on three-dimensional models. Am. J. Phys. Anthropol. 133, 723–725 (2007).
106. Dean, M. C., Le Cabec, A., Spiers, K., Zhang, Y. & Garrevoet, J. Incremental distribution of strontium and zinc in great ape and fossil hominin cementum using synchrotron X-ray fluorescence mapping. J. R. Soc. Interface 15, 20170626 (2018).
107. Dean, M. C., Spiers, K. M., Garrevoet, J. & Le Cabec, A. Synchrotron X-ray fluorescence mapping of Ca, Sr and Zn at the neonatal line in human deciduous teeth reflects changing perinatal physiology. Arch. Oral Biol. 104, 90–102 (2019).
108. Schroer, C. G. et al. Hard X-ray nanoprobe at beamline P06 at PETRA III. Nucl. Instrum. Methods Phys. Res. Sect. B Beam Interact. Mater. At. 616, 93–97 (2010).
109. Boesenberg, U. et al. Fast X-ray microfluorescence imaging with submicrometer-resolution integrating a Maia detector at beamline P06 at PETRA III. J. Synchrotron Radiat. 23, 1550–1560 (2016).
110. Kirkham, R. et al. The Maia spectroscopy detector system: engineering for integrated pulse capture, low-latency scanning and real-time processing. AIP Conf. Proc. 1234, 240–243 (2010).
111. Falkenberg, G. et al. Large-scale high-resolution micro-XRF analysis of histological structures in the skin of the pigeon beak. X Ray Spectrom. 46, 467–473 (2017).
112. Ryan, C. G. et al. Nuclear microprobe – synchrotron synergy: Towards integrated quantitative real-time elemental imaging using PIXE and SXRF. Nucl. Microprobe Technol. Appl. 231, 183–188 (2005).
113. Weidmann, S. M., Weatherell, J. A. & Hamm, S. M. Variations of enamel density in sections of human teeth. Arch. Oral Biol. 12, 85–97 (1967).
114. Boyde, A. Estimation of age at death of young human skeletal remains from incremental lines in the dental enamel. Excerpta Med. Int. Congr. Ser. 80, 36–46 (1963).
115. Antoine, D., Hillson, S. & Dean, M. C. The developmental clock of dental enamel: a test for the periodicity of prism cross-striations in modern humans and an evaluation of the most likely sources of error in histological studies of this kind. J. Anat. 214, 45–55 (2009).
Acknowledgements
The SXRF work presented in this study was supported by DESY Project proposal I‐20180047 and by the project CALIPSOplus under the Grant Agreement 730872 from the EU Framework Programme for Research and Inno-vation HORIZON 2020. We thank the DESY User Office, Dr. Gerald Falkenberg, Dr. Kathryn Spiers and those who have developed techniques employed in this study. We acknowledge the support to C.D. from the Calleva Foundation and to A.L.C. from The Max Planck Society. C.Z. and R.M. received support from the AESOP and AESOP+ consortia coordinated by José Braga. We sincerely acknowledge Stephany Potze for her help in 2015 at the Ditsong Nat. Museum Nat. History (DNMNH), Pretoria. We thank William Kimbel, Helen Liversidge, Ann Margyelashvili, Philip Rightmire, Friedemann Schrenk, Fred Spoor and Francis Thackeray for their help and sup-port. For access to comparative µCT data of extant hominids, we thank Marie-Dominique Wandhammer (Mus. Zool. Strasbourg), Salvador Moyà-Solà, David M. Alba, Josep Fortuny and Alessandro Urciuoli (Inst. Català Paleontol. Miquel Crusafont), Deborah Arbulla (Mus. Storia Nat. Trieste) and the Morphosource Database (https ://www.morph osour ce.org). We extend our sincere thanks to the referees for their comments and suggestions.
Author contributions
C.D., C.Z. and R.M. conceived and planned the study. C.Z., A.M. and R.M performed the µXCT acquisitions and image processing. C.Z. performed µXCT-based measurements. C.D. prepared the specimen and collected the histological record data. J.G., A.L.C. and C.D. designed and performed the SXRF scans, J.G. and A.L.C recon-structed the SXRF data and C.D. and A.L.C. analysed and interpreted the related data. M.T. provided curatorial assistance and granted access to fossil specimens curated at the DNMNH. C.D., C.Z. and R.M. wrote the paper with contributions from all authors.
Competing interests
The authors declare no competing interests.
Additional information
Supplementary information is available for this paper at https ://doi.org/10.1038/s4159 8-020-76032 -2.
Correspondence and requests for materials should be addressed to C.D. Reprints and permissions information is available at www.nature.com/reprints.
Publisher’s note Springer Nature remains neutral with regard to jurisdictional claims in published maps and
institutional affiliations.
Open Access This article is licensed under a Creative Commons Attribution 4.0 International
License, which permits use, sharing, adaptation, distribution and reproduction in any medium or format, as long as you give appropriate credit to the original author(s) and the source, provide a link to the Creative Commons licence, and indicate if changes were made. The images or other third party material in this article are included in the article’s Creative Commons licence, unless indicated otherwise in a credit line to the material. If material is not included in the article’s Creative Commons licence and your intended use is not permitted by statutory regulation or exceeds the permitted use, you will need to obtain permission directly from the copyright holder. To view a copy of this licence, visit http://creat iveco mmons .org/licen ses/by/4.0/.
1
Growth and development of the third permanent molar in Paranthropus robustus from Swartkrans, South Africa
Christopher Dean1,2*, Clément Zanolli3,4, Adeline Le Cabec3,5, Mirriam Tawane6, Jan Garrevoet7, Arnaud
Mazurier8 & Roberto Macchiarelli9,10
1Department of Earth Sciences, Natural History Museum, London, UK. 2Department of Cell
and Developmental Biology, University College London, London, UK. 3Univ. Bordeaux,
CNRS, MCC, PACEA, UMR 5199, F-33600 Pessac, France. 4Department of Maxillofacial and
Oral Surgery, Sefako Makgatho Health Sciences University, Ga-Rankuwa, Pretoria, South Africa; 5Department of Human Evolution, Max Planck Institute for Evolutionary
Anthropology, Leipzig, Germany. 6Ditsong National Museum of Natural History, Pretoria,
South Africa. 7Deutsches Elektronen-Synchrotron DESY, Hamburg, Germany. 8IC2MP, UMR
7285 CNRS, Université de Poitiers, Poitiers, France. 9UMR 7194 CNRS, Muséum national
d'Histoire naturelle, Musée de l'Homme, Paris, France. 10Unité de Formation Géosciences,
Université de Poitiers, Poitiers, France. *email: ucgacrd@ucl.ac.uk
Supplementary Information includes:
- Supplementary Texts S1-S5 - Supplementary Tables S1-S4 - Supplementary Figures S1-S17 - Supplementary References