HAL Id: hal-02903028
https://hal.archives-ouvertes.fr/hal-02903028
Submitted on 6 Nov 2020
HAL is a multi-disciplinary open access
archive for the deposit and dissemination of
sci-entific research documents, whether they are
pub-lished or not. The documents may come from
teaching and research institutions in France or
abroad, or from public or private research centers.
L’archive ouverte pluridisciplinaire HAL, est
destinée au dépôt et à la diffusion de documents
scientifiques de niveau recherche, publiés ou non,
émanant des établissements d’enseignement et de
recherche français ou étrangers, des laboratoires
publics ou privés.
low-temperature CO oxidation
G. Ferre, M. Aouine, F. Bosselet, L. Burel, C. Geantet, S. Ntais, F. Maurer,
M. Casapu, J. Grunwaldt, T. Epicier, et al.
To cite this version:
G. Ferre, M. Aouine, F. Bosselet, L. Burel, C. Geantet, et al.. Exploiting the dynamic properties
of Pt on ceria for low-temperature CO oxidation. Catalysis Science & Technology, Royal Society of
Chemistry, 2020, 10 (12), pp.3904-3917. �10.1039/d0cy00732c�. �hal-02903028�
Exploiting the dynamic properties of Pt on ceria for
low-temperature CO oxidation
Journal: Catalysis Science & Technology Manuscript ID CY-ART-04-2020-000732.R1
Article Type: Paper Date Submitted by the
Author: n/a
Complete List of Authors: Ferré, G.; IRCELYON
Aouine, Mimoun; IRCELYON, UMR 5256 Bosselet, Françoise; IRCELYON
Burel, Laurence; IRCELYON
Cadete Santos Aires, Francisco José; IRCELYON Geantet, Christophe; IRCELYON,
Ntais, Spyridon; IRCELYON
Maurer, F.; Karlsruhe Institute of Technology North Campus, Institute of Catalysis Research and Technology
Casapu, Maria; Karlsruhe Institute of Technology North Campus, Institute of Catalysis Research and Technology
Grunwaldt, Jan-Dierk; Karlsruhe Institute of Technology, Campus North, Institute of Catalysis Research and Technology
EPICIER, Thierry; INSA-Lyon, Matériaux, Ingénierie et Sciences (MATEIS)
Loridant, Stéphane; IRCELYON Vernoux, Philippe; IRCELYON
Note: The following files were submitted by the author for peer review, but cannot be converted to PDF. You must view these files (e.g. movies) online.
Journal Name
ARTICLE
Received 00th January 20xx, Accepted 00th January 20xx DOI: 10.1039/x0xx00000x
Exploiting the dynamic properties of Pt on ceria for low-
temperature CO oxidation
†G. Ferré
a, M. Aouine
a, F. Bosselet
a, L. Burel
a, F.J. Cadete Santos Aires
a, C. Geantet
a, S. Ntais
a, F.
Maurer
b, M. Casapu
b, J.-D. Grunwaldt
b, T. Epicier
c, S. Loridant
a, P. Vernoux
a,This study explores the dynamic properties of Pt/CeO2 catalysts to develop active catalytic converters for Diesel exhausts. It
is now well established that single Pt atoms can be stabilised on ceria surface defects in oxidising conditions. However, their catalytic activity is rather poor. A reducing treatment is required to build more active Pt nanoparticles. A Pt/CeO2 catalyst,
containing mainly atomically dispersed Pt species, was exposed to reduction steps either at 250 or 500 °C to build Pt nanoparticles. Their redispersion after oxidising treatments in oxygen at three temperatures (room temperature, 250 °C and 500 °C) as well as in a simulated Diesel exhaust gas, was deeply investigated by different characterisation techniques such as High Angle Annular Dark Field Scanning Transmission Electron microscopy, in situ Raman spectroscopy, in situ X-Ray Diffraction, X-Ray Photoelectron Spectroscopy and H2-Temperature-Programmed Reduction. The arrangement of closed
packed Pt clusters is a permanent event at low temperatures (< 200 °C) between two pseudo-stable states of Pt on ceria: 3D hemispherical NPs in reducing conditions and isolated cations in oxidising conditions at high temperature. We have identified an intermediate 2D monolayer arrangement that coincided with low-temperature CO oxidation (TOF ≈ 4-6 10-2 s-1
at 100 °C in a simulated exhaust gas containing water, NO and propene). These Pt rafts combine 100% Pt dispersion with specific electronic properties and highly reactive interfacial oxygen species.
1. Introduction
The tailoring of Diesel oxidation catalysts (DOC) is crucial to clean-up diesel exhausts. Improvements in the efficiency of the combustion process and low energy losses in the engine lead to low temperatures in the exhaust line. The challenge to comply with the incoming severe legislations regarding pollution is to develop active catalytic converters in urban mode, typically at temperatures from 150 °C, including cold-start phases. In addition, DOCs have to be thermally resistant and prevent agglomeration of active sites that could occur during the regeneration phases of the diesel particulate filter at temperatures above 800 °C.Platinum group metal (PGM) based catalysts are the most effective for oxidizing CO, NO and unburned hydrocarbons. Their activity depends on the size and the chemical state of Pt, as well as on the interaction with the carrier material.1,2
When supported on ceria, Pt can be dispersed as single atoms or nanometric clusters containing a fraction of oxidised atoms.3,4,5 The
pioneering study of Nagai et al. revealed the outstanding sintering resistance of Pt in lean Diesel exhausts, through the formation of rigid Pt-O-Ce bonds.6 The latter not only provides a high Pt dispersion
but also strongly improves the ceria thermal stability in oxidising conditions. It is now well established that Pt atoms can be trapped and then stabilised on ceria surface defects during a high temperature oxidising treatment at typically 800 °C.5,7 The study of
Dvorak et al. has confirmed that step edges on the ceria (111) surface could provide stable sites for Pt2+ cations.8 According to density
functional theory (DFT) calculations, Pt2+ cations could be stabilized
in lean environment up to around 500 °C in surface nanopockets
composed of four surface O atoms of the (100) plane of ceria.9
Calculations also predict that these Pt2+ anchored cations do not tend
to diffuse into the bulk ceria except at high temperatures when the bulk oxygen ionic mobility of ceria becomes fast10 or in reducing
conditions that promote oxygen vacancy formation11.
Although Pt can be optimally dispersed on ceria, the catalytic activity of Pt single atoms compared to that of 3D nanoparticles (NPs) is still under debate in the literature. Most of the studies deal with CO oxidation, as a model reaction, where ceria is playing a major role.12 The electronic properties of Pt in small nanoparticles can be
modified by ceria through electron transfer9,13 and oxygen reverse
spillover13 from Pt to ceria. Cargnello et al. demonstrated the
preponderant role of the ceria-metal interface length in the CO catalytic oxidation mechanism of group VIII metals.14 Higher turnover
frequency (TOF) values whatever the CO/O2 ratios, were achieved for
the smallest 3D Pt NPs (diameter between 1 and 2 nm), showing that corner and perimeter Pt atoms in direct contact with ceria are the most active sites. This suggests that the rate-determining step should be the reaction of adsorbed CO with oxygen species at the Pt−O−CeO2 interface. Using diffuse reflectance infrared Fourier
transform spectroscopy (DRIFTS), Ding et al. found that CO chemisorbed on ionic Pt species supported on ZSM-5 is not reactive at low temperatures whereas CO on metallic Pt can more easily react with oxygen.15 This poor catalytic activity of Pt single atoms for
low-temperature CO oxidation compared to a 1 wt.% Pt/Al2O3 material
containing Pt nanoparticles is now commonly accepted and confirmed by many studies.5,16,17,18 The reducibility of ceria and its
ability to provide reactive oxygen species play a major role. Kopelent
et al. pointed out that the initial rate of interfacial Ce3+ formation is
crucial in CO oxidation kinetics.19 Different preparation methods
have been recently proposed to improve the reducibility of ceria.16,20
A high-temperature steam treatment at 750 °C of the Pt/CeO2
catalyst was found to promote the catalytic activity of dispersed Pt2+
ions on ceria by creating active surface lattice oxygen species on ceria stable up to 767 °C.20 The latter species could originate from the H2O
chemisorption on surface oxygen vacancies, and their concentration
a.Univ. Lyon, Université Claude Bernard Lyon 1, CNRS - UMR 5256, IRCELYON, 2
avenue A. Einstein, 69626 Villeurbanne, France.
b.Institute for Chemical Technology and Polymer Chemistry (ITCP), Karlsruhe Institute
of Technology (KIT), 76131 Karlsruhe, Germany.
c.Univ. Lyon, INSA de Lyon, MATEIS, UMR 5510, 7 av. Jean Capelle, 69621
Villeurbanne, France.
†Electronic Supplementary Information (ESI) available: Figures S1-S13, Table S1. See DOI: 10.1039/x0xx00000x
ARTICLE
Journal Name
2 | J. Name., 2012, 00, 1-3 This journal is © The Royal Society of Chemistry 20xx increases during high-temperature water treatment.21 This
activation effect of a high temperature steam treatment was observed in a simulated diesel exhaust for CO oxidation but also to a lesser extent for the oxidation of propene and NO. Furthermore, above 23 °C, the decomposition of hydroxyl groups on ceria occurs with a concomitant reverse spillover of hydrogen from ceria to Pt clusters.22 Pt/CeO2 catalysts have also been synthesised via the
calcination of the adsorbed Pt precursor at 800 °C in air to generate strong covalent Pt-O-Ce bonds, resulting in a stronger interaction between the support and the metal and then a high activity for low-temperature CO oxidation.16
During the catalytic reaction, temperature variations or changes in the gas atmosphere significantly affect the initial nanostructures of the Pt/CeO2 catalyst. These dynamic properties under redox
conditions, as encountered in the exhaust of Diesel engines, can be exploited to improve the catalytic activity. The Pt redispersion rate in oxidising conditions was found to increase with the temperature and the oxygen partial pressure but decrease with the size of Pt NPs, as large Pt NPs are more difficult to be oxidised.4 Under reducing
conditions, Pt-O-Ce bonds are expected to break to form metal Pt atoms that can rebuild Pt NPs, highlighting the reversibility of the process during redox sequences. We have recently expanded this concept of dynamic properties of Pt/CeO2 to enhance the catalytic
activity for CO oxidation.17 We found that the redispersion of Pt in an
oxidising atmosphere can already occur at 400 °C in oxygen. In addition, starting from highly dispersed or single-atom Pt/CeO2
catalyst, appropriate short rich pulses operated at moderate temperatures (250 – 300 °C) can tune the Pt particle size as well as its interaction with the support to reach the optimum activity for CO oxidation. Interestingly, this kind of activation protocol can be performed in real-world Diesel exhausts as it is close to the working conditions of NOx storage-reduction catalysts.23,24
This study aims to get new insights into the dynamic responses of a Pt/CeO2 catalyst when it is exposed to a redox treatment, i.e. a
reducing step (Pt NP construction) followed by a re-oxidation phase (Pt NPs redispersion). A Pt/CeO2 catalyst containing single-atom Pt
was prepared and systematically exposed to model redox sequences in H2/O2 at mild temperatures. The catalyst was reduced at either
250 °C or 500 °C to get different kinetics of the dynamic Pt NPs construction. The impact of the subsequent re-oxidation step on the tailoring of active Pt clusters was also explored at three different temperatures (RT, 250 °C, 500 °C) to modulate the redispersion rate. Combined characterisation techniques were implemented such as ADF STEM microscopy, in situ Raman spectroscopy, in situ x-ray diffraction (XRD), x-ray photoelectron spectroscopy (XPS) and H2
-temperature programmed reduction to thoroughly characterise the catalyst after redox sequences, in connection with its catalytic activity not only for CO oxidation but also for NO and propene oxidation in a simulated lean exhaust gas mixture containing water.
2. Experimental
2.1. Catalysts preparation and characterisation
Commercial ceria, provided by Solvay Special Chem Company, was dry impregnated with Pt. The Pt precursor (tetraammineplatinum (II) nitrate, Sigma-Aldrich, 99.995% purity) was dissolved in a volume of water corresponding to the porous volume of the ceria support. This
solution was added dropwise to the ceria support under stirring. The resulting powder was exposed overnight in ambient air at room temperature, crushed, dried at 100 °C for 12 hours and calcined for 4 h at 500 °C in a gas flow-through reactor (10 L.h-1 of synthetic air).
A catalyst batch was prepared from 10 g of ceria to achieve a theoretical Pt loading of 0.9 wt%. The actual Pt loading, determined by inductively coupled plasma-emission spectroscopy (ICP-OES, Varian) was 0.88 wt%. Values of the specific surface area (SSA) and the pore volume of the Pt/CeO2 catalyst, measured according to the
BET and BJH methods, (Micromeritics Tristar), were 125 m²·g-1 and
0.28 cm3·g-1, respectively. The sample was degassed 2 h at 300 °C
under vacuum before measurements.
To go further into the dynamic properties of the Pt/CeO2, the
catalyst was exposed to various model redox sequences composed of a first reduction step for 1 h in 10% H2/He (10 L.h-1, weight hour
space velocity (WHSV) of 750 L·g-1 of catalyst per hour) followed by a
purge in pure He for 10 min and ended with a re-oxidation for 1 h in 20% O2/He (10 L.h-1). These model redox sequences were performed
at different temperatures: 500 °C/500 °C (reduction/ oxidation), 250 °C/250 °C and 250 °C/RT, denoted as Red500/Ox500, Red250/Ox250,
Red250/OxRT, respectively. Regarding Red250/OxRT for which the
temperature of the reduction step (250 °C) is different from that of the oxidation conditioning (room temperature), the catalyst was cooled-down in H2 to room temperature, purged in He for 10 min and
then exposed to oxygen for 1 h.
Temperature programmed reduction (TPR) experiments were conducted with an Inficon JPC400 mass spectrometer. Samples (ca. 300 mg) were loaded into a U-shaped reactor and heated from room temperature to 500 °C (10 °C.min-1) for 2 h in 20% O2 in He to achieve
the reference state and cooled down to room temperature still in 20% O2. Then, consecutive TPR and TPO (Temperature-Programmed
Oxidation) experiments were performed to reproduce the model redox sequences. TPR and TPO were recorded during heating ramps (10 °C/min) in 1% H2/He and 1% O2/He. The maximum temperatures
(250 °C and 500 °C, respectively) were maintained for 1 h in 10% H2/He after a TPR or in 20% O2/He after a TPO. To mimic Red250/OxRT,
the TPR was performed up to 250 °C following by a 1 h plateau in 10% H2/He, then cooled down in the same atmosphere to room
temperature and re-oxidised for 1 h in 20% O2/He. These TPR/TPO
sequences were cycled three times. H2 uptake during TPR was
measured by following the m/z = 2 signal. The H2 consumption at RT
was systematically measured by quantifying the consumption during two successive introductions of H2 (1% in He) on the catalyst with a
10 min purge under He in between. The difference in the two H2
profiles gave the H2 consumption due to the reduction of the sample
at RT.
Ex situ scanning transmission electron microscopy (STEM)
investigations were performed with an Environmental Transmission Electron Microscope (ETEM, FEI TITAN ETEM G2 80-300 kV). For this purpose, the samples were suspended in ethanol and transferred onto a carbon-covered Cu-grid. High-Angle Annular Dark Field-STEM (HAADF-STEM) images were acquired at 300 kV under ultra-high vacuum to assess the size and shape of Pt after the different redox sequences. After performing each redox sequence, the catalyst was
Journal Name
ARTICLE
This journal is © The Royal Society of Chemistry 20xx J. Name., 2013, 00, 1-3 | 3
rapidly cooled down to RT in 20% O2 and then viewed in the
microscope.
MicroRaman spectra we recorded with a LabRAM HR spectrometer (Horiba) using the exciting line at 514.53 nm of an Ar+
ion laser, 50 x magnification objective and CCD open electrode detector cooled down to -75 °C. Depending on the experiment, a diffraction grating of 300 or 1800 lines per mm was used leading to the spectral resolutions of 4 and 0.5 cm-1, respectively. The laser
power at the samples was as low as 100 µW. It had been previously checked that the laser heating was negligible using such a power. In
situ studies were performed in a THMS600 cell coupled with a TMS94
programmer (Linkam). The temperature gradient between the heating sole and the upper part of the powder sample had been previously determined and corrected. Pt/CeO2 samples were
pre-treated for 1 h under 20% O2/N2 at 500 °C, then reduced under 10%
H2/He at 250 or 500 °C and oxidised under 20% O2/N2 at RT, 250 or
500 °C. The spectra were recorded at RT under 10% H2/He after a
reducing treatment and 100% N2 after an oxidation step. They were
normalised using the F2g main band of CeO2.25
XPS spectra were acquired using a Kratos Axis Ultra DLD spectrometer equipped with a magnetic immersion lens, a hemispherical analyser and a delay line detector. The base pressure in the analysis chamber was lower than 5 × 10⁻⁸ Pa. The spectrometer
was equipped with a pre-treatment cell consisting of an oven and a gas inlet system allowing reducing and oxidising treatments without air exposure. The gases used were 20% O2/N2 (40 mL·min-1, 1 bar)
and 10% H2/N2 (40 mL·min-1, 1 bar). Spectra of the Pt 4f, Ce 3d and O
1s core levels of a fresh or treated Pt/CeO2 samples were recorded
using the Al Kα X-ray radiation (1486.6 eV) with a pass-energy of 40 eV and spot size aperture of 300×700 mm. A fresh sample was loaded for all treatments which were similar to those applied for Raman experiments.
In situ X-ray diffractograms were carried out using a Panalytical
X'Pert Pro MPD diffractometer equipped with a Cu anode (Cu Kα radiation: 0.154184 nm), a diffracted beam graphite monochromator and 1D fast multistrip detector (X’Celerator, 127 channels on 2.1°), using the Bragg-Brentano flat plate geometry. The samples were mounted in an atmosphere-controlled Anton Paar XRK 900 reactor chamber. The temperature-regulated glass-ceramic sample holder was open to allow gas flowing through the sample. X-ray diffractograms were recorded in pure H2 (20 mL·min-1) and in 20 %
O2/N2 (25 mL·min-1) between RT and 750 °C (113 min by scan, 0.033°
2θ steps). The diffractograms have been refined by the Rietveld method (FullProf) with a Thompson Cox Hastings function (modified pseudo-Voigt) and an instrumental resolution function specific to each device. The Fm-3m cubic phase was considered for all the samples. The refined parameters were the background, the z shift of the sample, the scale factor, the Debye-Waller factor, the unit cell parameter, the size (Y) and strains of crystallites (U).
2.2. Catalytic performance measurements
To measure the catalytic performances, 13 ± 0.5 mg of Pt/CeO2
catalyst were diluted with 137 ± 5 mg of sieved (100-200 µm) SiC
powder to minimise any exothermic effects due to oxidation reactions. This SiC/catalyst mixture was introduced in a U-shaped quartz reactor to achieve a catalyst bed of 2 mm (10 mm diameter). Small deviations of the catalyst mass (± 5%) in the catalyst-SiC mixture were observed through various tests, giving rise to a slight variation (± 5%) of the absolute amount of Pt inside the reactor. The overall gas flow was 10 NL·h-1 corresponding to a gas hour space
velocity of around 96 000 h-1 and a WHSV of 750 L·g-1 of catalyst per
hour. Gases were mixed by using mass-flow controllers (Brooks) to generate a model lean Diesel exhaust gas mixture composed of 10% O2, 1000 ppm CO, 500 ppm NO, 500 ppm C3H6, 10% H2O and N2. H2O
vapor was introduced using an atmospheric pressure Pyrex saturator heated at 46 °C. Reactants and products were analysed using a gas micro-chromatograph (SRA 3000 equipped with two TCD detectors, a molecular sieve and a Porapak Q column for O2, CO, C3H6 and CO2
analysis) and IR and UV online analysers (EMERSON NGA2000 for CO, CO2, NO, NO2 and N2O detection). Reactants were Linde certified
standards of NO in He (1990 ppm), C3H6 in He (8005 ppm), CO in He
(2000 ppm) and O2 (99.999%) that could be further diluted in
(99.999%) He. A small part of NO is oxidised to NO2 (around 50 ppm)
in the pipe before the introduction into the reactor. The conversion of CO, C3H6 and the NO2 yield was calculated as follows:
(1) %𝐶𝑂𝑐𝑜𝑛𝑣𝑒𝑟𝑠𝑖𝑜𝑛 =(𝐶𝑂 𝑖𝑛― 𝐶𝑂 𝑜𝑢𝑡) 𝐶𝑂 𝑖𝑛× 100 (2) %C3H6conversion = (C3H6 in― C3H6 out) C3H6 in× 100 (3) %NO2yield = (NO2 out― NO2 in) (NOin+ NO2 in) × 100
The carbon and nitrogen balance closure was found to be within 2%. No production of N2O was detected during these experiments.
A fresh catalyst was systematically used for each characterisation and catalytic test, to avoid any structural differences. Nevertheless, as samples were exposed to ambient air after their preparation, they were methodically pre-treated in 20% O2 in He for 1 h at 500 °C
before all measurements to achieve a reference state including a carbonate-free oxidised ceria surface. After this plateau, the sample was cooled down to the targeted temperature in 20% O2 in He. The
catalytic performances were evaluated during successive light-offs under the lean mixture from 60 °C up to 500 °C with a heating ramp of 2 °C.min-1. We refer to the first light-off performed after the initial
conditioning as the “ LOref ” since it corresponds to the reference state of the catalyst. At the end of the LOref, the catalyst was exposed to a model redox sequence. The catalyst was maintained at 500 °C for the Red500/Ox500 sequence or cooled down in the lean
mixture to 250 °C to be exposed to Red250/Ox250 or Red250/OxRT. The
second light-off, performed after the model redox sequence, was denoted as “LO2”. At the end of the LO2, the catalyst was exposed to the same redox sequence followed by a third light-off, designated as “LO3”. For comparison, we also explored the impact of rich pulses at 250 °C. At the end of the LOref, the catalyst was cooled down in the lean mixture to 250 °C and then was exposed to alternative redox conditions referred as pulse cycling and consisting of short pulses composed of 30 s in a rich atmosphere (2% CO/He, 10 NL·h-1) and 90
ARTICLE
Journal Name
4 | J. Name., 2012, 00, 1-3 This journal is © The Royal Society of Chemistry 20xx
3. Results and Discussion
3.1. Characterisation after the initial pre-treatment
The Pt/CeO2 catalyst was first characterised in its reference state, i.e.
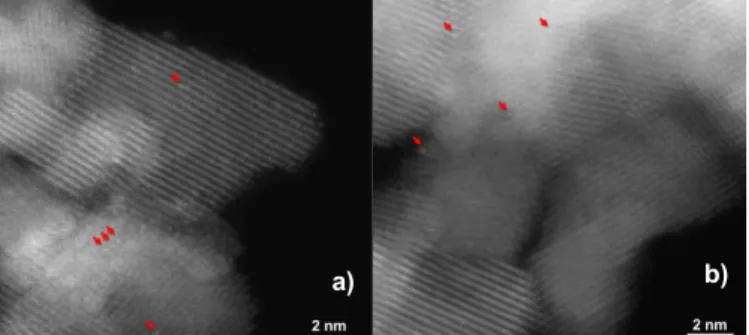
after an oxidation step for 1 h in 20% O2 at 500 °C. STEM-ADF
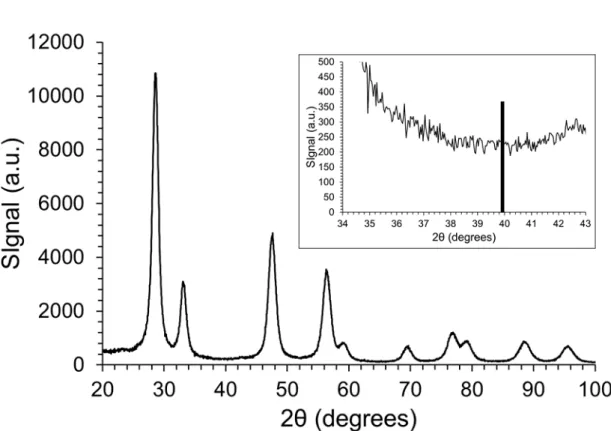
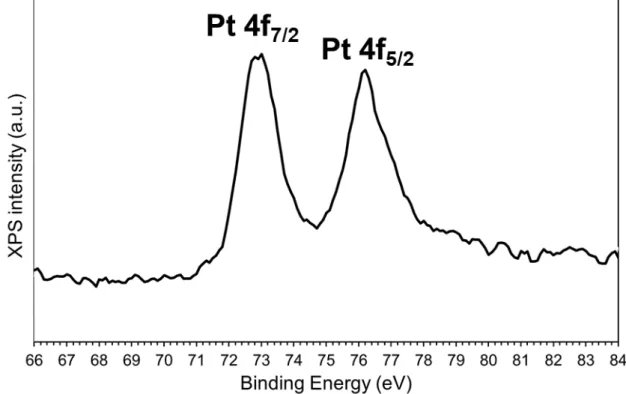
observations did not evidence any Pt NPs but only atomically dispersed Pt on ceria (Figure 1). No reflection related to Pt was detected in the X-ray diffractograms (Figure S1), underlying the small size of the Pt-entities. In addition, the XPS measurements indicated that the Pt 4f7/2 binding energy was 72.9 eV (Figure S2), meaning that
the oxidation state of Pt is between Pt2+ and Pt4+, mostly Pt2+, without
any presence of the metallic state, in agreement with the literature.26
A fitting of the Pt-4f XPS spectrum roughly estimated 79% of Pt2+ and
21% of Pt4+. All these results emphasise that Pt is predominantly
atomically dispersed on ceria. By using a similar high specific area ceria support (200 m².g-1) and a similar preparation method and
calcination step at 500 °C, Lin et al. also achieved a high dispersion of Pt.3
b) a)
Fig. 1 STEM images of Pt/CeO2 at the reference state. The arrows indicate atomically dispersed Pt.
3.2. Impact of the redox sequences on the catalytic performances
The catalytic activity of Pt/CeO2 was investigated for CO, C3H6 and
NO oxidation. As shown in Figures 2-4, LOref curves of CO and C3H6
oxidation are similar with an onset temperature of around 250 °C, indicating a poor activity as reported in previous studies on single-atom Pt/CeO2 catalysts.5,16,18,27 The catalytic performance for NO
oxidation was even worse (Figure S3). Larger Pt particles exhibiting reduced terrace Pt atoms are reported to be the most active sites for NO oxidation.28 We estimated the apparent activation energy (Ea =
89 ± 2 kJ/mol) of the CO oxidation from an Arrhenius plot to be between 250 °C and 350 °C (below 20% of conversion). This value is in the same range as those reported in the literature on Pt/ceria catalysts containing single atoms.5,27 These results confirm that our
catalyst mainly contains Pt single atoms after the initial oxidising state at 500 °C. We have performed two successive LOref up to 500 °C to investigate whether the catalytic activity did improve on stream in the presence of the lean mixture. Figure S4 shows that the two successive light-off curves for CO, C3H6 and NO oxidation are similar
demonstrating that this poorly active reference state is stable in the lean mixture up to 500 °C. This confirms that Pt single atoms on ceria are thermally stable up to 500 °C in oxidising atmosphere.9 The
impact of water on the catalytic performances was also investigated during an additional LOref without water in the lean mixture (Figure S5). A better catalytic activity was observed for the three reactions in
dry conditions, indicating that H2O inhibits CO, C3H6 and NO oxidation
on atomically dispersed Pt.
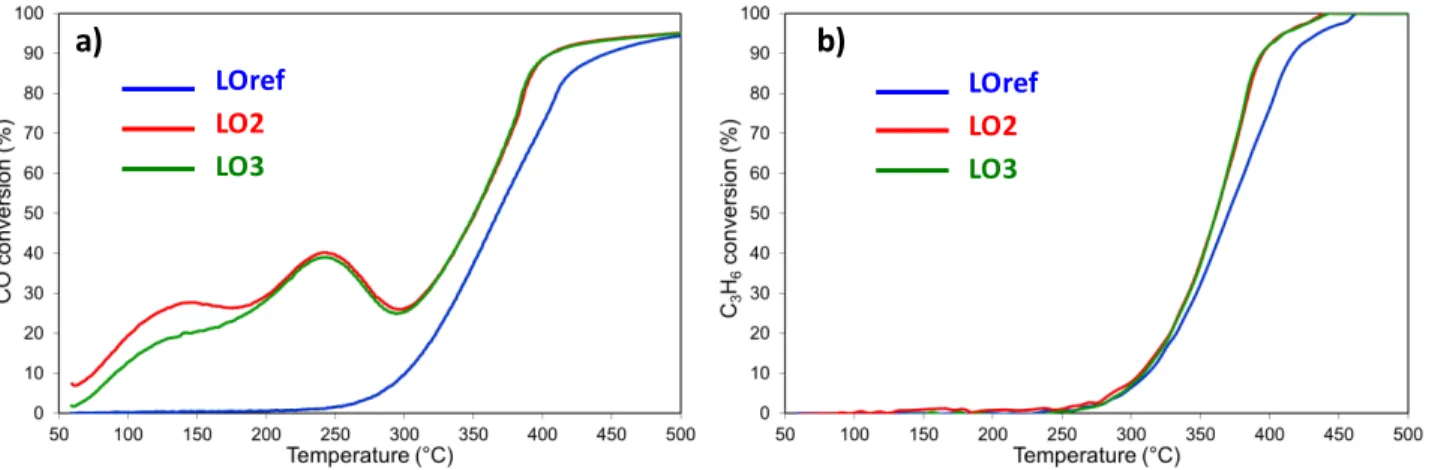
A Red500/Ox500 sequence strongly improves the catalytic
performances for CO oxidation (Figure 2a, Table 1) over the entire temperature range. The light-off temperature for CO oxidation was decreased by more than 100 °C, with the onset at 140 °C. The apparent activation energy decreases to reach 67 ± 3 kJ/mole (Table 2). Furthermore, the shape of the CO light-off curve was also modified, showing a two-step behaviour with a temporary decrease of CO conversion between 270 and 295 °C. This temperature range corresponds to the ignition branch of the propene oxidation. Similar deactivation effects have been described in the literature on Pt/γ-Al2O3.29 These effects were mainly attributed to the poisoning of the
catalytic active sites by intermediates of propene partial oxidation. This deactivation is more pronounced for low heating ramps, as employed in this study, as more intermediates can be accumulated on the surface. Note that this propene inhibiting effect on the CO oxidation was not observed for the reference state of the catalyst (Figure 2a) in agreement with the inactivity for propene oxidation at low temperatures. The Red500/Ox500 sequence had a limited impact
on propene oxidation as shown in Figure 2b and quantified in Table 1. The temperature at 20% of propene conversion (T20) decreased by
31 °C, instead of 119 °C for CO oxidation (Table 1). A second Red500/Ox500 sequence did not further improve the performance for
CO and C3H6 oxidation. On the contrary, slightly lower performances
were observed compared to LO2. Regarding the NO oxidation, there was no significant impact of the redox sequence (Fig S3a).
Table 1: Light-off performance comparison.
CO conversion T20 (°C)
Redox sequence
LOref LO2 LO3 ΔTCOa
Red500/Ox500 321 202 210 119 Red250/Ox250 311 198 184 113 Red250/OxRT 322 103 140 219 Pulse cyclingc 312 211 312 101 C3H6 conversion T20 (°C)
LOref LO2 LO3 ΔTHCb
Red500/Ox500 333 302 319 31
Red250/Ox250 332 332 332 0
Red250/OxRT 333 328 328 5
Pulse cyclingc 332 267 335 65
aΔTCO = T20 (LOref) – T20 (LO2), bΔTHC = T20 (LOref) – T20 (LO2), c250°C.
A milder reduction temperature, that was supposed to generate smaller Pt NPs, as used during the Red250/Ox250 sequence, only
affected the catalytic activity for CO oxidation (Figure 3). We did not observe any effects on C3H6 and NO oxidation. The CO oxidation LO2
and LO3 curves clearly shifted toward lower temperatures in comparison with LOref, starting at 80 °C. Furthermore, the apparent activation energy dropped, clearly indicating different catalytic active sites (Table 2). Similarly, as after the Red500/Ox500 sequence,
Journal Name
ARTICLE
This journal is © The Royal Society of Chemistry 20xx J. Name., 2013, 00, 1-3 | 5
decrease of CO conversion between 250 and 300 °C, coinciding with the ignition of the propene oxidation. Above 330 °C, the three successive light offs are superimposed, meaning that the Red250/Ox250 sequence only affected the low-temperature CO
oxidation and/or one type of active sites. A successive Red250/Ox250
sequence restores and even improves the CO conversion, reaching 41% at 250 °C.
Fig. 2 Impact of the Red500/Ox500 sequence on the catalytic performances of Pt/CeO2: a) CO oxidation and b) propylene oxidation. Lean
mixture: [C3H6] = 500 ppm, [CO] = 1000 ppm, [NO] = 500 ppm, [O2] = 10% and [H2O] = 10%.
a)
b)
LOref
LO2
LO3
LOref
LO2
LO3
Fig. 3 Impact of the Red250/Ox250 sequence on the catalytic performances of Pt/CeO2:a) CO oxidation and b) propylene oxidation. Lean
mixture: [C3H6] = 500 ppm, [CO] = 1000 ppm, [NO] = 500 ppm, [O2] = 10% and [H2O] = 10%.
a)
b)
LOref
LO2
LO3
LOref
LO2
LO3
Fig. 4 Impact of the Red250/OxRT sequence on the catalytic performances of Pt/CeO2. Lean mixture: [C3H6] = 500 ppm, [CO] = 1000 ppm, [NO]
= 500 ppm, [O2] = 10% and [H2O] = 10%.
a)
b)
LOref
LO2
LO3
LOref
LO2
LO3
ARTICLE
Journal Name
6 | J. Name., 2012, 00, 1-3 This journal is © The Royal Society of Chemistry 20xx
Table 2: Apparent activation energy of CO oxidation.
Redox sequence CO oxidation Ea / kJ·mole-1
LOref LO2 LO3
Red500/Ox500 89 ± 5 67 ± 3 72 ± 3
Red250/Ox250 87 ± 5 40 ± 2 34 ± 2
Red250/OxRT 90 ± 5 30 ± 2 30 ± 2
A third Red250/OxRT sequence was implemented with a similar
reduction step but a rather soft oxidation phase at room temperature (Figure 4). This low temperature of re-oxidation was conducted to avoid Pt redispersion. We observed an outstanding effect on the low-temperature CO oxidation while NO and C3H6
conversions were hardly affected. The CO was oxidised once reactants are introduced at 60 °C. This low-temperature CO oxidation is associated with an extremely low apparent activation energy (Table 2). The LO2 and LO3 curves display the first maximum at around 140 °C, which had not been observed previously for the other redox sequences. This low-temperature maximum CO conversion cannot be explained by propene intermediates poisoning since propene oxidation only starts from 250 °C. Furthermore, the CO2
production profiles fit with the CO consumption, with a C balance of less than 2% (Figure S6). A second Red250/OxRT had a reproducible
effect on the low-temperature CO oxidation activity as the second and the third light-off curves (LO2 and LO3) are similar.
The impact of the different redox sequences was compared according to two parameters, referring to the T20 balance (ΔT20(CO)
and ΔT20(HC)) between LOref and LO2 (Table 1). We also reported
the effect of a lean/rich pulse cycling at 250 °C (Figure S7 and Table 1). Regarding CO oxidation, the most pronounced effect was clearly achieved after the Red250/OxRT sequence with a remarkable value of
ΔTCO of 219 °C. On the other hand, pulse cycling at 250 °C constituted
the most appropriate conditioning to promote the propene oxidation followed by the high-temperature reduction (Red500/Ox500)
sequence. The pulse cycling sequence was performed
with CO (2% in He) in the rich steps which was shown to be a much more efficient reducing agent than H2 to structure Pt NPs.17
Nevertheless, neither the model redox sequences nor the pulse cycling promotes NO oxidation (Figure S7).
3.3. Characterisations of Pt/CeO2 after the redox sequences
3.3.1. Ex situ ADF STEM observations
We examined the Pt clusters size and morphology after the different redox sequences. Figure S8 displays STEM images of the Pt/CeO2
catalyst just after a reduction step either at 250 °C (Figure S8a) or 500 °C (Figure S8b). The reduction protocol was the same as the one used during redox sequences and the catalyst was cooled down to room temperature in H2 (10% in He) to avoid any re-dispersion. As
expected, a reduction step can cleave the Pt-O-Ce bonds and construct hemispherical Pt particles on ceria.4,17 Single Pt atoms
could not be detected anymore neither after reduction at 500 °C nor at 250 °C, suggesting that no Pt re-dispersion can take place during the air exposure of the catalyst at RT before the transfer in the microscope. We estimated the Pt NPs size distribution and found that the mean surface diameter of the Pt NPs was around 0.83 ± 0.23 nm and 1.46 ± 0.33 nm after a reduction step at 250°C and 500°C
(Figure S9), respectively. This confirms that the construction of hemispherical Pt NPs in H2-rich condition was more favoured at 500
°C than at 250 °C. These results also show that subnanometric Pt NPs can be formed after a mild-reduction step at 250 °C and that these Pt NPs are stable upon air exposure at room temperature as seen before in STEM observations.
After a Red500/Ox500 sequence, isolated Pt atoms can again be
observed on ceria (Figure 5b), demonstrating that the redispersion of Pt NPs took place during the oxidation for 1 h at 500 °C. Nevertheless, in good agreement with our previous study17, some 3D
Pt NPs remained on the surface (Figure 5a). Their surface mean diameters, roughly estimated due to their limited number, were similar to that observed after the reduction step at 500 °C (around 1.5 nm). After a Red250/Ox250 sequence (Figure 6), numerous
hemispherical Pt NPs (large arrows) could be observed on ceria. This indicates that most of them were not dispersed during the re-oxidation step at 250 °C. We also observed less bright, and thus thinner Pt clusters, after this Red250/Ox250 sequence (Figure 6b, c and
d). The mobility of Pt atoms in such Pt clusters was recorded at RT, but in the conventional TEM imaging mode at high resolution, allowing much faster image acquisitions than the STEM imaging (Figure S10 and video S1). One can observe the motion of four Pt atomic layers under the electron beam. This indicates that these thin clusters, as observed in figures 6b, c and d are composed of a few Pt atomic layers. It should be noted that the significant mobility of Pt atoms during the acquisition of STEM images explains why the atomic structure of these clusters could not easily be resolved in ADF STEM images.
Fig. 5 Representative ADF-STEM images of Pt/CeO2 after a Red500/Ox500 sequence. a): typical area showing 3D hemispherical Pt
nanoparticles (large arrows); the inset shows a larger magnification of the framed region where smaller objects and possible single atoms (small arrows) are visible. b): other areas where Pt single atoms are clearly resolved.
As mentioned previously, air exposure at RT after reduction at 250 °C before STEM observations does not lead to the redispersion of Pt NPs into single atoms. We assumed that it is also valid for the lean mixture. To highlight the low-temperature CO oxidation activity (Figure 4), a light-off in the lean mixture was performed after the Red250/OxRT sequence. The reaction was stopped at 140 °C, the
Journal Name
ARTICLE
This journal is © The Royal Society of Chemistry 20xx J. Name., 2013, 00, 1-3 | 7
temperature of the first maximum of CO conversion, and the catalyst was rapidly cooled down in the lean mixture and observed in the ETEM. This redox sequence was called Red250Ox140 as the sample was
exposed to the lean mixture up to 140 °C. As expected, we noticed the presence of sub-nanometric Pt NPs (Figure 7a) that were formed during the reduction step at 250 °C. However, a lot of thin Pt clusters were observed and some were clearly composed of a Pt monolayer (Figure 7b and c) and thus could be considered Pt rafts. These results demonstrate that a mild reduction step at 250 °C in H2 following by a
soft re-oxidation phase first at RT and then during a LO in a lean mixture up to 140 °C can form Pt monolayer clusters on ceria. We strongly believe that these single layer rafts were built during the light-off in the lean mixture as no raft was observed on the catalyst reduced at 250 °C even through it had been exposed to air at RT before microscopic observations (Figure S8). These rafts could be an intermediate step of the 3D NPs redispersion before reaching the fully redispersed state of isolated atoms. The formation of these Pt rafts could coincide with the CO oxidation onset that is taking place on the catalyst below 140 °C (Figure 4).
Fig. 6 Representative ADF-STEM images of Pt/CeO2 after a
Red250/Ox250 sequence. Both hemispherical Pt nanoparticles (such as
arrowed in a) and thin Pt clusters (arrowed in b-c-d) are observed.
Fig. 7 Representative ADF-STEM images of Pt/CeO2 after a Red250/Ox140 sequence and a light-off in the lean mixture up to 140
°C. In addition to small NPs (such as arrowed in a), raft-like clusters composed of monoatomic Pt layers are seen in many areas (arrows in b and c).
3.3.2. In situ Raman spectroscopy
In situ Raman measurements were powerful for further
characterizing the structural evolutions of Pt/CeO2 catalyst upon
redox sequences. The sample was exposed to three successive alternative reduction and re-oxidation steps at 250 °C (Figure 8). The Raman spectrum recorded after the pre-treatment under 20% O2 at
500 °C contained an intense band located at 466 cm-1 (Figure 8a),
attributed to the Raman active F2g vibrational mode of CeO2 (space
group Fm-3m). This mode can be considered the symmetrical breathing mode of the oxygen anions around Ce cations.30,31,32 Small
bands were also observed at 264, 403, 562, 667 and 834 cm-1. The
two former ones (Figure 8b) were recently attributed to surface modes of the clean CeO2 (111) surface from DFT calculations.33 The
two bands at 562 and 667 cm-1 (Figure 8c) were assigned to the
bridging Pt-O-Ce and Pt-O vibrations of the so-called PtOx species, respectively.3 These bands can be linked to vibrations involving Pt2+
cations. The latter were detected on the catalyst surface after the initial oxidising pre-treatment by XPS (Figure S2). Note that the D bands around 550-600 cm-1 observed for nanocrystallised CeO2 is
superimposed to the Pt-O-Ce vibrations.31 Finally, the band at 834
cm-1 is typical of v(O-O) vibration of peroxo oxygen species.31,32 The
presence of these peroxo oxygen species on the ceria surface can be associated with oxygen vacancies.
ARTICLE
Journal Name
8 | J. Name., 2012, 00, 1-3 This journal is © The Royal Society of Chemistry 20xx
Fig. 8 a) Normalised Raman spectra of Pt/CeO2 recorded at RT after
the initial oxidising pre-treatment at 500 °C under 20 % O2 flow for 1
h (reference state) and after successive reductions and re-oxidations along the Red250/Ox250 sequences. a) 430-500 cm-1, (b) 100-470 cm-1,
(c) 470-900 cm-1 and (d) 1900-2400 cm-1 spectral ranges. The first
spectral region was obtained with a 1800 lines per millimetre diffraction grating (spectral resolution 0.5 cm-1) and the three others
with a 300 lines per millimetre (spectral resolution 4.0 cm-1).
The F2g main band was redshifted to 461 cm-1 after a reduction at
250°C (Figure 8a). This indicates a weakening of Ce-O bonds strength as a consequence of the formation of Ce3+ cations (Figure 8d) and the
concomitant increase in the unit cell parameter.25 The presence of
Ce3+ cations was confirmed by the appearance of a new feature at
2129 cm-1 which corresponds to electronic Raman scattering
associated with the 2F5/2 => 2F7/2 electronic transition in Ce3+
cations.34,35 In parallel, the bands due to (111) surface modes (Figure
8b) disappeared because of the formation of oxygen vacancies at the surface of the {111} plans. The reduction of the CeO2 surface also led
to the disappearance of peroxo species (Figure 8c). The area of the band at 667 cm-1, characteristic of Pt2+ cations (Figure 8c), strongly
decreased suggesting that most Pt was reduced at 250 °C in H2. A
similar conclusion can be drawn for the Pt-O-Ce vibrations band at 562 cm-1 (Figure 8c), in good agreement with ADF STEM observations
that have evidenced the formation of 3D Pt nanoparticles after the reduction at 250 °C (Figure S8b) leading to the cleavage of Pt-O-Ce bonds. The vanishing of these two bands allows us to distinguish the D bands around 550-600 cm-1 (Figure 8c).
The band at 2129 cm-1 disappeared after the re-oxidation at 250
°C (Figure 8d), evidencing the absence of Ce3+ after a Red250/Ox250
sequence. This feature was in agreement with the recovering of the initial position of the F2g mode (Figure 8a) and the re-appearance of
the two surface modes of clean {111} planes (Figure 8b) suggesting a complete re-oxidation of CeO2 support. Note, however, that the
band at 264 cm-1 was redshifted to 255 cm-1. Furthermore, the band
of peroxo species (Figure 8b) reappeared with a higher intensity. As already mentioned, these peroxo species are probably stabilised on oxygen vacancies. As no Ce3+ cations were detected, one can suggest
that Pt2+ cations could locally induce the formation of oxygen
vacancies on the ceria surface. Bands characteristic of ν(Pt-O-Ce) and ν(Pt-O) reappeared with intermediate intensity (Figure 8c) suggesting a redispersion of single Pt2+ cations leading to formation
of new Pt2+-O-Ce4+ and Pt2+-O bonds and/or the presence of such
bonds at the interface with the CeO2 support. The ex situ STEM
observations after this Red250/Ox250 sequence evidenced the
presence of Pt nanoclusters but did not detect any isolated Pt atoms. Therefore, we assume that Pt2+-O bonds could be stabilised on these
Pt clusters.
Similar evolutions of the Raman spectra were observed along with successive reduction and re-oxidation steps at 250 °C, indicating the reversibility of the involved physico-chemical phenomena. It is worth noting that the close positions of the F2g band during the three
successive reduction steps (Figure 8a) indicate that the reduction rates of CeO2 were rather similar.
Similar experiments were performed after the Red500/Ox500 and
Red250/OxRT sequences. Figure 9 compares the normalised spectra
recorded after three sequences. Whatever the temperature of the re-oxidation step, the electronic Raman scattering of Ce3+ cations
was not observed after re-oxidation (Figure 9c). Furthermore, the relative intensity of peroxo oxygen species was maximal after the Red250/OxRT sequence (Figure 9b), suggesting that the dissociation of
O2- into O- and its reduction to O2- anions were limited at room
temperature. Interestingly, the relative intensities of the ν(Pt2+
-O-Ce4+) and ν(Pt2+-O) bands after the Red500/Ox500 sequence were close
to the ones after the initial oxidising pre-treatment (Figure 9b), indicating an important Pt redispersion as Pt2+ cations, in good
agreement with STEM observations. A re-oxidation at RT or 250 °C (Red250/Ox250 and Red250/OxRT) leads to identical intensities of the
ν(Pt2+-O-Ce4+) and ν(Pt2+-O) bands (Figure 9b), meaning that the Pt
state is similar in both cases with a lower number of isolated Pt atoms than that observed after an oxidation step at 500 °C but with some Pt2+-O bonds at the interface with ceria.
Journal Name
ARTICLE
This journal is © The Royal Society of Chemistry 20xx J. Name., 2013, 00, 1-3 | 9
Fig. 9 Normalised Raman spectra recorded at RT after the initial
oxidising pre-treatment at 500 °C under 20% O2 for 1 h (Reference
state) and after different redox sequences. The spectrum recorded after reduction step at 500 °C for 1 h in H2 (10% H2/He) during the
Red500/Ox500 is provided for comparison: a) 150 – 450 cm-1, b) 470 –
900 cm-1 and c) 1900 – 2400 cm-1 spectral ranges. The spectral
resolution is 4 cm-1.
3.3.3. Reducibility of the Pt/CeO2 interface
The reactivity of surface oxygen species could be estimated according to the reducibility from H2-TPR. The crucial role of the
oxidation degree and size of Pt clusters for the ceria redox properties was also highlighted in our recent study.24 To gain further insights,
we performed successive TPR/TPO experiments to mimic the three redox model sequences. For instance, to mimic Red250/OxRT, a TPR
was performed up to 250 °C followed by a 1 h plateau in 10% H2/He
at 250 °C, cooling down in the same atmosphere to room temperature and finally the sample was re-oxidised for 1 h at RT in 20% O2/He. Whatever the upper temperature limit of the TPR (250
°C or 500 °C), we found that the Pt/CeO2 catalyst can be quickly
re-oxidised at RT after only a few minutes. For instance, Figure S11 shows the variation with time of the O2 consumption at RT required
for the reoxidation of the Pt/CeO2 catalyst which has been previously
reduced at 250 °C. Regarding the TPR, we focused on the reduction peaks below 400 °C related to the reduction of the metal and of the ceria surface in interaction or not with Pt.18,20 Figure 10 shows an
example of three successive TPR experiments performed up to 500 °C with a TPO carried out also up to 500 °C after each TPR, as during the Red500/Ox500 sequence. The first TPR experiment (designated as
TPR1 in Figure 10) was performed to assess the reducibility of the catalyst at its reference state, i.e. after the initial oxidising pre-treatment at 500 °C. The H2 consumption starts above 150 °C. Note
that the overall H2 consumption (Table 3) is at least 10 times larger
than the Pt loading (46 µmol.g-1), confirming that most of the H2
consumption is due to the ceria surface reduction and for a minor part to the reaction of Pt-O-Ce with H2. The TPR1 profile clearly
shows two peaks, a predominant one at around 250 °C linked to the reduction of ceria surface in interaction with Pt and a minor one at about 300 °C corresponding to remote ceria surface indirectly affected through the hydrogen spillover.3 For comparison, in situ XRD
experiments were performed on the same catalyst up to 750 °C in pure H2. The ceria lattice parameter, extracted from these data,
increased up to 200 °C due to the reduction of Ce4+ into Ce3+ (Figure
S12). This confirms that TPR peaks are mainly due to ceria reduction. The second TPR spectrum carried out after a TPO up to 500°C, denoted as TPR2 (Figure 10), is strongly shifted to lower temperatures. This clearly indicates that the formation of 3D Pt NPs during the first TPR up to 500 °C, as shown by STEM-ADF observations (Figures S8a and 5), promotes the reducibility of ceria surrounding Pt NPs. As described recently, a reduced Pt cluster or particle is a prerequisite for low-temperature ceria reduction.24 Our
results are also consistent with the literature data.24,36 These studies
have shown that isolated Pt2+ sites are inactive towards H2
dissociation whereas the presence of small Pt clusters promotes hydrogen dissociation and spillover to the support. According to J. Resasco et al., catalysts in which Pt is reduced at low temperatures (around 200 °C) contain Pt clusters and also isolated Pt species.37 Our
H2-TPR experiments (Fig. 10) displays that, for the Pt/CeO2 catalyst in
its reference state, the H2 consumption starts above 150 °C, with the
main peak centred at 250 °C. This indicates that our catalyst contains some Pt clusters and atomically dispersed Pt species. Nevertheless, the onset temperature of the reduction (150 °C) is higher than those reported in the literature on single-atom Pt/CeO2 catalysts which are
typically around 80 – 100 °C.27,38 The Pt surface concentration in our
catalyst, at its reference state, is lower, probably because of the higher surface specific area of the ceria support we used (125 m².g-1
vs 50-80 m².g-1 in the literature). Our results also confirm the higher
reducibility of PtOX species formed during the first TPO compared to
Pt-O-Ce bonds present in the initial single-atom catalyst.10 The third
TPR (TPR3) shows a further slight improvement of the Pt/CeO2
reducibility, most probably due to the formation of more Pt NPs. Nevertheless, the overall H2 consumption is rather similar for the
three TPR experiments (Table 3), corresponding to a CeO1.9
stoichiometry and suggesting that the concentration of lattice oxygen reacting with H by spillover remains constant. However, the reactivity of these oxygen species is strongly improved by the first redox sequence at 500°C in good agreement with the enhancement of the low temperature CO oxidation activity observed after a Red500Ox500 sequence. Table 3 summarises the overall H2
consumption as well as the consumption at RT for the three TPR/TPO sequences. It is quite interesting to note that, after the first TPR/TPO sequence necessary to form Pt NPs on ceria, the H2 consumption at
RT is much lower after the Red500/Ox500 sequence in comparison to
Red250/Ox250 and Red250/OxRT (Table 2). This result can be correlated
with a higher concentration of Pt particles and clusters on ceria after a low-temperature re-oxidation step at RT or 250 °C as the Pt redispersion process is slower than at 500 °C. It is not possible from these TPR results to differentiate Red250/Ox250 and Red250/OxRT, as
most of the reduction is taking place at room temperature after both treatments. This explains the outstanding reactivity of oxygen species at the interface between Pt and ceria.
Fig. 10 Three successive TPR spectra up to 500 °C recorded on Pt.
1% H2 in He, heating ramp = 10 °C/min.
Table 3: Assessment of the H2 consumption recorded TPR experiments along with the three successive TPR/TPO sequences.
ARTICLE
Journal Name
10 | J. Name., 2012, 00, 1-3 This journal is © The Royal Society of Chemistry 20xx
500/500 250/250 250/RT
At
RT Overall At RT Overall RTAt Overall
TPR1 0 559 ±17 0 238 ±7 0 208 ±6 TPR2 18 ±1 561 ±17 434 ±14 456 ±14 508 ±15 525 ±16 TPR3 46 ±2 531 ±16 440 ±14 468 ±14 555 ±17 585 ±18 3.4. Discussion
We have prepared a Pt (0.88 wt.%)/CeO2 catalyst, from a high specific
surface area support (125 m².g-1), containing atomically dispersed Pt
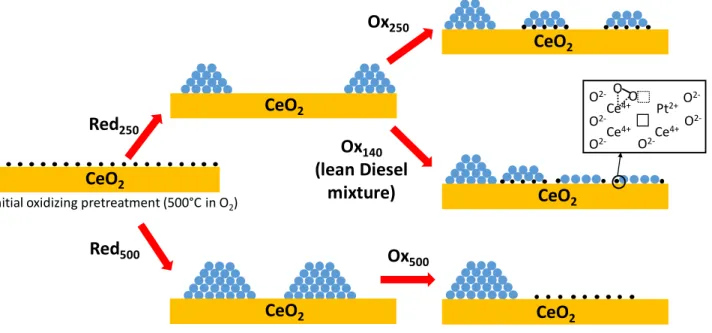
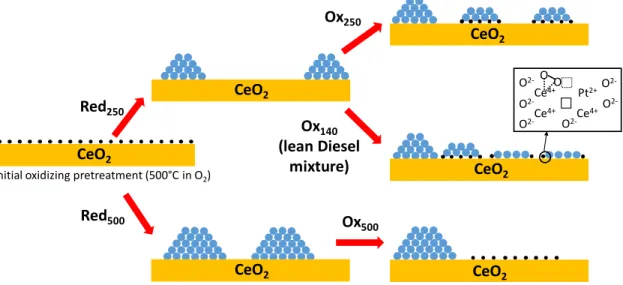
species and few Pt nanoclusters. Our results show that redox sequences can form sub-nanometric raft-like clusters, 3D hemispherical nanoparticles (1 – 2 nm) that co-exist with isolated Pt cations on ceria with different proportions. Although it is very tricky to obtain quantitative statistics on the repartition between these different Pt species by (S)TEM, our results have confirmed that the formation kinetics of Pt NPs during the reducing phases as well as their redispersion rate in oxygen are faster at 500 °C than at 250 °C. Therefore, redox sequences implemented at these different temperatures lead to various size and shape distributions of Pt on ceria and, consequently, to different Pt oxidation degrees and interactions with ceria. Figure 11 gives a schematic summary of the different catalyst states as a function of the various redox treatments.
Raman spectroscopy and H2-TPR technique coupled with ex situ
ADF-STEM experiments were used to gain more insight into the rearrangement of Pt nanoclusters upon the different redox treatments. The impact of the redox sequences on the catalytic oxidation performance of three different molecules (CO, NO and propene) also gave some indications on the nature of the catalytically active sites. Our results emphasise that, starting from a Pt/CeO2
catalyst predominantly containing isolated Pt species, the impact of redox sequence is negligible for NO oxidation, weak for propene oxidation and quite pronounced for CO oxidation. NO adsorption on Pt is probably weak as it is reported that larger reduced Pt0 particles
than those produced by our redox protocols are required for NO oxidation.1 Furthermore, NO oxidation is strongly inhibited by the
presence of water (Figure S5), suggesting a competitive adsorption between NO and H2O. The formation of mostly sub-nanometric Pt
clusters after a redox sequence involving a mild reduction at 250 °C does not enhance the propene oxidation significantly (Figures 3 and 4). This suggests that nanometric Pt clusters are also not very efficient for the activation of propene. However, intermediates of propene oxidation are supposed to be responsible for the drop of CO oxidation observed during light-off between 250 °C and 300 °C (Figures 2, 3 and 4). This indicates that propene and/or the formed intermediates are strongly chemisorbed on subnanometric Pt thin clusters and most probably poisons the surface, thus inhibiting CO and NO oxidation. To confirm this assumption, a LO curve was recorded after Red250/OxRT without any propene in the feed while
keeping the same space velocity (Figure S13). As expected, the
catalytic performances for CO oxidation improved without propene. The drop between 250 and 300°C has disappeared confirming the inhibiting role of propene on the CO oxidation in this temperature range. We have also observed that Pt NPs larger than 1 nm produced during Red500/Ox500 or rich/lean pulse cycling at 250 °C enhance the
propene oxidation (Figure 2 and S7, Table 1). Chemisorption of propene on larger reduced Pt particles is probably weaker, in good agreement with the shape of the CO oxidation light-off that does not show any drop or shoulder (Figure S7). This proves that CO oxidation on larger Pt nanoparticles is no more inhibited by strongly adsorbed propene.
Contrary to propene and NO oxidation, CO oxidation can be strongly promoted by the formation of Pt nanoclusters (Figures 3 and 4, Table 1). We found that an appropriate redox conditioning, composed of a mild reduction step at 250 °C in H2 for 1 h followed by an oxidation
phase at RT for 1 h, can significantly improve the low-temperature CO oxidation activity. CO starts to be oxidised below 60 °C in a simulated exhaust gas containing water, NO and propene and for a high space velocity (750 L·g-1catalystper hour). The CO conversion
reaches 20 % from around 100 °C. Different Pt precursors, ceria supports, Pt loadings, preparation methods and activation steps are proposed in the literature to promote the activity for CO oxidation of Pt/CeO2 catalysts (Table S1). This results in different active sites and
catalytic activities. A comparison of the catalytic activity for CO oxidation of our Pt/CeO2 catalyst after Red250/OxRT with previous
studies, even if reactive mixtures and space velocities are different, is provided in Table S1. The activity for CO oxidation at 100 °C reported by H. Wang et al.27 is much higher than that of our study
but the reactive mixture did not contain NO and propene. These two pollutants compete with CO oxidation.29,39 For instance, our results
emphasised that propene and/or the formed intermediates are strongly chemisorbed on subnanometric thin Pt clusters (Figure S12) and poison the surface, thus inhibiting CO and NO oxidation.39
Without H2O in the feed and a high concentration of CO,
Pereira-Hernandez et al. also reported a higher activity at 100°C (around 5 times larger).16 According to these two papers, one can conclude that
the activity of our Pt/CeO2 catalyst after Red250/OxRT is not as high.
However, we would like to point out that the lean mixture used in this present study mimics Diesel vehicle exhaust conditions as it contains not only CO and O2 but also water (large quantity : 10 vol.%),
propene (500 ppm) and NO (500 ppm). To the best of our knowledge, only one paper dealing with the activation of Pt/CeO2 catalysts has
used a similar simulated vehicle exhaust conditions.20 This study
reported a comparable activity (Table S1). The Pt dispersion was considered to be 100 % in the study of Nie et al..20 In our case, after
Red250/OxRT, the catalyst contains subnanometric Pt clusters,
meaning that the Pt dispersion is lower than 100 %. Therefore, TOF value at 100 °C is slightly higher in our study, around 4 – 6 10-2 s-1. In
a recent paper, we have measured the activity of a Pt/CeO2 catalyst
after redox pulses at 250 °C.17 These catalytic measurements were
performed in a lean mixture without H2O and NO. The catalyst was
exposed to the lean mixture at 250 °C after the redox pulses and cooled down in this mixture before the light-off. The activity for CO oxidation at 100 °C was found to be slightly lower than that of this present work despite the absence of steam and NO (Table S1). Therefore, referring to these two latter studies carried out with
Journal Name
ARTICLE
This journal is © The Royal Society of Chemistry 20xx J. Name., 2013, 00, 1-3 | 11
similar reactive mixtures, our catalyst exhibits great performances after Red250OxRT for low temperature CO oxidation.
STEM observations have evidenced monolayer Pt rafts on ceria after Red250/Ox140. This demonstrates that the lean mixture also tailors, at
low temperature, the shape of Pt clusters formed during Red250/OxRT,
promoting the redispersion of 3D particles towards rafts. In parallel,
in situ Raman spectroscopy has shown that the Red250/OxRT stabilises
the highest quantity of peroxo oxygen species on ceria located on oxygen vacancies (Figure 9b). However, no Ce3+ cations have been
detected and the relative concentration of Pt2+ cations after
Red250/OxRT, estimated from the intensity of ν(Pt-O) band, is lower
than after the initial oxidised state. Therefore, the oxygen vacancies concentration after Red250/OxRT is probably lower. Nevertheless,
these oxygen vacancies can stabilise a higher concentration of peroxo oxygen species. This suggests a modification of the electronic properties of oxygen vacancies after Red250/OxRT (Figure 11).
Although peroxo species seem to be a good indicator of the electronic properties of the Pt/CeO2 interface, their involvement in
the catalytic reaction needs to be further evidenced. The intermediate relative concentration of Pt2+ cations after Red250/OxRT,
evidenced by Raman spectroscopy, could also indicate that some reduced Pt° atoms co-exist with Pt2+ cations in Pt rafts (Figure 11).
The formation of reduced Pt particles is a clear prerequisite for the ceria reduction at the interface, as shown by TPR and in situ time-resolved XAS.24
A recent publication reports a similar redox activation for CO oxidation of a single atom Pt/ceria catalyst.27 This study used a mild
reduction step at 200 °C for 15 min following exposure in a lean reactive mixture containing CO/O2 (1000 ppm CO and 5 % O2)
between 100 and 180 °C. This is quite comparable to Red250/Ox140.
Using computational techniques (grand canonical Monte Carlo simulations combined with DFT calculations), Wang et al. propose that the Pt active site could be Pt monolayers with a Pt8O14 structure
composed of paired Pt–O–Pt catalytic units.27 The observed median
size of these clusters (around 1 nm), their monolayer nanostructure and the measured apparent activation energy (40 ± 2 kJ.mole-1) for
CO oxidation are in good agreement with our results observed on Pt rafts. Furthermore, Raman spectroscopy indicates that these rafts contain Pt2+ cations, as the proposed Pt8O14 structure. However,
Wang et al. suggest that the Pt–O–Pt ensemble provides an alternative oxygen supply route independent of the ceria support.27
Therefore, CO oxidation would not proceed through a Mars van Krevelen mechanism at the Pt/ceria interface. This is in contradiction with many earlier studies.14,18,19,20 The theoretical stability of Pt
clusters on a non-reduced ceria surface has been investigated by Loffreda and Delbecq by DFT.40 One of the main conclusions of these
calculations is that the stability of Pt clusters increases with the number of Pt-Pt bonds, then preferring 3D growth to a 2D one. This is in line with the low stability of the observed Pt rafts in oxidising conditions, when the ceria surface is not reduced, in particular if their structure involves Pt–O bonds.
At low temperatures, TPR experiments on Pt–O–Pt-based catalysts27
report a much lower H2 consumption (8-15 µmole·g-1catalyst) than that
recorded at RT on our sample after Red250/OxRT (434 – 455 µmole.g-1
O). This discrepancy could be explained by the presence of few metallic Pt clusters on our catalyst that could chemisorb H2 and
promote ceria reduction via the surface spillover. Aranifard et al.
have investigated the growth of Pt on a reduced surface of ceria (water-gas shift conditions).41 By applying the constrained ab initio
thermodynamic simulation method, they found that Pt atoms on a partially reduced ceria surface follow a closed-packed arrangement as small as Pt10 organised in a 2-atomic layer structure. Their calculations show that these small clusters strongly promote the reducibility of ceria, as observed experimentally on our catalyst. They have also evidenced that Pt not in contact with ceria (top atomic layer of the Pt10 cluster) are prone to be covered by CO.
Our experimental results emphasise the dynamic properties of the catalytic active sites as a function of the temperature and the redox nature of the atmosphere (Figure 11). The arrangement of closed packed Pt clusters is permanent between two pseudo-stable states of Pt on ceria: isolated cations in oxidising conditions at high temperature and 3D hemispherical NPs in reducing conditions. We have identified an intermediate monolayer arrangement that coincides with the low-temperature CO oxidation. These Pt rafts, formed in situ during a light-off, are most probably re-dispersed in the lean mixture above 150 °C as suggested by the drop of CO conversion experimentally observed (Figure 4). A similar deactivation phenomenon was recently observed on Pd/Al2O3 catalysts.42 This
study demonstrated the decomposition of Pd nanoparticles (2 – 15 nm) into single atoms at 750 °C in oxidising atmosphere, which caused a fast and abrupt decay of the catalytic activity for methane combustion. The deactivation was particularly pronounced for catalysts with small size and densities of Pd NPs.
Pt rafts coincide with a non-stable rearrangement of Pt clusters, strongly active for CO oxidation. In addition, this low-temperature CO oxidation activity can be recovered by a Red250/OxRT sequence as
shown in Figure 4, as the second and the third light-off curves (LO2 and LO3) are similar. This outcome indicates that a strategy based on periodic fuel post-injection, close to the real-world conditions (NOx
storage-reduction catalysts), could maintain a superior CO oxidation activity and high DOC performances, induced by the formation of the subnanometric thin Pt clusters.
The nanostructure of the Pt rafts is dependent on the local redox conditions and ceria surface defects. Based on computational techniques27,40,41 and our ADF-STEM observations (Figure 7),
subnanometric thin Pt clusters are probably close to a Pt8 or Pt10 structure. Pt rafts are composed of two kinds of Pt atoms: ionic species at the perimeter mainly bonded to interfacial surface ceria oxygen atoms and inner atoms mainly bonded to neighboring Pt atoms (Fig. 11). We propose that these two kinds of Pt atoms act synergistically to boost the CO oxidation. Inner atoms are probably more reduced than the ones at the perimeter and act as active sites to chemisorb CO. On the other hand, Pt atoms at the perimeter are in close interaction with ceria where the interfacial oxygen spillover on Pt can preferentially occur, in good agreement with the high reducibility of Interfacial oxygen species at the interface raft/ceria (Table 3). Therefore, they are prone to be involved in the CO oxidation process at low temperature and to react with CO chemisorbed on vicinity atoms to release CO2, according to a Mars
van Krevelen mechanism, as suggested by Aranifard et al. for Pt10/Ce(111) model catalysts.41 The proportion of perimeter Pt
atoms at the interface with ceria in subnanometric thin Pt clusters is much larger than in 3D NPs (Figure 11). This is in line with the study of Cargnello et al. that proposed that corner and perimeter Pt atoms