HAL Id: hal-01649500
https://hal.archives-ouvertes.fr/hal-01649500
Submitted on 10 Dec 2020
HAL is a multi-disciplinary open access
archive for the deposit and dissemination of
sci-entific research documents, whether they are
pub-lished or not. The documents may come from
teaching and research institutions in France or
abroad, or from public or private research centers.
L’archive ouverte pluridisciplinaire HAL, est
destinée au dépôt et à la diffusion de documents
scientifiques de niveau recherche, publiés ou non,
émanant des établissements d’enseignement et de
recherche français ou étrangers, des laboratoires
publics ou privés.
combustor: influence of fuel injection temperature on
thermo-acoustic stability
Thomas Schmitt, Gabriel Staffelbach, Sébastien Ducruix, Stefan Gröning,
Justin Hardi, Michael Oschwald
To cite this version:
Thomas Schmitt, Gabriel Staffelbach, Sébastien Ducruix, Stefan Gröning, Justin Hardi, et al..
Large-Eddy Simulations of a sub-scale liquid rocket combustor: influence of fuel injection
temper-ature on thermo-acoustic stability. 7TH EUROPEAN CONFERENCE FOR AERONAUTICS AND
AEROSPACE SCIENCES (EUCASS), Jul 2017, Milan, Italy. �10.13009/EUCASS2017-352�.
�hal-01649500�
DOI: ADD DOINUMBER HERE
Large-Eddy Simulations of a sub-scale liquid rocket
combustor: influence of fuel injection temperature on
thermo-acoustic stability
Thomas Schmitt1†, Gabriel Sta↵elbach2, Sébastien Ducruix1,
Stefan Gröning3, Justin Hardi3, Michael Oschwald3,4
1Laboratoire EM2C, CNRS, CentraleSupélec, Université Paris-Saclay,
Grande Voie des Vignes, 92295 Châtenay-Malabry, France
2Centre Européen de Recherche et de Formation Avancée en Calcul Scientifique (CERFACS),
42, Avenue Gaspard Coriolis, 31057 Toulouse Cedex 01, France
3German Aerospace Centre (DLR), Institute of Space Propulsion,
Lampoldshausen Im Langen Grund, 74239 Hardthausen
4Institute of Jet Propulsion and Turbomachinery, RWTH Aachen University
Templergraben 55, 52062 Aachen
†Corresponding author ([email protected])
Abstract
The present work aims at the prediction of high frequency combustion instabilities in cryogenic rocket engines using Large Eddy Simulation (LES). The sub-scale rocket combustor BKD from DLR has 42 coaxial injectors fed with liquid oxygen and gaseous hydrogen operating at conditions representative of full-scale engines. The combustor is found to be stable for low hydrogen injection temperatures and unstable for higher ones. The LES solver is first validated on the Mascotte test-bench from ONERA. Two BKD cases are then simulated, corresponding to naturally stable and unstable regimes in the experiment. The recent progresses and results are described and analyzed.
1. Introduction
Combustion instability arises from the resonant coupling between the unsteady heat release rate of the flame and the acoustic eigenmodes of the system. The early developments of liquid propellant rocket engines during the twentieth century have often led to large-scale instabilities with serious consequences. The very high power densities in these motors (of the order of 50 GW m 3) can induce extreme levels of pressure fluctuations during unstable episodes,
which increase heat fluxes towards the wall, damaging the chamber and leading in most cases to the failure of the launch. High-frequency instabilities, corresponding to the coupling with a transverse acoustic mode of the combustion chamber, are the most dangerous ones and remain an issue during the development of liquid rocket engines, because of the curent inability to accurately predict their occurence. The DLR (German Space Center) has developed a cylindrical combustion chamber equipped with 42 coaxial injectors and operating in the transcritical regime (ie at a pressure above the critical pressure of oxygen but an oxygen injection temperature lower than the critical temperature). This sub-scale thrust chamber, with a power up to 91 MW, is referred to as BKD.5–7 Since this experiment can operate both under
stable and unstable operating conditions, it provides a unique opportunity to assess the ability of the simulation to predict and discriminate between these two situations.
There is, to the authors’ knowledge, only one three-dimensional numerical study of a complete engine repre-sentative of liquid propellant rocket engines available to the scientific community. These are the calculations made with the AVBP solver.24, 25 These first calculations made it possible to show the feasibility of a complete simulation
of the BKD bench. The results are particularly remarkable because they allow to identify the most unstable cases (in agreement with the experiments) and the structure of the associated unstable modes. However, the thermo-acoustic instability did not appear naturally in the computation, unlike in the experiments. An initial pulse of variable amplitude was added during the numerical tests to determine the so-called non-linear stability of the system.
The aim of this work is now to predict the natural instability, i.e. without any additional triggering of the system. The reference BKD test case is the one presented in Gröning et al.,5, 6 where the temperature of the hydrogen flow
is gradually increased during the experiment, demonstrating higher pressure oscillations for the higher temperatures
(flow rates being maintained). The objective is then to evaluate the ability of high-performance computing to predict the occurrence of combustion instabilities in a rocket engine via a change in operating conditions, an aspect of primary importance for the space industry. The AVBP solver from Cerfacs and IFPEN used here is first briefly presented in Sec. 2. Validations based on Large-Eddy Simulations of the Mascotte test-bench from Onera26are then shown in Sec.
3. Finally, two cases from the BKD test bench are simulated and detailed in Sec. 4, corresponding to naturally stable and unstable regimes in the experiment. Conclusions and perspectives are drawn in Sec. 5.
2. Governing equations, models and numerics
The Favre-filtered, fully compressible Navier-Stokes equations are used to formulate the Large-Eddy Simulations (LES) approach.17 The species and heat fluxes use classical gradient approaches. The fluid viscosity and the heat
di↵usion coefficient are calculated following the Chung et al. method,3 and the species di↵usion coefficients are
ob-tained via a Schmidt number along with the Hirschfelder-Curtiss approximation.17The error associated to the constant
Schmidt numbers assumption mostly appears in zones of high-density gradient,15 where it turns to be negligible in
comparison with the dominant turbulent viscosity. In the flame region, no important variation of the Schmidt numbers have been observed.18 Following DNS results of Oefelein,15the Soret and Dufour e↵ects, which are shown to be much
smaller than ordinary di↵usion, are neglected.
The subgrid-scale (SGS) stress tensor is modeled with the WALE model,14 well-suited for shear flows. The
SGS energy and species fluxes are modeled using the gradient transport assumption, introducing turbulent Prandtl and Schmidt numbers, all set to 0.6. In the absence of fully validated models, additional SGS terms, depicted in Taskinoglu et al.23and that can be neglected in ideal case, are not considered here. Thermodynamic non-idealities are accounted for
using the Soavre-Redlich-Kwong equation of state,22used for a consistent derivation of all thermodynamic coefficients
and functions.1, 15
The compressible unstructured solver AVBP13, 20developed by CERFACS and IFP-EN, with specific modules
by EM2C for real gas e↵ects is used for this study. Its Taylor-Galerkin weighted residual central distribution scheme, called TTGC, is third-order in time and space.4 The Jacobian matrices of non-viscous fluxes used by the scheme are
written to be fully consistent with the non-ideal thermodynamics. Boundaries are treated with the characteristic wave decomposition method NSCBC derived for non-ideal thermodynamics.16
Chemical conversion is handled using the infinitely fast chemistry model.19 This model is modified to account
for the following species: H2, O2 , H2O and OH in order to properly calculate the burnt gas temperature. Equilibrium reference mass fractions are tabulated in terms of the mixture fraction and its variance, both transported during the simulations. The species source terms are then computed following the method described in Schmitt et al.19
3. Validation of the LES solver: simulation of the Mascotte test cases
3.1 Experimental configurations
The validation configuration is the Mascotte experiment operated by Onera,26 which has been extensively used for
experimental studies of cryogenic combustion.2, 8The present simulations reproduce cases A60 and C60, corresponding
to transcritical flames.2, 11 A unique coaxial injector produces a dense oxygen stream (i.e. liquid-like oxygen) at low
velocity (less than 10 m/s), surrounded by a high-velocity gaseous hydrogen stream (more than 100 m/s), in a chamber at pressure that is above the critical one for both reactants. For both cases the chamber pressure is set to 60 bar. Cases A60 and C60 di↵er only by the hydrogen mass flow rate, which is 50% larger for case A60. It leads to a larger momentum flux ratio between fuel and oxygen for case A60 compared with case C60.2 Oxygen is injected at 83 K,
below its critical temperature (TC,O2 =154 K), and is transcritical, while hydrogen, injected at 300 K, is supercritical
and gaseous (TC,H2 =33 K). Under such conditions, the density of oxygen (⇢O2 =1340 kg.m 3) is much larger than
that of hydrogen (⇢H2 =5.25 kg.m 3), leading to a density ratio S⇢between the reactants close to 250 at injection. Note
that in both cases, hydrogen is always in excess.
3.2 Computational domain, mesh and boundary conditions
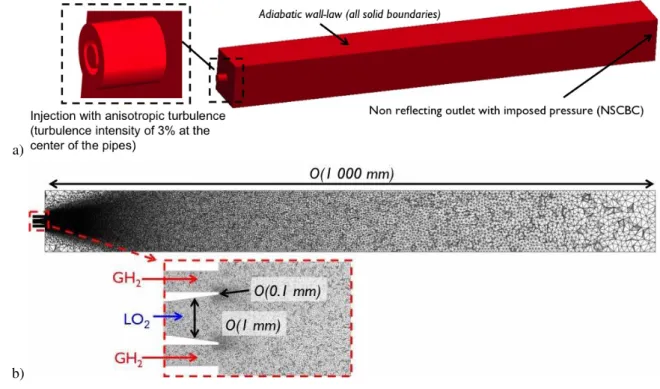
The computational domain is sketched in Fig. 1a and reproduces the geometry of the experimental chamber. The section of the combustion chamber is square-shaped (50 mm x 50 mm), and the domain length is of the order of 1 000 mm. A zoom close to the coaxial injector is shown in Fig. 1b. The thin (o(0.1 mm)) tapered lips are also accounted for in the simulation. The three-dimensional simulations are performed on a mesh containing 2,000,000 points and 11,000,000 tetrahedra. The smallest cell is located at the tip of the separator between oxygen and hydrogen,
meshed with 5 cells in its thickness, which proved to be sufficient for a proper flame stabilization (Fig. 1b). The mesh is progressively coarsened downstream, where the flow and flame structures are less sharp. Walls are treated as adiabatic with a wall-law boundary condition. The inlet and outlet conditions are both set with non-reflecting boundary conditions, with a relaxation on the pressure at the exit boundary condition. Anisotropic turbulent velocity fluctuations are superimposed to the bulk flow at the injection (on both oxygen and hydrogen streams), with an intensity of 3 %.12, 21
a)
b)
Figure 1: (a) Sketch of the computational domain. (b) Longitudinal slice of the mesh
3.3 Results and comparison with experimental data
Iso-surfaces of temperature (2000 K) colored by the axial velocity are presented in Fig. 2. It qualitatively shows the flame brush. The flame topology is similar in both cases, with an initially low spreading angle in the near injector region followed by a sudden expansion region (x ⇡ 10d). Finally, large scale structures develop in the second part of the flame as the flow interacts with the lateral walls. The flame in case C60 is much longer than the one obtained in case A60. The lower length in case A60 is expected to come from the much larger momentum flux ratio for case A60 compared with case C60, increasing the shear and the combustion efficiency.2
Numerical results are compared with experimental results from Juniper et al.11 in Fig. 3. Iso-contours of
OH mass fraction (white lines) from LES are super-imposed with Abel transform of the time-averaged natural OH* emission images (in color). Such a comparison is qualitative; only the flame position can be properly compared. In both cases, the flame shape is properly retrieved and the axial position of maximum spreading position is correct. Note that in both calculations and experiments, the flame is closed at the end of the visualisation windows for case A60 while it is still open for case C60. The overall agreement between simulation and expriment is very good.
a)
b)
Figure 2: Iso-surfaces of temperature (2000 K) colored by axial velocity (blue: -25 m/s ; red: 150 m/s) (a) Case A60, (b) Case C60.
a)
b)
Figure 3: Comparison with experimental data from Juniper et al.11 Color: Abel transform of the time-averaged natural
OH* emission images from experiments. White lines: iso-contour of average OH fractions from simulations. (a) Case A60, (b) Case C60.
4. Large Eddy Simulation of BKD
4.1 Experimental configurations
The BKD experiment5–7is operated at the European Research and Technology Test Facility P8 for cryogenic rocket
engines at DLR Lampoldshausen is a sub-scale thrust chamber featuring 42 H2/O2 coaxial injectors (Fig. 4a). This
configuration has the particularity of featuring self-excited combustion instabilities depending on the injection condi-tions (Fig. 4b). The chamber is instrumented with a high frequency measurement ring including 2 dynamic pressure sensors, located at 5 mm from the injection plan. There is no optical access, but the instrumentation is sufficient for the detection of unstable regimes and the modal identification of the observed instabilities.7 The chamber walls are
water-cooled to limit their maximum temperature and heat loss measurements are available. The length and the radius of the chamber are of the order of 100 mm, while coaxial injectors features characteristic diameters representative of
liquid rocket engines (o(10 mm)).
a) b)
Figure 4: (a) Sketch of the BKD chamber5(b) Experimental results during ramp tests,5where hydrogen temperature is
slowly changed. Gliding RMS calculation of the dynamic pressure sensor signals in the chamber (5 mm from injection plan) for the 1T and 2T modes, dynamic pressure sensor signal in chamber (5 mm from injection plan) and injection conditions.
In this study, we concentrate on the influence of hydrogen temperature injection on the thermo-acoustic stability of the chamber.6 All the other injection characteristics (hydrogen and oxygen mass flow rates, oxygen temperature)
are kept unchanged during the simulations. Injection conditions for the two cases are shown in Tab. 1. The chamber pressure for both cases is close to 80 bar. Oxygen is transcritical (⇢LOx=1100 kg m 3) and injected at low velocity
(O(10 m s 1)), while hydrogen supercritical (⇢
H2 =29 kg m 3) and injected at high velocity (O(100 m s 1)).
The two cases retained for the simulations are represented in Fig. 4b. Case T57 leads to lower pressure fluctuation amplitudes in the chamber than case T131. In particular, for case T57, the second transverse (2T) acoustic mode slightly dominates the first transverse (1T) one. As a consequence, case T57 is considered being stable for the 1T mode and moderately excited for the 2T mode. On the contrary, case T131 presents large amplitudes of fluctuations of the 1T mode (compared with case T57) and the mode is considered as excited, while the 2T mode is stable. In the following, for the sake of simplicity, case T57 is said to be stable and case T131 is considered unstable.
Case ˙mLOx[kg/s] ˙mH2[kg/s] TLOx[K] TH2[K] Exp. behaviour
T57 5.8 0.97 107.6 57.6 Stable 1T mode, moderately excited 2T mode T131 5.8 0.97 107.6 131.7 Excited 1T mode, stable 2T mode
Table 1: Injection conditions for the two selected cases of the BKD experimental setup.5–7
4.2 Computational domain, mesh and boundary conditions
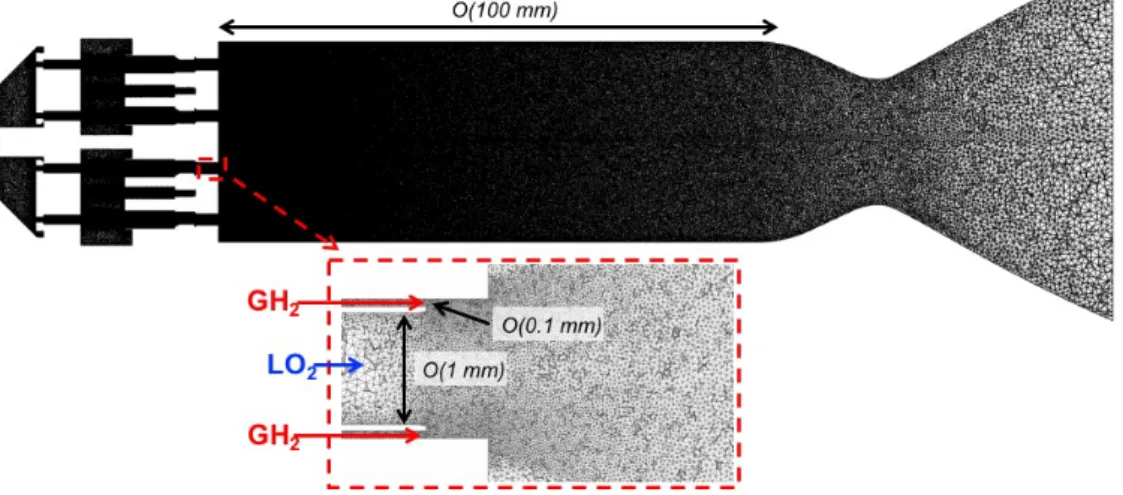
The computational domain is shown in Fig. 5 and corresponds to the experimental chamber, including the hydrogen and oxygen domes and feeding lines. In order to properly represent the outlet flow and acoustic impedance, the outlet nozzle is also simulated. The grid (Fig. 6) comprises 55,000,000 points and 300,000,000 tetrahedra. It is highly refined close to the annular injectors that feature very small geometrical elements (0(0.1mm)). All the solid boundaries are treated as adiabatic no-slip walls and iso-thermal (500 K) wall-law are used at the chamber walls to account for water cooling. Oxygen and hydrogen are injected in the domes using non-reflecting boundary conditions with mass flow rates and temperatures imposed. As the nozzle is choked, nothing is imposed at outlet.
a) b)
Figure 5: (a) Sketch of the full computational domain. (b) Injection plan featuring 42 injectors.
Figure 6: Longitudinal slice of the mesh used for the simulation of the BKD test cases and zoom on a single injector.
Both simulation are started on a coarser grid in order to install the large scale recirculation in the chamber. It is then interpolated on the final grid. One convective time is estimated to be close to 5 ms.
4.3 Flame tolopogy (stable flames)
Iso-surfaces of temperature (2 100 K) that qualitatively represent the flame brush for case T131 are shown in Fig. 7. The surfaces are highly corrugated by turbulence and extend up to the middle of the chamber.
Figure 7: Iso-surfaces of temperature (2100 K) colored by axial velocity (blue: -150 m/s ; red: 450 m/s).
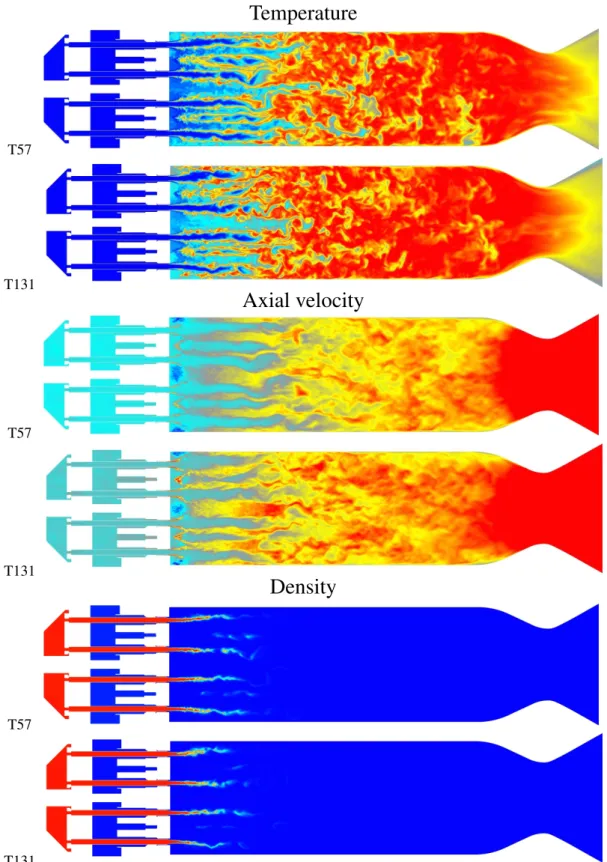
Longitudinal slices of temperature, axial velocity and density are shown for both cases T57 and T131 in Fig. 8. Note that case T57 is here considered before the growth of instability detailed in Sec. 4.4 (at 8 ms on Fig. 9) so that it can be qualitatively compared with case T131. The two cases show a similar flame topology. The cold and dense
oxygen jets extend up to one third of the chamber length. They are surrounded by a high velocity stream of hydrogen. The resulting flame wrapping the oxygen jet is highly wrinkled. Once the high density jets break-up, releases of high density oxygen pockets are observed. The high velocity hydrogen injection generates large scale and strong amplitude recirculation zones between the injectors along the injector plan.
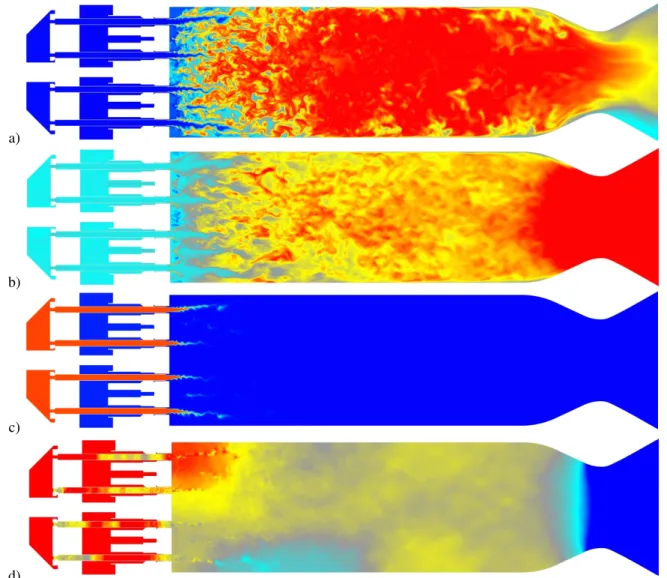
Temperature
T57 T131Axial velocity
T57 T131Density
T57 T131Figure 8: Longitudinal slices of instantaneous fields of (a) temperature (blue: 50 K ; red: 3 600 K), (b) axial velocity (blue: -250 m/s ; red: 500 m/s) and (c) density (blue: 5 kg/m3; red: 1150 kg/m3). Top: Case T57. Bottom: Case T131.
4.4 Temporal evolutions
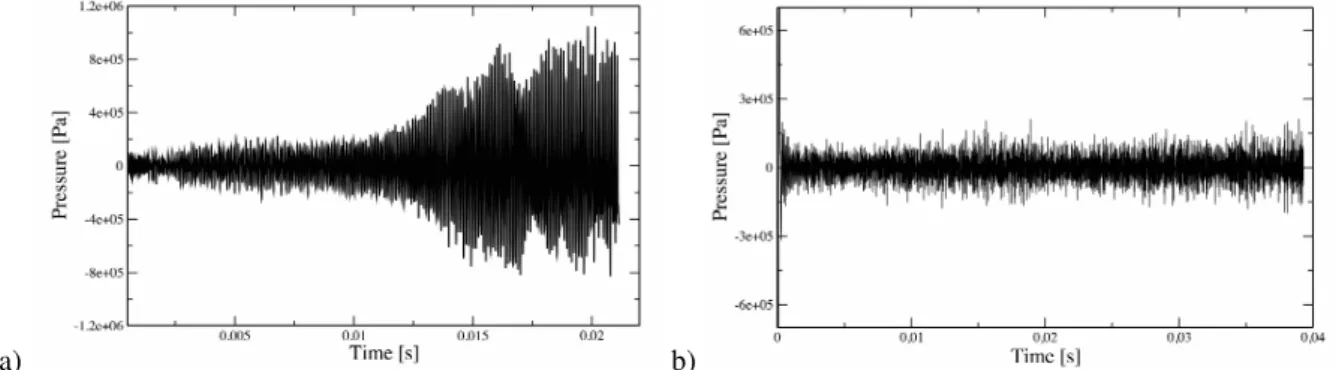
The temporal evolution of pressure in the chamber is plotted in Fig. 9 for both cases. Frequencies lower than 5 000 Hz have been removed thanks to a third-order Butterworth filter. These plots show the temporal evolution since the beginning of the simulation on the final grid (after the interpolation from the coarser grid). After a few milliseconds, the pressure in case T57 reaches a quasi-steady behavior, with pressure oscillations around 4 bar peak-to-peak. After 10 ms, the amplitude of the pressure oscillations increases suddenly and the system becomes naturally unstable. After 17 ms, the system seems to have reached a limit cycle, with pressure oscillations around 13 bar peak-to-peak. On the contrary, case T131 remains fully stable during the whole simulation, with pressure oscillations lower than 3 bar peak-to-peak.
a) b)
Figure 9: Pressure evolution in chamber for (a) case T57 and (b) case T131. The signal is band filtered between 5 kHz and 50 kHz using a third order Butterworth filter.
Figure 10a shows the power spectral density of pressure in the chamber for case T57, once the instability has reached the limit cycle. Two peaks dominate. The first mode at 10 kHz corresponds to the first transverse mode of the chamber. This is shown in the bandpass-filtered signal (around 10 kHz) in Fig. 10b, where the signals from P1 and P3 (see Fig. 11(1)) are in phase opposition and with a much larger ampltiude that the ones from P2 and P4. The second mode at 20 kHz seems to correspond to the first radial mode of the chamber.25 Successive snapshots are shown
in Fig. 11.
a) b)
Figure 10: Case T57. (a) Power spectral density of the pressure signal in the chamber (Welch’s method, with 5 blocks and 50 % overlapping, df=50 Hz) computed after 17 ms. (b) Bandpass-filtered (around 10 kHz) pressure signal (at 18 ms) in the chamber for 4 di↵erent probes positioned along the chamber wall at 5 mm from the injection plan and 90° from each other (see Fig. 11(1)).
These results are in opposition with those from experiments (T57 should be stable for the 1T mode and T131 unstable). The reason for this discrepancy is under investigation and is expected to come from a insufficient grid resolution in the annular injector. Interestingly, the unstable mode obtained in LES share strong similarities with the unstable one in the experiments7: same dominant modes (1T and 1R), similar frequencies, similar pressure fluctuations
amplitude. This may be due to the little di↵erences observed between the flow fields for the two cases, as shown in Fig. 8. Still, these results are encouraging, because this is the first time a natural transition from a stable to an
1) 2) 3)
4) 5) 6)
7) 8) 9)
10) 11) 12)
Figure 11: Case T57. Transverse slices (5 mm from injector plan) of instantaneous fields of pressure (Blue: 60 bar ; red: 90 bar) during one period of oscillation of the first mode at 10 kHz.
unstable behavior is obtained by numerical simulations in conditions representative of LOx/H2rocket engines (i.e. a
4.5 Influence of thermo-acoustic instability on flame topology (case T57)
Figure 12 shows instantaneous fields of temperature for case T57 after the growth of the instability (22 ms on Fig. 9a). Compared with the previous illustrations shown in Sec. 4.3, the flames are now much shorter, in particular in the center of the chamber where the transverse acoustic velocity is maximum. These flames, located in a pressure node and a velocity anti-node, show a sinuous motion.9, 10The outer flames, on the contrary, essentially located in a pressure
anti-node leading to inlet velocity modulations,24present a varicose-like shape.
a)
b)
c)
d)
Figure 12: Case T57. Longitudinal slices of instantaneous fields of (a) temperature (blue: 50 K ; red: 3 600 K), (b) axial velocity (blue: -200 m/s ; red: 500 m/s), (c) density (blue: 5 kg/m 3 ; red: 1 150 kg/m 3) and (d) pressure (blue: 60 bar ; red: 90 bar). t = 22 ms.
5. Conclusions
This paper present work-in-progress calculations of the BKD experiment from DLR. This sub-scale combustor is naturally unstable depending on the injection conditions. In particular, it has been shown6 that the configuration is
stable for low hydrogen temperature injection and become unstable for a higher temperature. Two cases are then retained for the simulations: one stable (T57) and the other one unstable (T131). These cases only di↵er by the hydrogen injection temperature. These simulations are performed in a LES framework with the AVBP RG solver. This solver is first validated simulating the Mascotte configurations from ONERA operating at supercritical pressure. Very good agreements are obtained on the configurations A60 and C60. Current numerical simulations predict that case T57 is unstable and case T131 is stable. Interestingly, the unstable modes obtained in LES share strong similarities with the
unstable ones in the experiments7: same dominant modes (1T and 1R), similar frequencies, similar pressure fluctuations
amplitude. Although not in agreement with experimental measurements, current results are very encouraging as, to the authors knowledge, this is the first time a combustion instability is naturally predicted by a LES solver in a configuration representative of a LOx/H2 rocket engine (transcritical regime, large number of injectors, cylindrical
chamber). Investigation are now focusing on the injection flow, as it may be a key element for the explanation of the observed discrepancy.
Acknowledgements
Support provided by SAFRAN Snecma Space Engines Division, the prime contractor of the Ariane launcher cryogenic propulsion system and CNES, the French National Space Agency, is gratefully acknowledged. This investigation was carried out in the framework of the French-German REST program initiated by CNES, ASL and DLR. Thanks to Dmitry Suslov, Stefan Gröning and the P8 test bench team for performing the experiments. This work was granted access to the HPC resources of IDRIS and CINES made available by GENCI (Grand Equipement National de Calcul Intensif) under the allocation x20162b6176. The support of CINES for access to the computational resources of Occigen under a "grand challenge" allocation is acknowledged. Part of these calculations were performed in 2016 thanks to a special allocation on Curie made available by TGCC.
References
[1] J. Bellan. Theory, modeling and analysis of turbulent supercritical mixing. Combustion Science and Technology, 178(1):253–281, 2006.
[2] S. Candel, M. Juniper, G. Singla, P. Scouflaire, and C. Rolon. Structure and dynamics of cryogenic flames at supercritical pressure. Combust. Sci. Technol., 178:161–192, 2006.
[3] T.H. Chung, M. Ajlan, L.L. Lee, and K.E. Starling. Generalized multiparameter correlation for nonpolar and polar fluid transport properties. Industrial & engineering chemistry research, 27(4):671–679, 1988.
[4] O. Colin and M. Rudgyard. Development of high-order Taylor-Galerkin schemes for unsteady calculations. J. Comput. Phys., 162(2):338–371, 2000.
[5] S. Gröning, D. Suslov, J. S. Hardi, and M. Oschwald. Influence of hydrogen temperature on the acoustics of a rocket engine combustion chamber operated with lox/h2 at representative conditions. Proceedings of Space Propulsion, 2014.
[6] S. Gröning, D. Suslov, J. S. Hardi, and M. Oschwald. Influence of hydrogen temperature on the stability of a rocket engine combustor operated with hydrogen and oxygen. CEAS Space Journal, pages 1–18, 2016.
[7] S. Gröning, D. Suslov, J. S. Hardi, and M. Oschwald. Injector-driven combustion instabilities in a hydro-gen/oxygen rocket combustor. Journal of Propulsion and Power, 32(3):560–573, 2016.
[8] M. Habiballah, M. Orain, F. Grisch, L. Vingert, and P. Gicquel. Experimental studies of high-pressure cryogenic flames on the Mascotte facility. Combustion Science and Technology, 178(1):101–128, 2006.
[9] L. Hakim, A. Ruiz, T. Schmitt, M. Boileau, G. Sta↵elbach, S. Ducruix, B. Cuenot, and S. Candel. Large eddy simulations of multiple transcritical coaxial flames submitted to a high-frequency transverse acoustic modulation. Proceedings of the Combustion Institute, 35(2):1461–1468, 2015.
[10] L. Hakim, T. Schmitt, S. Ducruix, and S. Candel. Dynamics of a transcritical coaxial flame under a high-frequency transverse acoustic forcing: Influence of the modulation frequency on the flame response. Combustion and Flame, 162(10):3482–3502, 2015.
[11] M. Juniper, A. Tripathi, P. Scouflaire, JC Rolon, and S. Candel. Structure of cryogenic flames at elevated pres-sures. Proc. Combust. Inst., 28(1):1103–1110, 2000.
[12] R.H. Kraichnan. Di↵usion by a random velocity field. The physics of fluids, 13:22–31, 1970.
[13] V. Moureau, G. Lartigue, Y. Sommerer, C. Angelberger, O. Colin, and T. Poinsot. High-order methods for DNS and LES of compressible multi-component reacting flows on fixed and moving grids. J. of Comput. Phys., 202(2):710–736, 2005.
[14] F. Nicoud and F. Ducros. Subgrid-scale stress modelling based on the square of the velocity gradient. Flow, Turbulence and Combustion, 62(3):183–200, 1999. JX.
[15] J.C. Oefelein. Mixing and combustion of cryogenic oxygen-hydrogen shear-coaxial jet flames at supercritical pressure. Combust. Sci. Technol., 178(1):229–252, 2006.
[16] N. Okong’o and J. Bellan. Consistent boundary conditions for multicomponent real gas mixtures based on char-acteristic waves. J. Comput. Phys., 176:330–344, 2002.
[17] T. Poinsot and D. Veynante. Theoretical and numerical combustion - Third Edition. page 588, 2011.
[18] G. Ribert, N. Zong, V. Yang, L. Pons, N. Darabiha, and S. Candel. Counterflow di↵usion flames of general fluids: Oxygen/hydrogen mixtures. Combust. Flame, 154(3):319–330, 2008.
[19] T. Schmitt, Y. Méry, M. Boileau, and S. Candel. Large-eddy simulation of oxygen/methane flames under trans-critical conditions. Proc. Combust. Inst., 33:1383–1390, 2011.
[20] T. Schönfeld and M. Rudgyard. Steady and unsteady flows simulations using the hybrid flow solver avbp. AIAA Journal, 37(11):1378–1385, 1999.
[21] A Smirnov, S Shi, and I Celik. Random flow generation technique for large eddy simulations and particle-dynamics modeling. J. Fluids Eng, 123(2):359–371, 2001.
[22] G. Soave. Equilibrium constants from a modified Redlich-Kwong equation of state. Chemical Engineering Science, 27:1197–1203, 1977.
[23] E.S. Taskinoglu and J. Bellan. A posteriori study using a DNS database describing fluid disintegration and binary-species mixing under supercritical pressure: heptane and nitrogen. Journal of Fluid Mechanics, 645:211–254, 2010.
[24] A Urbano, Q Douasbin, L Selle, G Sta↵elbach, B Cuenot, T Schmitt, S Ducruix, and S Candel. Study of flame response to transverse acoustic modes from the les of a 42-injector rocket engine. Proceedings of the Combustion Institute, 36(2):2633–2639, 2017.
[25] A. Urbano, L. Selle, G. Sta↵elbach, B. Cuenot, T. Schmitt, S. Ducruix, and S. Candel. Exploration of combustion instability triggering using large eddy simulation of a multiple injector liquid rocket engine. Combustion and Flame, 169:129–140, 2016.
[26] L. Vingert, A. Nicole, and M. Habiballah. The mascotte single injector 60 bar hot test for code validation - test-case specifications and some more experimental data. In Proceedings of the 3rd International Workshop Rocket Combustion Modeling. Snecma, march 2006.