HAL Id: hal-00317108
https://hal.archives-ouvertes.fr/hal-00317108
Submitted on 1 Jan 2003
HAL is a multi-disciplinary open access
archive for the deposit and dissemination of
sci-entific research documents, whether they are
pub-lished or not. The documents may come from
teaching and research institutions in France or
abroad, or from public or private research centers.
L’archive ouverte pluridisciplinaire HAL, est
destinée au dépôt et à la diffusion de documents
scientifiques de niveau recherche, publiés ou non,
émanant des établissements d’enseignement et de
recherche français ou étrangers, des laboratoires
publics ou privés.
at high latitude
T. Christensen, N. Østgaard, T. J. Rosenberg, D. L. Detrick, G. A. Germany,
P. Stauning
To cite this version:
T. Christensen, N. Østgaard, T. J. Rosenberg, D. L. Detrick, G. A. Germany, et al.. Conjugate
high-intensity energetic electron precipitation at high latitude. Annales Geophysicae, European Geosciences
Union, 2003, 21 (7), pp.1443-1455. �hal-00317108�
Annales Geophysicae (2003) 21: 1443–1455 c European Geosciences Union 2003
Annales
Geophysicae
Conjugate high-intensity energetic electron precipitation at high
latitude
T. Christensen1,2, N. Østgaard3, T. J. Rosenberg4, D. L. Detrick4, G. A. Germany5, and P. Stauning1
1Solar-Terrestrial Physics Division, Danish Meteorological Institute, Lyngbyvej 100, DK-2100 Copenhagen, Denmark 2Niels Bohr Institute, Copenhagen University, Juliane Maries Vej 30, DK-2100 Copenhagen, Denmark
3Space Sciences Laboratory, University of California, Berkeley, CA 94720, USA
4Institute for Physical Science and Technology, University of Maryland, College Park, MD 20742-2431, USA
5Center for Space Plasma, Aeronomy, and Astrophysics Research, University of Alabama, Huntsville, AL 35899, USA
Received: 14 June 2002 – Revised: 9 December 2002 – Accepted: 16 December 2002
Abstract. On 6 August 1998 an intense precipitation event
occurring at high latitude in the evening sector was observed by X-ray and far-ultraviolet imagers on board the Polar satel-lite and by several ground-based instruments. The precip-itation region was centred at approximately 19:00 MLT at 74◦ MLAT (at an L-shell of about 13). The event started at 22:59 UT and lasted about 10 minutes. It happened dur-ing the late expansion phase of a substorm after two hours of strongly southward IMF. Imaging riometers at geomag-netically conjugate sites recorded strong absorption levels which exceeded 7 dB at 38 MHz in a transient and localized intensification occurring within a poleward moving arc-like feature. The temporal and spatial similarities between the recordings from the two conjugate regions are remarkable. The arc-like precipitation region progressed poleward with a velocity of 1.5 km/s. Ground magnetometers co-located with the imaging riometers observed disturbances consistent with poleward moving westward currents. In X-ray and riometer images which are sensitive only to energetic electrons (above 5–10 keV) the event seems isolated, but in UV images the event is seen to occur on the poleward edge of the rapidly poleward expanding evening side aurora. The energy spec-trum of precipitating electrons was subject to a temporary hardening which peaked at a mean energy of about 20 keV when the event was at its most intense at 23:02 UT. The event is likely to have been caused by an accelerating mechanism at some height above the ionosphere or by an earthward flow burst in the magnetotail, or possibly both.
Key words. Magnetospheric physics (energetic particles,
precipitating; storms and substorms; magnetosphere-ionosphere interactions)
Correspondence to: T. Christensen
1 Introduction
The spectacular substorm phenomenon with its conspicuous auroral manifestations is driven by magnetospheric processes resulting from the interaction with the solar wind. Sparsity of magnetospheric observations due to the huge volume to be covered and the difficulty of integrating in one model pro-cesses occurring on very different spatial scales have given plenty of challenges in the field of substorm modelling. Af-ter four decades of substorm research one model in particular seems to have emerged successfully. The near-Earth neutral line (NENL) model (a review and status of which is given by Baker et al., 1996) is very promising and comprises many of the observed characteristics in the near-Earth and distant tail, e.g. it successfully predicted the subsequently observed structure of flux ropes and plasmoids.
Transient energetic events occurring in the magnetotail can give rise to a multitude of ionospheric manifestations. Disturbances can be communicated along magnetic field lines and can thus reach the high-latitude ionosphere very fast. The effect can also be in the form of fast earthward plasma flows which penetrate far into the inner magneto-sphere where the flow is decelerated and the particles are subject to scattering processes which enable them to travel along field lines into the auroral ionosphere. Plasma heating and acceleration associated with bursts of reconnection are thought to be the cause of bursty bulk flow events. These are spatially localized enhancements in the flows in the near-Earth and mid-tail plasma sheet on a time scale of 10 min, and embedded in these are velocity peaks of about 1 min in duration called flow bursts (Angelopoulos et al., 1992). Flow bursts have been demonstrated to be closely associated with several different types of auroral activations, also at high lat-itude. Fairfield et al. (1999) reported auroral brightenings near the poleward boundary of the auroral oval in connection with fast earthward magnetotail flow bursts. Nakamura et al. (2001) selected 31 flow burst events from Geotail data and
all turned out to be correlated with some auroral activation. For high-latitude activations the flow bursts were detected in the mid-tail region beyond 15 RE. They were mainly
ob-served during the recovery phase when the reconnection re-gion might have moved so far tailward that earthward flows couldn’t penetrate deep into the inner magnetosphere. Ieda et al. (2001) identified 24 clear plasmoid signatures in data from the Geotail satellite and found that they were all asso-ciated with auroral brightenings, although sometimes rather weak ones. Their data suggested that the brightenings were due to earthward flow bursts initiated by the reconnection event, rather than with the plasmoid or flux rope itself.
An analysis of 1049 sharp electron energy flux enhance-ment events from DMSP F7 (a low-altitude polar orbiting satellite) was made by Newell (2000). He found from their spectral characteristics that all such events were associated with acceleration processes rather than with source plasma sheet density variations. Wave-particle interactions is one possible acceleration mechanism. Downward acceleration of electrons by a field-aligned potential drop is another. In the creation of such potentials a feedback mechanism such as that described by Atkinson (1970) is likely to be involved. Conductivity enhancements caused by particle precipitation will localize the field-aligned currents in the region of en-hanced conductivity. This will lead to more intense currents and thus more precipitation which will further intensify the field-aligned currents. A potential drop can now be created by an instability developing due to an insufficient supply of magnetospheric electrons to sustain the upward field-aligned currents. A similar mechanism that can give rise to a quickly growing and subsequently quickly decaying field-aligned po-tential was proposed by Stauning (1998). Current-voltage relationships have been studied by several authors (Olsson et al., 1996, and references therein). Olsson et al. (1996) de-rive potential drops of 10–15 kV for two westward travelling surge events.
Presented here is an analysis based on a multitude of satel-lite and ground-based observations of an intense precipi-tation event which occurred on 6 August 1998 at 22:59– 2309 UT in the evening sector at high latitude (L∼13) at the poleward edge of the poleward expanding bulge/westward travelling surge of a substorm occurring during the recovery phase of geomagnetic storm. Intensification and hardening of the precipitation occurred in a localized region. A similar event was studied and modelled by Stauning (1998) based solely on imaging riometer data and data from more than 80 polar region magnetometer stations. He concluded that pre-cipitation of magnetospheric electrons accelerated repeatedly through transient potentials of 10–30 kV was most proba-bly the cause. Also Imhof et al. (1984) have reported on a similar although less well spatially and temporally covered event. They combined ground-based riometer and magne-tometer data from a single station (South Pole) with X-ray measurements from two polar orbiting satellites at low alti-tude.
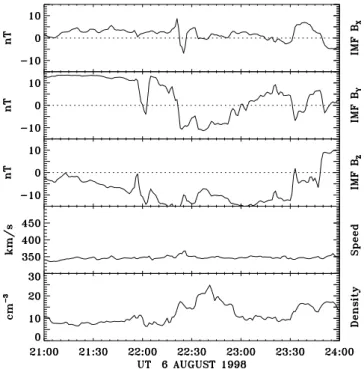
Fig. 1. Solar wind data from WIND propagated to 12 RE. A time
lag of 22 min has been applied. Panels 1–3: X, Y and Z GSM components of the interplanetary magnetic field. Panel 4: Solar wind bulk speed. Panel 5: Solar wind ion density. The spacecraft was located at (91, 11, −3 REGSE).
2 Observations
2.1 Overview
The topic of this study is a very intense precipitation event which occurred on 6 August 1998 at high latitude in the dusk sector at 22:59 UT and lasted some ten minutes. First, we will look at the magnetospheric conditions prior to the event. On 6 August 1998 a geomagnetic storm was initiated by a sudden impulse at 07:36 UT. The Dst index reached a
mini-mum of −138 nT at 12:00 UT.
IMF data from the WIND satellite are displayed in Fig. 1. A time lag of 22 min is applied to allow for propagation from the satellite to a distance of 12 RE in front of the Earth (the
approximate position of the front of the magnetopause). The WIND spacecraft was located at 91, 11, −3 REGSE and was
thus in a very good position to monitor solar wind changes that could have an impact on the magnetosphere. After more than eleven hours of strongly southward IMF a northward turning occurred at 13:00 UT and geomagnetic activity qui-eted down while the IMF stayed northward or close to zero. The IMF turned southward again at 21:15 UT, and a period of strongly negative Bz followed. Such a situation will give
rise to a high rate of dayside magnetic reconnection which will transport magnetic flux from the dayside to the night-side, eventually resulting in a highly unstable configuration of the magnetotail.
In images from the UVI and the VIS/Earth Camera on Po-lar (data not shown) emissions appeared at 22:24 UT in the
T. Christensen et al.: Conjugate High-Intensity Energetic Electron Precipitation 1445
Fig. 2. Differential electron flux from three LANL satellites in geosynchronous orbit. Solid line: 50–75 keV. Dotted line: 75–105 keV. Dashed line: 105–150 keV. Dash-dotted line: 150– 225 keV. Dash-dot-dot-dot line: 225–315 keV. Upper panel: Data from satellite 1990-095. At 22:42 UT the satellite is at 19:50 MLT. Middle panel: Data from satellite LANL-97A. At 22:47 UT the satellite is at 03:01 MLT. Lower panel: Data from satellite 1994-084. At 22:49 UT the satellite is at 05:21 MLT.
MLT midnight region coincident with a sudden, large change in IMF By and a solar wind density enhancement.
Subse-quently, the emission region drifted eastward and expanded poleward.
A much more intense event with classic substorm charac-teristics started at 22:42 UT when a particle injection was seen at geosynchronous orbit. At this time there were no significant changes in the solar wind apart from a further en-hancement in solar wind density.
Differential electron fluxes from three LANL satellites at geosynchronous orbit are shown in Fig. 2. Satellite 1990-095 situated at 19:50 MLT saw a dispersionless injection signal at 22:42 UT. The injection was seen at 22:47 UT as a dispersed signal by LANL-97A at 03:01 MLT. The electrons drifted further eastward and at 22:49 UT the dispersed signal is seen by satellite 1994-084 at 05:21 MLT. The observed drift time for the highest energy bin (225–315 keV) corresponds to 18 minutes for a full orbit around the Earth.
Satellite 1994-084 in the dawn sector registered a tem-porary flux increase in the lowest energy channels of about one minute in duration, starting about 30 s before the dis-persionless signal was seen in the early evening sector. This was accompanied by a brightening seen by UVI at 22:40:37– 22:41:13 UT close to 5 MLT at the eastern poleward edge of the eastward drifting emissions of the previous injection. In this image (not shown) no brightening in the early evening sector is seen as yet.
The Geotail satellite which was located at −9, 0.5, 0.7 RE
GSM at 22:42 UT detected the initiation of a dipolarization of the magnetic field (see Fig. 3) and at 22:44 UT an increase in energetic particle fluxes (not shown), typical signatures
Fig. 3. Magnetic field data from the Geotail satellite which was
situated at (−9, 0.5, 0.7 REGSM).
of substorm onset. The position of Geotail is close to MLT midnight, about four hours eastward of the LANL satellite 1990-095. Considering the times of the dipolarization and increased particle fluxes, as seen by Geotail, it is most likely that these observations originate from the same source that caused the injection and drift signatures seen by the LANL satellites. Classical substorm expansion and eastward drift of the emission was seen after the injection. The electrons of this injection were of much higher energy than the pre-vious precipitation, as evidenced by the bright X-ray aurora which developed. The enhanced electron flux levels seen by satellite 1990-095 at 22:53 UT does not correspond to any brightenings in either UVI or PIXIE images that are clearly distinguishable from the ongoing westward expansion.
The intense transient precipitation event which will be dis-cussed in this paper occurred in the dusk sector at 22:59 UT during the late expansion phase of the substorm. No injec-tions were detected at this time by the LANL satellites. 2.2 Data from global imagers
The Polar Ionospheric X-ray Imaging Experiment (PIXIE) (Imhof et al., 1995) on the Polar satellite was designed to provide global images of the X-ray aurora in the energy range 2–60 keV. A problem with the high-voltage supply in the front chamber which measures low-energy X-rays (2– 10 keV) meant that continuous coverage could not be pro-vided. A power duty cycle was imposed where the power was alternately on and off for a few minutes. Unfortunately, the front chamber was not operating at the time of main in-terest for this study. Hence, only data from the high-energy rear chamber is used here. The data handling procedures for these are described by Østgaard et al. (2000).
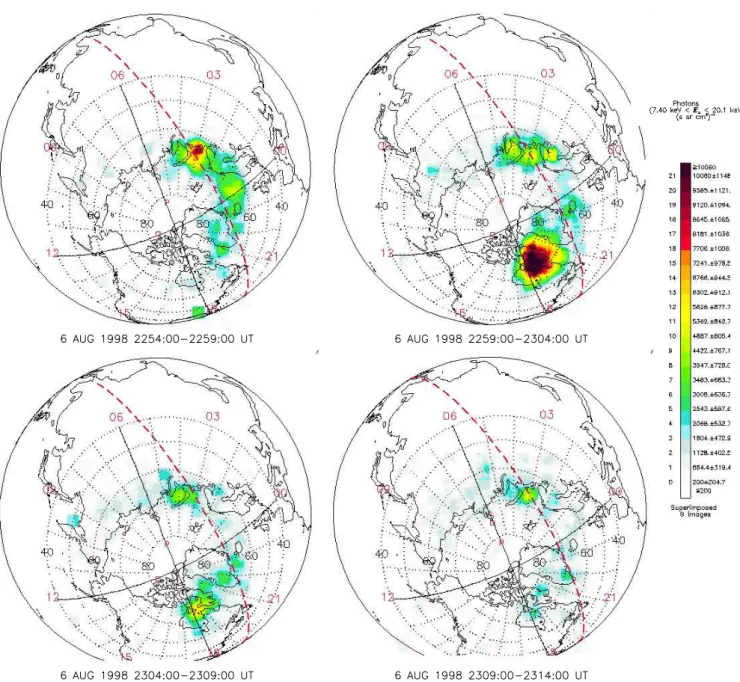
A time series of X-ray images of five-minute accumula-tion time in the energy interval 7.40–20.1 keV is displayed in Fig. 4, covering 22:54–23:14 UT on 6 August 1998. In the second image, 22:59–23:04 UT, a confined precipitation
Fig. 4. Five minute integrations of X-rays with energies in the interval 7.40–20.1 keV from PIXIE on 6 August 1998, covering 22:54–
23:14 UT. The colour scale gives the X-ray intensity in units of photons/s/sr/cm2in the energy interval. The grid shows the CGM latitude and MLT. The terminator is indicated with a dashed line.
region is seen to appear centred at approximately 74◦MLAT and 19 MLT, with an average intensity over the five-minute interval in excess of 104 photons/s/sr/cm2 in the energy in-terval. The intensity has strongly decayed in the following image, 23:04–23:09 UT, and it has almost disappeared in the last image, 23:09–23:14 UT.
The intensity of the X-ray emissions is so great that im-ages with a one-minute time resolution have been obtainable. These images (not shown) are somewhat noisy as the time resolution is pushed to the limit, but they allow for a better temporal and spatial analysis of the event. From these the onset of the event was at 22:59 UT. The precipitation was most intense at 23:00–23:04 UT, and it had faded away by
23:09 UT. In the one-minute images there is some evidence that the precipitation expanded westward and poleward from 22:59 to 23:03 UT.
Another imager on board the Polar satellite is the Ultra-violet Imager (UVI) (Torr et al., 1995). It is equipped with advanced filter technology designed to separate the observa-tions into wavelength regions that can later be combined to obtain auroral electron energy characteristics. This will be described in more detail in Sect. 3.2.
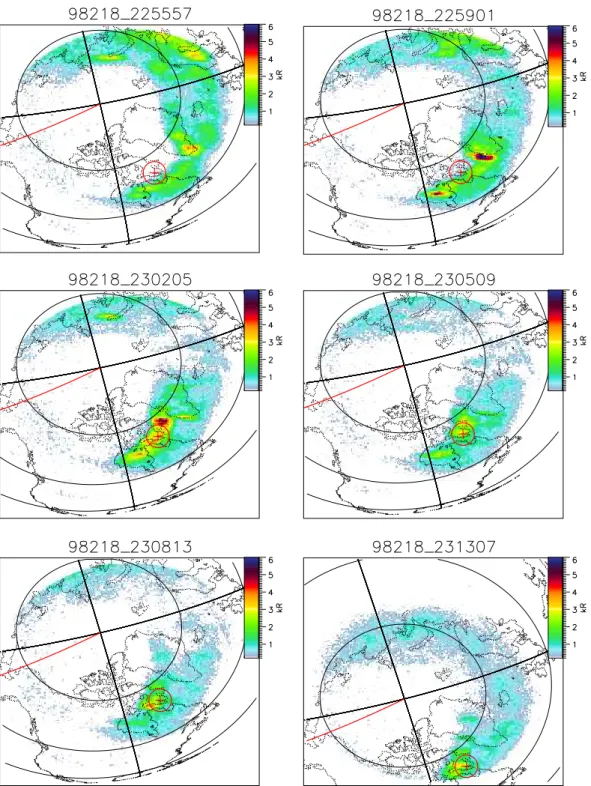
In the UVI images shown in Fig. 5 the evening-side au-roral oval is seen to expand poleward when the precipitation event occurs. The images are 36 s integrations, and the time stamp above each frame is the beginning of this time interval.
T. Christensen et al.: Conjugate High-Intensity Energetic Electron Precipitation 1447
Fig. 5. UVI images with a geographic coordinate grid showing 50◦and 70◦latitude. The images are 36 s integrations in the LBHl band with time stamps marking the beginning of this interval. The colour code gives the emission intensity. The location of Iqaluit station is marked with a red cross and a circle. The latter gives the size of the region for which spectral parameters are derived. The noon meridian is shown with a red line.
At 22:55 UT UV emissions were seen equatorward of Iqaluit (marked in the images by a red cross). The oval reached up to 71–72◦MLAT in the dusk sector (note that in Fig. 5 only geographic coordinates are indicated). At 22:59 UT the ward edge of the UV emissions had expanded slightly pole-ward and was situated immediately equatorpole-ward of Iqaluit.
By the time of the next image, at 23:02 UT, the much tensified emissions had reached the station. The event of in-tense precipitation over Iqaluit does not appear as a localized feature in the UVI images, as it does in the PIXIE images. Before 23:00 UT soft precipitation is seen at 72◦MLAT by UVI, whereas the energetic event is seen by both UVI and
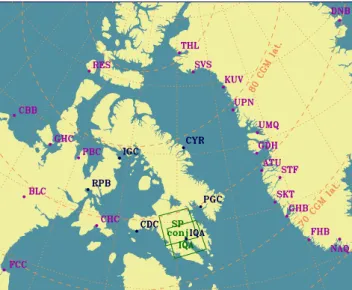
Fig. 6. Map of arctic Canada and western Greenland. Locations of
magnetometer stations are indicated with filled circles, those in dark blue provided data shown in this paper, those in violet are included for completeness. Imaging riometers are indicated with outlined squares which represent their approximate field-of-view. The con-jugate position of the South Pole (SP conj) was calculated with T96, see Sect. 3.1. Dotted lines comprise a geographic grid with 5◦ di-visions in latitude and 10◦in longitude. CGM latitude contours in dashed lines are also plotted.
PIXIE at 74–76◦MLAT. The bright poleward edge of the emissions was likely caused by more energetic electrons than those responsible for the main auroral oval.
2.3 Ground magnetometer data
Measurements of ground magnetic perturbations are an im-portant source of information about ionospheric currents. A map of magnetometer stations in arctic Canada and western Greenland is provided in Fig. 6. Magnetometer data from five stations in the Magnetometer Array for Cusp and Cleft Studies (MACCS) and from Iqaluit are shown in Fig. 7. The latter is a magnetic observatory of the Geological Survey of Canada. The data are normalized by the quiet day level, i.e the daily mean obtained for each station on a day of very low geomagnetic activity. The coordinates of these six sta-tions, plus the South Pole station are given in Table 1. All the stations recorded slowly varying southward disturbances associated with strong westward electrojet activity around 23:00 UT. The electrojet was centred on a latitude close to Igloolik and Clyde River, i.e. around 80◦ MLAT. In three stations strong disturbances are superposed on this signal: at Pangnirtung and Iqaluit negative deflections in H of 600 nT start simultaneously at 23:00 UT. These disturbances seem to be associated with a westward current, which from the variations in the vertical component occurs equatorward of the stations (in the case of Iqaluit, very close to the station), moving poleward and passing overhead. Cape Dorset sees a similar but much weaker signal, and is likely on the
west-Table 1. Coordinates of ground stations
Station Geographic CGM Name Code ◦N ◦E ◦N. ◦E Clyde River CYR 70.5 291.4 79.2 18.6 Igloolik IGC 69.3 278.2 79.1 352.5 Repulse Bay RPB 66.5 273.8 76.6 344.1 Pangnirtung PGC 66.1 294.2 74.8 20.0 Cape Dorset CDC 64.2 283.4 74.2 1.5 Iqaluit IQA 63.8 291.5 73.0 14.8 South Pole SPA -90.0 0.0 -74.0 18.9
ward edge of the energetic event. All three stations show significant changes in the eastward component as well, in-dicating that this current system is in reality more complex than the simple picture given here. A very similar signa-ture is seen in the magnetometer recordings from the South Pole (not shown), which is consistent with a westward cur-rent moving poleward over the station.
2.4 Imaging riometer data
The imaging riometers in Iqaluit and the South Pole, which are operated at 38.2 MHz, are situated at geomagnetically conjugate sites, see Table 1. A complete scan over all 49 beams is completed each second. Details of the imaging ri-ometer technique and data handling is given by Detrick and Rosenberg (1990). The field-of-view of these instruments is about 250 × 250 km at 90 km reference altitude. The lo-cations and approximate field-of-view are shown in Fig. 6, together with the magnetometer stations in Greenland and arctic Canada. For the South Pole the conjugate location was obtained using the T96 geomagnetic model (Tsyganenko, 1995), as explained in Sect. 3.1.
A time series of absorption intensity images from the imaging riometer in Iqaluit is shown in the left panel of Fig. 8, while the right panel shows the simultaneous record-ings from the conjugate station in the South Pole. The images are 12 s apart. The two conjugate recordings of the event are remarkably similar both in strength, timing and morphol-ogy of the event. In both hemispheres the energetic precip-itation formed an arc-shaped region at high latitude with a width of ∼100 km. If the absorption feature covers the field-of-view of a beam only partly, the absorption value will be underestimated. This is more likely to happen for the out-ermost beams where the ionospheric cross sections are the largest. The effect of partial beam-filling on riometer mea-surements has been discussed by Hargreaves et al. (1979) and Rosenberg et al. (1991). Due to this effect, the absorp-tion feature appears confined in longitude, but conceivably it extends beyond the field-of-view in the eastern and proba-bly also the western direction. The arc was aligned roughly along the geomagnetic east-west direction, and it had small-scale structure down to the spatial resolution of the riometer, which is a few tens of km. At 23:01:48 UT a sudden
in-T. Christensen et al.: Conjugate High-Intensity Energetic Electron Precipitation 1449
Fig. 7. Magnetometer data from six stations in arctic Canada. The data are normalized by a quiet day mean. Time is UT. Left: CGM
northward horizontal component (H). Middle: CGM eastward horizontal component (E). Right: vertically downward component (Z). The plots are arranged by geomagnetic latitude so that the top panels show data from the station furthest poleward. The time resolution is one minute for Iqaluit and five seconds for the five MACCS stations. Coordinates for the stations are given in Table 1.
Fig. 8. Time series of absorption intensity images with 12 s time steps from the two conjugate riometers in Iqaluit (left) and the South Pole
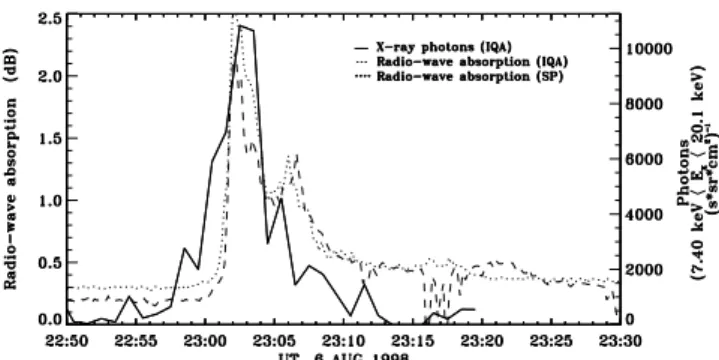
Fig. 9. Riometer data from the two conjugate stations (dashed line:
Iqaluit, dotted line: South Pole) compared with X-rays (solid line) integrated in a circle of radius 570 km over Iqaluit. The riometer field-of-view is about 250 × 250 km and the data is averaged over all 49 beams to make a fair comparison with the spatial resolution of PIXIE feasible.
tensification takes place, and in a few beams the absorption exceeds 7 dB. The most intense absorption abruptly appeared in a spatially confined region and was clearly a temporal fea-ture, not an effect of movement into the field-of-view. The arc, however, propagated poleward. The poleward edge pro-gressed across the field-of-view with an estimated velocity of 1.5 km/s, which is in agreement with velocities of polar ex-pansion of auroral absorption spikes, as reported by Nielsen (1980), and typical speeds of poleward expansion, as given by Akasofu (1964).
In Fig. 9 the PIXIE X-ray flux over Iqaluit is compared with riometer data. The X-ray flux from the PIXIE rear chamber is extracted for a circular region of radius 570 km at 100 km altitude centred on the coordinates of Iqaluit. A smaller region would have been desirable but the spatial res-olution of PIXIE was about 1000 km, with the Polar space-craft at a radial distance of 8.8 RE. The X-ray data plotted
are one-minute integrations in the circular region in the en-ergy interval 7.40–20.1 keV. For comparison the 49 beams of the imaging riometers have been averaged and plotted for the two conjugate stations.
Since the exact morphology of the absorption feature over each beam is unknown, the effect of partial beam-filling was not taken into account in the averaging of the 49 beams.
The riometer is sensitive to electrons of energies above about 10 keV, which will also give rise to bremsstrahlung X-rays in the PIXIE rear chamber energy interval. A very nice correlation between the PIXIE data over Iqaluit and the ri-ometer data is seen even though PIXIE averages over a much larger area than the imaging riometer. This supports the view that the energetic event is spatially confined to a rather small region.
3 Results
3.1 Conjugacy
The great likeness of the events seen by the two riometers in Iqaluit and South Pole leaves little doubt that the stations are geomagnetically conjugate to each other at the time of the intense high-latitude precipitation.
In CGM coordinates the conjugate point of the South Pole (74.0◦N, 18.9◦E) lies a little to the northeast of Iqaluit (see
Table 1), with the fields-of-view partly overlapping. Under very disturbed conditions, as in this case, it is necessary to determine the geomagnetically conjugate point with a more accurate magnetic field model where solar wind parameters or geomagnetic indices are used to characterize the magne-tospheric configuration. Using solar wind data from WIND and the Dst index as input for the T96 model (Tsyganenko,
1995), a more accurate calculation of the conjugate point at the time of the event is obtained. The longitudinal position is rather sensitive to the value of Bywhich varies from −10 nT
20 minutes before the event to +10 nT 20 minutes after. At 23:00 UT By =0 and the conjugate point of the South Pole
is (73.9◦N, 12.8◦E) in CGM coordinates, giving a better correspondence with the magnetic longitude of Iqaluit, but still about one degree off in both longitude and latitude. The South Pole coordinates map to the GSM equatorial plane at X = −28 RE and Y = 17 RE.
3.2 Electron energy spectrum
As previously mentioned, only X-ray measurements from the PIXIE high-energy rear chamber cover the time interval of the temporary high-intensity precipitation. Not all of the original 64 energy channels of the rear chamber are used, though. The spectrum of auroral X-rays typically decreases rapidly with energy and in the higher energy bins this causes problems with relatively high background levels and contam-ination from fluorescence. The 12 remaining useful channels may be binned into two energy intervals to obtain spectral in-formation with reasonable statistics (Østgaard et al., 2001). Without spectral information from the front chamber, how-ever, these two energy bins are not sufficient to reliably deter-mine an energy spectrum of the precipitating electrons from the X-rays.
Instead, information about the precipitating electrons is obtained from UVI data for the Northern Hemisphere and from riometer and ground-based photometer data for the Southern Hemisphere. Assumptions about fairly simple spectral shapes are necessary, however, and it can well be that the high energy part of the spectrum will be incorrectly as-sessed by a Maxwellian or exponential spectrum which falls off too quickly. When dealing with spectra over a wide en-ergy range it is often necessary to add a high enen-ergy tail, and the combination of a Maxwellian and a power law, repre-sented by the kappa distribution (Kivelson and Russell, 1995, p. 38) can be useful. Others have used a sum of two
expo-T. Christensen et al.: Conjugate High-Intensity Energetic Electron Precipitation 1451
nential functions to emulate the high energy tail (Østgaard et al., 2000, 2001).
The filters for UVI are designed so that the N2
Lyman-Birge-Hopfield band measurements are split into two parts: one at shorter wavelengths (LBHs), which is strongly af-fected by the O2 Schumann-Runge absorption continuum,
and another at longer wavelengths (LBHl), where O2
absorp-tion is less significant. The dominant excitaabsorp-tion mechanism of the forbidden N2 LBH emissions is by electron impact.
Electrons of higher energies will penetrate deeper into the atmosphere so that the emissions will occur at lower alti-tudes and thus be more susceptible to absorption as the O2
abundance increases with depth. Combining measurements from the two UVI bands allows for characterization of the electron energy spectrum for an assumed spectral form (e.g. Maxwellian), as demonstrated by Germany et al. (1997). The technique is described in further detail by Germany et al. (1994a,b)
The UVI imager alternates between the two filters, which means that the two images used to calculate the diagnos-tic emission ratio were not recorded simultaneously. This is problematic since the emissions changed on short time scales, moving rapidly poleward at the time of interest. To ensure that two images sample the same emission features a rather large spatial region is used. UVI data for a circle of radius 370 km centred on Iqaluit are extracted. Results for an assumed Maxwellian spectrum show a hardening during the intense event with a mean energy of 20 keV at 23:02 UT and 10 keV before and after this time. Also, the energy flux peaks at 23:02 UT at a value of 25 mW/m2.
For an exponential spectrum of the same mean energy and energy flux the expected directional X-ray flux can be calcu-lated using the results of Walt et al. (1979). For an electron flux of 2.68×10⁸/s/sr/cm2(as found from UVI data), a char-acteristic energy of α = 10 keV (half the mean energy) and an emission angle relative to vertically down, θγ = 140◦,
the expected directional X-ray flux at a photon energy of 14 keV is 134 /s/sr/cm2/keV. PIXIE at a zenith angle of 38.2◦ registered 900 ± 150 /s/sr/cm2/keV in the energy bin 7.40– 20.1 keV. The UVI-based electron spectral parameters may be underestimated because UVI is averaging over a large area, but still, this could be indicative of the presence of a high-energy tail of the electron spectrum that could not be detected by UVI.
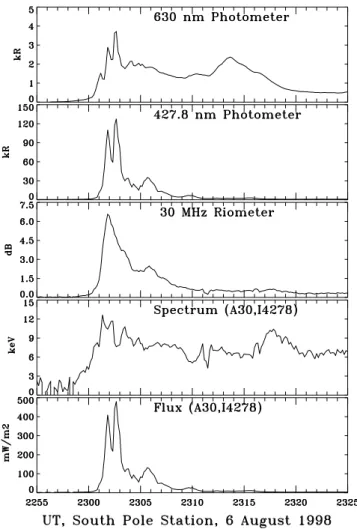
At the South Pole station there are 630.0 nm and 427.8 nm photometers and broad-beam riometers. For broad-beam ri-ometers the nominal field-of-view is often given as the beam width where the perimeter sensitivity is 3 dB lower than the maximum (zenith) sensitivity. This beam width is 55◦. The instrument will, however, give a significant response to very strong absorption events occurring just outside this field-of-view. The photometers have a field-of-view of 60◦, i.e. roughly a 50 km radius circle at 90 km altitude. Data from the two photometers and the 30 MHz broad-beam ri-ometer are shown in the first three panels of Fig. 10. The qualitative difference between the photometer data and the broad-beam riometer data is probably due to the position of
Fig. 10. Ground-based data from the South Pole and model
calcu-lations of the spectral characteristics of the precipitating electrons. Panel 1: 630 nm photometer data. Panel 2: 427.8 nm photome-ter data. Panel 3: 30 MHz broad-beam riomephotome-ter absorption inten-sity. Panel 4: Characteristic energy of the precipitating electrons obtained from a series of model calculations shown in Fig. 11. Panel 5: Energy flux of the precipitating electrons from aforementioned model calculations.
the arc just at the edge of the field-of-view of these instru-ments, as can be estimated from the imaging riometer data (see Fig. 8). Most likely, the arc is moving in and out of the photometer field-of-view, whereas the broad-beam riometer probably better approximates the actual time development of the electron precipitation changes.
The two auroral emission lines can be used to derive the characteristic energy and the total energy flux for the precip-itating electrons (Rees and Luckey, 1974; Rees and Roble, 1986). The model calculations of Rees and Luckey (1974) are made for Maxwellian electron spectra with characteristic energies between 0.3 and 10 keV. When extrapolating their results to slightly higher energies, a characteristic energy of 15 keV at 23:02 UT is derived from the auroral line ratio 630.0 nm/427.8 nm. This corresponds to a mean energy of 30 keV. Considering the rapid changes with time it is spec-ulated whether the 630 nm line is a good observable in this
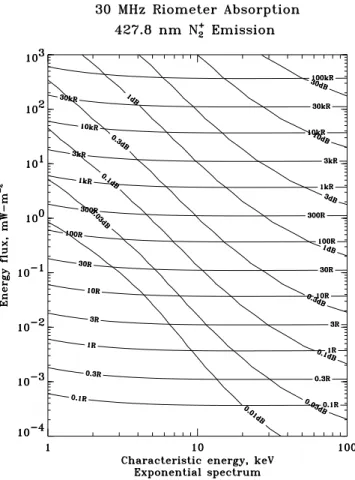
Fig. 11. Model calculations of 30 MHz broad-beam riometer
ab-sorption and 427.8 nm N+2 emission intensity as functions of total energy flux and characteristic energy for exponential electron spec-tra.
case. This atomic oxygen line is an emission from a forbid-den transition from the metastable O(1D) state which has a lifetime of about 100 s. The spectral information is, there-fore, also obtained from riometer and 427.8 nm photometer data using an extended version (a description is given by Ak-snes et al., 2002) of an original model developed by Von-drak and Baron (1976) and validated by VonVon-drak and Sears (1978). The model is based on the techniques described by Rees (1963). The code has been run for a series of input spec-tra (Maxwellian and exponential) with characteristic energies in the range 1–100 keV and total energy fluxes in the range 10−5–106mW/m2. The output is optical emission intensities
and riometer absorption values as functions of the input pa-rameters. An example is shown in Fig. 11, where 30 MHz broad-beam riometer absorption and 427.8 nm N+2 emission are shown as functions of total energy flux and characteris-tic energy for an exponential spectrum. In Fig. 10, in addi-tion to the data from the two photometers and the 30 MHz broad-beam riometer, characteristic energy and total energy flux as functions of time, as obtained from the model output tables, are shown. Calculations for an exponential spectrum give a characteristic energy of 10.5 keV and an energy flux of 400 mW/m2at the peak of the 30 MHz riometer absorption
at 23:02 UT. The 427.8 nm emission is likely to have been underestimated since the precipitation region might not fill the photometer field-of-view and in addition, tropospheric extinction of the emission has not been taken into account. This means that the derived energy flux is a minimum value. After the peak the characteristic energy is 6–8 keV for at least 15 minutes. The case for a hardening of the spectrum is somewhat weaker than for the UVI calculations, but then there are uncertainties introduced by the probable movement of the precipitation into and out of the photometer field-of-view.
The spectrum deduced from the ground-based data is rep-resentative of the small-scale electron flux at the peak of the event and is not appropriate for comparison with PIXIE’s large field-of-view.
3.3 Source of electrons
Lorentzen et al. (2000) have studied an X-ray event which oc-curred at similar MLT in the same phase of a substorm. The precipitating electrons were in that case relativistic. How-ever, since it occurred at sub-auroral latitude, a different mechanism could be invoked as the source for the energetic precipitation, namely pitch angle scattering of radiation belt electrons caused by resonance with electromagnetic ion cy-clotron mode waves. In the event of the present study there is no energetic background population to scatter, though, due to the higher latitude where electrons cannot stay trapped.
From magnetometer data in Canada, Greenland and Scan-dinavia, sector maps of ionospheric plasma drift were con-structed by plotting the horizontal perturbation vectors ro-tated 90◦ counterclockwise. The plots (not shown) cover the afternoon, evening, midnight and post-midnight sectors, from ≈14 MLT through midnight to 04 MLT. At 22:30 UT the IMF Byhas just made a rapid change from strongly
posi-tive to strongly negaposi-tive a few minutes earlier and the nearly circular dusk flow cell was starting to elongate and the centre moved equatorward. From 22:50 UT the antisunward flow across the polar cap was increasing in strength and strong electrojet flows were seen.
When the intense precipitation event occurred there were no abrupt changes in the solar wind conditions which could be thought to initiate it. The IMF By had been increasing
gradually and around 23:00 UT it became positive and might have given rise to a rearrangement of the magnetospheric configuration at a time of very strong electrojet currents and cross polar flow, i.e. strong shear at the convection reversal boundary. Ionospheric convection pattern changes were seen from 22:55 to 23:05 UT as the dusk convection cell shrank from a very elongated shape to a less pronounced one, greatly reducing the extent of the reversal boundary.
At this time Iqaluit was about 5◦latitude poleward of the convection reversal boundary, a region where strong upward field-aligned currents were very likely to occur, especially under the highly disturbed conditions prevailing. It is thus conceivable that the rearranging of the magnetospheric con-vective flows at a time of high disturbance in the system
T. Christensen et al.: Conjugate High-Intensity Energetic Electron Precipitation 1453
could give rise to a field-aligned potential drop which accel-erated precipitating electrons to the energies seen.
The very high energy flux over the South Pole at 23:02 UT of 400 mW/m2 corresponds to an electron flux of 2.3 × 10⁹/keV/s/cm2for an exponential spectrum of characteristic energy, α = 10.5 keV. The high energy flux can be explained by invoking an accelerating mechanism between the equa-torial region and the ionosphere. For high current densities of upward field-aligned currents the magnetospheric electron density is inadequate to supply the electrons needed to carry the required currents. Instabilities arise, creating large field-aligned potential drops (Knight, 1973; Baker et al., 1996).
A more detailed mechanism was suggested by Stauning (1998). It was based on modelling of a precipitation event very similar to the one studied here. The growth and de-cay of a field-aligned potential drop capable of modelling the timing and amplitude of observed absorption values was explained by a positive feedback mechanism with the large-scale ionospheric potentials. The mechanism is the follow-ing: The presence of a field-aligned potential drop associated with an intense upward current will affect the horizontal po-tential structures because of the conductivity enhancements due to the precipitating electrons. If the current is assumed constant, the ionospheric potential will decrease. This will work as a positive feedback which will raise the field-aligned potential. Alternatively, if the ionospheric potential is con-sidered constant, the currents will increase and thus, also the potential drop. The resulting upward flux of secondary and backscattered electrons will move the potential drop out-ward and it will be weakened by diffusion from the ambient plasma to the depleted acceleration region. The weakening and outward displacement of the potential will lead to an-other positive feedback where the decreasing flux of precipi-tating electrons will lead to a decrease in ionospheric conduc-tivities, which, by reversing the above arguments, will lead to further weakening of the accelerating potential drop. So the accelerating mechanism will quickly grow in strength, but by the same arguments it will also decay quickly. The timing is likely to be determined by the Alfv´en velocity, meaning that rise and decay times are likely to be of the order of a few to a few tens of seconds, assuming an altitude of 1–2 RE.
The riometer data from both Iqaluit and the South Pole show absorption peaks with FWHM (full width at half max-imum) of 10–20 s. In some beams several absorption en-hancements of 2–5 dB follow the first intense spike. These also have FWHM of 10–20 s and are separated by about 30 s. As long as field-aligned currents of unstably high density persist, a new potential drop can be created after the pre-vious has vanished. It is conceivable from the time scales involved (Stauning, 1998) that a bouncing cloud of electrons could trigger the proposed feedback mechanism repeatedly.
Another likely source for the precipitation is the effect of tail reconnection which leads to earthward bursty bulk flows with embedded flow bursts. Plasmoids and flow bursts have been shown to correlate with auroral brightenings (e.g. Fair-field et al., 1999; Nakamura et al., 2001; Ieda et al., 2001). In the case of plasmoids it is likely that the auroral
bright-enings are due to earthward flows from the reconnection site and not directly associated with the flux rope (Ieda et al., 2001). Nakamura et al. (2001) have shown that isolated flow bursts beyond 15 RE in some cases are connected with
high-latitude auroral activations occurring during the recov-ery phase of a substorm. Geotail does not, however, detect any flow burst around 23:00 UT, even though it could be considered well positioned for such observations, as it was likely to have been in the central plasma sheet. In this event, which took place after dipolarization had occurred, the re-connection region had probably retreated tailward. Thus, a flow burst might not have penetrated deep into the near-Earth magnetotail (Nakamura et al., 2001) and would not give rise to particle flux enhancements at the position of Geotail (at −9 RE) or at geosynchronous orbit, such as those reported
by Sergeev et al. (1999). A second and maybe more impor-tant point is that the spacecraft was close to midnight while the event occurred in the evening sector. The transient nature and the probably limited spatial extent of bursty bulk flows makes it likely that even if a flow burst caused the energetic precipitation event, it would not be detected by Geotail.
4 Summary and conclusions
An intense precipitation event at high latitude (L ∼ 13) is observed during the expansion phase of a substorm occur-ring on 6 August 1998 under highly disturbed conditions (Kp = 6+) in the recovery phase of a geomagnetic storm.
In images from UVI the event is seen as a brightening of the poleward edge of the poleward expanding evening-side oval. In PIXIE images the event appears isolated. The event was clearly seen in both hemispheres by two geomagneti-cally conjugate imaging riometers, and the data showed strik-ing similarities in strength, timstrik-ing and morphology of the absorption. In both hemispheres the absorption was seen as a poleward progressing arc. Within the arc a transient and spatially confined intense absorption enhancement was seen at 23:02 UT. At this time the X-ray flux peaked and so did the spectral hardness of the precipitating electrons, as de-rived separately from UVI data and from ground-based in-struments at the South Pole.
The high energy density of the precipitating electrons leads to the idea that an accelerating mechanism was in play between the equatorial plane and the ionosphere. A realis-tic model for such an accelerating potential was presented by Stauning (1998). Large-scale horizontal ionospheric poten-tial structures were suggested to be operating in a positive feedback mechanism with the field-aligned potential drops associated with strong upward field-aligned currents. The ionospheric potential structures and the field-aligned poten-tial drop are linked via the conductivity changes caused by the precipitating electrons.
Fast flows in the magnetotail have previously been shown to be closely associated with auroral brightenings, also at high latitudes (Fairfield et al., 1999; Nakamura et al., 2001; Ieda et al., 2001), and this is a very likely source for the
en-ergetic precipitation event. Geotail did not detect any fast flows, but this could be either because it was at a different longitude than the event or because it was too far earthward of the near-Earth neutral line.
Acknowledgements. Magnetometer data from MACCS and the
Canadian Magnetic Observatories were provided by Dr. W. J. Hughes. The Canadian Magnetic Observatories are operated by the Geomagnetism Unit of the Geological Survey of Canada.
WIND data were obtained from CDAWeb and provided by R. Lep-ping at NASA/GSFC (Magnetic Field Investigation) and R. Lin at UC Berkeley (3D Plasma Analyzer). LANL energetic particle data were provided by G. Reeves.
Geotail MGF (magnetic field) data were obtained from CDAWeb and provided by S. Kokubun at STELAB, Nagoya Univ., Japan. Geotail EPI (energetic particles and ion composition) data were ob-tained from CDAWeb and provided by D. Williams at APL/JHU. The final hourly Dstindex was provided by WDC-C2 for
geomag-netism, Kyoto University.
The Kpindex was provided by GFZ Potsdam via WDC-C2, Kyoto.
Corrected geomagnetic coordinates were obtained from the web pages of NASA’s National Space Science Data Center.
The work at the University of Maryland has been supported in part by National Science Foundation grants OPP9732662 and OPP0003881.
Topical Editor G. Chanteur thanks J. Stadsnes and D. Lum-merzheim for their help in evaluating this paper.
References
Akasofu, S.-I.: The development of the auroral substorm, Planet. Space Sci., 12, 273–282, 1964.
Aksnes, A., Stadsnes, J., Bjordal, J., Østgaard, N., Vondrak, R. R., Detrick, D. L., Rosenberg, T. J., Germany, G. A., and Chenette, D., Instantaneous ionospheric global conductance maps during an isolated substorm, Ann. Geophysicae, 20, 1181–1191, 2002. Angelopoulos, V., Baumjohann, W., Kennel, C. F., Coroniti, F. V.,
Kivelson, M. G., Pellat, R., Walker, R. J., L¨uhr, H., and Paschmann, G.: Bursty bulk flows in the inner central plasma sheet, J. Geophys. Res., 97, 4027–4039, 1992.
Atkinson, G.: Auroral arcs: Results of the interaction of a dynamic magnetosphere with the ionosphere, J. Geophys. Res., 75, 4746– 4755, 1970.
Baker, D. N., Pulkkinen, T. I., Angelopoulos, V., Baumjohann, W., and McPherron, R. L.: Neutral line model of substorms: Past results and present view, J. Geophys. Res., 101, 12 975–13 010, 1996.
Detrick, D. L. and Rosenberg, T. J.: A phased-array radiowave im-ager for studies of cosmic noise absorption, Radio Sci., 25, 325– 338, 1990.
Fairfield, D. H., Mukai, T., Brittnacher, M., Reeves, G. D., Kokubun, S., Parks, G. K., Nagai, T., Matsumoto, H., Hashimoto, K., Gurnett, D. A., and Yamamoto, T.: Earthward flow bursts in the inner magnetotail and their relation to auroral brightenings, AKR intensifications, geosynchronous particle in-jections and magnetic activity, J. Geophys. Res., 104, 355–370, 1999.
Germany, G. A., Torr, D. G., Richards, P. G., Torr, M. R., and John, S.: Determination of ionospheric conductivities from FUV auro-ral emissions, J. Geophys. Res., 99, 23 297–23 305, 1994a. Germany, G. A., Torr, M. R., Torr, D. G., and Richards, P. G.: Use
of FUV auroral emissions as diagnostic indicators, J. Geophys. Res., 99, 383–388, 1994b.
Germany, G. A., Parks, G. K., Brittnacher, M., Cumnock, J., Lum-merzheim, D., Spann, J. F., Chen, L., Richards, P. G., and Rich, F. J.: Remote determination of auroral energy characteristics dur-ing substorm activity, Geophys. Res. Lett., 24, 995–998, 1997. Hargreaves, J. K., Chivers, H. J. A., and Nielsen, E.: Properties of
spike events in auroral radio absorption, J. Geophys. Res., 84, 4245–4250, 1979.
Ieda, A., Fairfield, D. H., Mukai, T., Saito, Y., Kokubun, S., Liou, K., Meng, C.-I., Parks, G. K., and Brittnacher, M. J.: Plasmoid ejection and auroral brightenings, J. Geophys. Res., 106, 3845– 3857, 2001.
Imhof, W. L., Rosenberg, T. J., Lanzerotti, L. J., Reagan, J. B., Voss, H. D., Datlowe, D. W., Kilner, J. R., Gaines, E. E., Mobilia, J., and Joiner, R. G.: A coordinated satellite and gorund-based study of an intense electron precipitation spike over the southern polar cap, J. Geophys. Res., 89, 10 837–10 846, 1984.
Imhof, W. L., Spear, K. A., Hamilton, J. W., Higgins, B. R., Mur-phy, M. J., Pronko, J. G., Vondrak, R. R., McKenzie, D. L., Rice, C. J., Gorney, D. J., Roux, D. A., Williams, R. L., Stein, J. A., Bjordal, J., Stadsnes, J., Njoten, K., Rosenberg, T. J., Lutz, L., and Detrick, D.: The polar ionospheric X-ray imaging experi-ment (PIXIE), Space Sci. Rev., 71, 385–408, 1995.
Kivelson, M. G. and Russell, C. T. (Eds): Introduction to Space Physics, Cambridge University Press, Cambridge, United King-dom, 1995.
Knight, S.: Parallel electric fields, Planet. Space Sci., 21, 741–750, 1973.
Lorentzen, K. R., McCarthy, M. P., Parks, G. K., Foat, J. E., Millan, R. M., Smith, D. M., and Lin, R. P.: Precipitation of relativis-tic electrons by interaction with electromagnerelativis-tic ion cyclotron waves, J. Geophys. Res., 105, 5381–5389, 2000.
Nakamura, R., Baumjohann, W., Brittnacher, M., Sergeev, V. A., Kubyshkina, M., and Liou, K.: Flow bursts and auroral activa-tions: Onset timing and foot point location, J. Geophys. Res., 106, 10 777–10 789, 2001.
Newell, P. T.: Reconsidering the inverted-V particle signature: Rel-ative frequency of large-scale electron acceleration events, J. Geophys. Res., 105, 15 779–15 794, 2000.
Nielsen, E.: Dynamics and spatial scale of auroral absorption spikes associated with the substorm expansion phase, J. Geophys. Res., 85, 2092–2098, 1980.
Olsson, A., Eriksson, A. I., and Janhunen, P.: On the current-voltage relationship in auroral breakups and westwards-travelling surges, Ann. Geophysicae, 14, 1265–1273, 1996.
Østgaard, N., Stadsnes, J., Bjordal, J., Vondrak, R. R., Cummer, S. A., Chenette, D. L., Schulz, M., and Pronko, J. G.: Cause of the localized maximum of X-ray emission in the morning sector: A comparison with electron measurements, J. Geophys. Res., 105, 20 869–20 883, 2000.
Østgaard, N., Stadsnes, J., Bjordal, J., Germany, G. A., Vondrak, R. R., Parks, G. K., Cummer, S. A., Chenette, D. L., and Pronko, J. G.: Auroral electron distributions derived from combined UV and X-ray emissions, J. Geophys. Res. 106, 26 081–26 089, 2001.
Rees, M. H.: Auroral ionization and excitation by incident energetic electrons, Planet. Space Sci., 11, 1209–1218, 1963.
T. Christensen et al.: Conjugate High-Intensity Energetic Electron Precipitation 1455
Rees, M. H. and Luckey, D.: Auroral electron energy derived from ratio of spectroscopic emissions. 1. Model computations, J. Geo-phys. Res., 79, 5181–5186, 1974.
Rees, M. H. and Roble, R. G.: Excitation of O(1D) atoms in aurorae and emission of the [O I] 6300 ˚A line, Can. J. Phys., 64, 1608– 1613, 1986.
Rosenberg, T. J., Detrick, D. L., Venkatesan, D., and van Bavel, G.: A comparative study of imaging and broad-beam riometer measurements: The effect of spatial structure on the frequency dependence of auroral absorption, J. Geophys. Res., 96, 17 793– 17 803, 1991.
Sergeev, V. A., Liou, K., Meng, C.-I., Newell, P. T., Brittnacher, M., Parks, G., and Reeves, G. D.: Development of auroral stream-ers in association with localized impulsive injections to the inner magnetotail, Geophys. Res. Lett., 26, 417–420, 1999.
Stauning, P.: Substorm modeling based on observations of an in-tense high-latitude absorption surge event, J. Geophys. Res., 103, 26 433–26 452, 1998.
Torr, M. R., Torr, D. G., Zukic, M., Johnson, R. B., Ajello, J., Banks, P., Clark, K., Cole, K., Keffer, C., Parks, G., Tsurutani, B., and Spann, J.: A far ultraviolet imager for the international solar-terrestrial physics mission, Space Sci. Rev., 71, 329–383, 1995.
Tsyganenko, N. A.: Modeling the Earth’s magnetospheric magnetic field confined within a realistic magnetopause, J. Geophys. Res., 100, 5599–5612, 1995.
Vondrak, R. R. and Baron, M. J.: Radar measurements of the lati-tudinal variation of auroral ionization, Radio Sci., 11, 939–946, 1976.
Vondrak, R. R. and Sears, R. D.: Comparison of incoherent scatter radar and photometric measurements of the energy distribution of auroral electrons, J. Geophys. Res., 83, 1665–1667, 1978. Walt, M., Newkirk, L. L., and Francis, W. E.: Bremsstrahlung
pro-duced by precipitating electrons, J. Geophys. Res., 84, 967–973, 1979.