EFFECT OF APPLIED PRESSURES ON THE RADON CHARACTERISTICS OF AN UNDERGROUND MINE ENVIRONMENT
by
Gerald Lawrence Schroeder
S.B., Massachusetts Institute of Technology . (1959)
M.S., Massachusetts Institute of Technology (1961)
SUBMITTED IN PARTIAL FULFILLMENT OF THE
REQUIREMENTS FOR THE DEGREE OF DOCTOR OF PHILOSOPHY
at the
MASSACHUSETTS INSTITUTE OF TECHNOLOGY January, 1966
Signature of Author
Certified by
Certified by
Accepted by
Department of Geology and Geophysics, 11 January 1965
Thesis Supervisor
Thesis Co-Supervisor
Chai an, Ddpartmental Committee on Graduate Students
sS, INST. T LiBRARY
EFFECT OF APPLIED PRESSURES ON THE RADON CHARACTERISTICS OF AN UNDERGROUND MINE ENVIRONMENT
by
Gerald Lawrence Schroeder
Submitted to the Department of Geology and Geophysics on 11 January 1965 in partial-fulfillment of the requirement for the degree of Doctor of Philosophy.
ABSTRACT
Investigations were conducted at two underground locations, foreman's room and 5702 area, of the Kermac Nuclear Fuels Corp. uranium mining installation, Ambrosia Lake, New Mexico. The rock environment is stratified sandstone. Pressures were var-ied from -0.4 cm Hg to +3.8 cm Hg with respect to barometric pressure, and were maintained for periods ranging from several hours to 21 days. Variables measured were: room air radon-222
(Rn) and Rn daughter-product concentrations, humidity, tempera-ture, interstitial Rn concentrations at depths to 15 ft. within rock, and air consumption required to maintain the chosen over-pressure.
Reduction of the flux of Rn from adjacent rock into the mine during overpressure is sizable. One cm Hg overpressure
(~,,1.5% of normal barometric pressure) produced a 20-fold decrease in Rn flux into the foreman's room as compared to the Rn flux observed during dilution ventilation. The 5702 area experienced a 5-fold decrease in Rn flux for a similar overpressure. Dur-ing 21 days of continuous 1 cm Hg overpressure in the 5702 area this reduced Rn flux was maintained. The smaller reduction in flux for the 5702 area results in part from the proximity of the foreman's room to a non-pressured area and the presence of a shale lens overlying the ceiling of the 5702 area. A 0.4 cm Hg underpressure of the 5702 area increased the Rn flux into the area by 3-fold over the non-pressured value.
A barometric pressure influence on Rn flux into the mine and on air Rn concentrations in non-pressured areas of the mine was measured. A falling barometric pressure causes an increase in the flux of interstitial gas into the mine; a rising baro-metric pressure decreases this flux. These effects are not seen in overpressured mine areas.
In the 5702 area, during dilution ventilation, the ratio of activities of air-suspended Rn daughter products to Rn is 50% of the equilibrium value. During overpressure this ratio is reduced to 25%.
Radon concentrations in rock interstices show, during overpressure, decreases at all locations monitored except in the immediate vicinity of the shale lens above the 5702 area ceiling. These reductions are the result of air flowing from the mine into the rock.interstices under the influence of the pressure gradient induced by the overpressure.
The relative humidity of the 5702.area was reduced after 2 days of 1 cm Hg overpressure from a pre-overpressure value
of 96% to 81%.
A theoretical treatment of convection and counter diffusion of miscible compressible fluids moving through an anisotropic porous medium is presented. This leads to an analytic
expres-sion for the distribution of Rn within the interstices of a stratified sandstone surrounding an overpressured area. When measured permeabilities and observed interstitial pressure gradients are introduced into this expression the results are
in good agreement with the Rn concentrations observed during overpressure.
Thesis Supervisor: Robley D. Evans
Title: Professor of Physics
Thesis Co-Supervisor: John W. Winchester
TABLE OF CONTENTS Page Abstract 2 List of Figures 6 List of Tables 10 1. Introduction 14 2. Experimental Installations 17 3. Experimental Procedure 25 4. Experiments 29
5. Empirical Results and Interpretation 30
a. Radon Concentrations in Interstitial Gas 32
b. Radon Flux 50
c. Room Air Radon Concentrations 55
d. Radon Daughter-Product Working Levels and
Radon-Radon Daughter-Product Disequilibria 60
e. Temperature, Relative Humidity, and Moisture 62
6. Analytic Description of Interstitial Radon
Concentrations During Mine Overpressure 64
7. Bibliography 79
APPENDIX
8. Experimental Installations 82
9. Experiments 88
10. Radon Concentrations in Interstitial Gas 93
11. Radon Flux Measurements 105
5
Page13. Diffusion Coefficient of Radon in Sandstone 121
14. Permeability of Test Site Environment 124
15. Permeability of the Mathematically Transformed
Mine Environment 128
16. Comparison of Observed and Predicted Rates of
Air Consumption in the Foreman's Room 130
17. Theoretical Description of Interstitial Radon
Concentrations in Rock Adjacent to a Mine Tunnel
During Non-pressure Conditions 135
18. Derivation of Equation (24), an Analytic
Description of Interstitial Radon Concentrations
in Rock Surrounding an Overpressured Area 140
19. Determination of Interstitial Radon Production
Rate in Rocks for Low and High Interstitial
Radon Concentrations 146
20. Radon and Radium in Mine Recycle Waters 149
21. Bibliography to the Appendix 157
ACKNOWLEDGEMENTS 158
6
LIST OF FIGURES
FIGURE PAGE
1 Plan View of Sampling Installation Foreman's
Room 18
2 Plan View of 5702 Test Area 19
3 Profile of Sampling Sites in Drift of 5702
Test Area 21
4 Interstitial Radon Concentration for
Pre-overpressure Periods and for 0.9 cm Hg
Overpressure vs. Depth, Foreman's Room 34
5 Interstitial Radon Concentration vs. Time,
Varied Overpressure Test, Foreman's Room 35
6 Interstitial Radon Concentration vs. Time,
3.8 cm Hg Overpressure Test, Foreman's Room 37
7 Interstitial Radon Concentration vs. Depth
Parallel to Bedding, 21 day overpressure
test, 5702 area 40
8 Interstitial Radon Concentration vs. Depth
Perpendicular to Bedding, 21 day
over-pressure test, 5702 area 41
9 Interstitial Radon Concentration vs. Depth,
21 day overpressure test, 5702 area 42
10 Pressure Difference Between Sampling Probe
and Test Area vs. Depth, 21 day overpressure
test, 5702 area 44
11 Pressure Difference Between Sampling Probe
and Test Area vs. Depth, underpressure
test, 5702 area 47
12 Total Radon Flux into Foreman's Room vs.
Applied Overpressure 51
13 Total Radon Flux into 5702 Area vs. 5702
Area Pressure Relative to Local Barometric
FIGURE PAGE
14 Comparison of Observed and Predicted
Inter-stitial Radon Concentrations vs. Depth,
0.9 cm Hg Overpressure, Foreman's Room 75
15 Comparison of Observed and Predicted
Inter-stitial Radon Concentrations vs. Depth,
1.4 cm Hg Overpressure Foreman's Room 76
16 Plan View of Sampling Installation at
Foreman's Room 83
17 Profile of Sampling Installation, Foreman's
Room 84
18 Plan View of Sampling Sites in Drift of 5702
Test Area 85
19 Profile of Sampling Sites in Stope of 5702
Test Area 86
20 Interstitial Radon Concentration vs. Time,
21 day overpressure test, 5702 area 94
21 Interstitial Radon Concentration vs. Time,
21 day overpressure test, 5702 area 95
22 Interstitial Radon Concentration vs. Time,
21 day overpressure test, 5702 area 96
23 Interstitial Radon Concentration vs. Time,
21 day overpressure test, 5702 area 97
24 Interstitial Radon Concentration vs. Time,
21 day overpressure test, 5702 area 98
25 Interstitial Radon Concentration vs. Time,
underpressure experiment, 5702 area 100
26 Interstitial Radon Concentration vs. Time,
underpressure experiment, 5702 area 101
27 Interstitial Radon Concentration vs. Time,
8
FIGURE PAGE
28 Room Air Radon Concentration vs. Time,
varied overpressure test, foreman's room 109
29 Room Air Radon Concentration vs. Time,
21 day overpressure test, 5702 area 110
30 Room Air Radon and Radon Daughter-product
Concentrations During Stated Air Dilution
Conditions vs. Time, 5702 Area 111
31 Room Air Radon and Radon Daughter-product
Concentrations During Stated Overpressure
Conditions vs. Time, 5702 Area 113
32 Room Air Radon and Radon Daughter-product
Concentration vs. Time, underpressure
experiment, 5702 area 114
33 Barometric Pressure at Grants, New Mexico,
vs. Time 116
34 Air Radon Concentration for Stated Dilution
and Overpressure Conditions vs. Time,
5702 area 117
35 Radon Diffusion Coefficient (D) as Predicted
from Interstitial Radon Concentration Gradient (dc/dx) in Bulk Rock and Observed Radon
Flux (J) Across Total Rock Surface vs.
Over-pressure, Foreman's Room 122
36 Apparatus for Determination of Permeability
of Rock Samples 125
37 Pressure Difference Between Sampling Probe
and Test Area for Stated Overpressure vs.
Depth, Foreman's Room 131
38 Approximation of the Profile of Foreman's
Room 132
39 Observed and Predicted Air Input Rate to
Foreman's Room During Overpressure vs.
FIGURE PAGE
40 Theoretically Predicted Interstitial
Concen-trations in Rock Surrounding a 10 Foot
Diameter Tunnel and Interstitial Radon Con-centrations Observed in Rock Adjacent to
Foreman's Room vs. Depth; Normal Pressure 138
2 l
41 Solutions of D C - gdiv(VC) + - C = 0
S
using Stated Parameters 143
2 1
42 Solutions of D 72C -
Adiv(VC)
+ p - kC = 0and- 'div(VC) +(P - SC = 0 145
S,
43 Apparent Interstitial Radon Production Rate
as Determined by Purging vs. Pressure
Differential Across Rock Sample 148
44 Plan View of Water and Air Sampling Area,
20 September 1963 150
45 Radon Content of Water vs. Distance of Flow in
Drift 151
46 Dissolved Radium Content of Water vs. Distance
of Flow in Drift 151
47 Radon Concentration in Air vs. Distance from
End of 09 Drift 152
48 Plan View of Water and Air Sampling Area, 57
10
LIST OF TABLES
TABLE PAGE
l Effect of Applied Pressures on Radon
Characteristics of 5702 Area 58
2 Sampling Probes in Foreman's Room, June 1963 87
3 Permeability of Sandstones from Foreman's
Room and 5702 Area 127
4 Values of E: Ratio of Interstitial Radon
Production Rate in Low Radon Atmosphere to Interstitial Production Rate in High Radon
l1i*
The following text through section 7 is to be submitted for publication.
1.2
EFFECT OF APPLIED PRESSURES ON THE RADON CHARACTERISTICS OF AN UNDERGROUND MINE ENVIRONMENT
by
Gerald L. Schroeder and Robley D. Evans ABSTRACT
Investigations were conducted at two underground locations, foreman's room and 5702 area, of the Kermac Nuclear Fuels Corp. uranium mining installation, Ambrosia Lake, New Mexico. The rock environment is stratified sandstone. Pressures were var-ied from -0.4 cm Hg to +3.8 cm Hg with respect to barometric pressure, and were maintained for periods ranging from several hours to 21 days. Variables measured were: room air radon-222
(Rn) and Rn daughter-product concentrations, humidity, tempera-ture, interstitial Rn concentrations at depths to 15 ft. within rock, and air consumption required to maintain the chosen over-pressure.
Reduction of the flux of Rn from adjacent rock into the mine during overpressure is sizable. One cm Hg overpressure
(~.,1.5% of normal barometric pressure) produced a 20-fold decrease in Rn flux into the foreman's room as compared to the Rn flux observed during dilution ventilation. The 5702 area experienced a 5-fold decrease in Rn flux for a similar overpressure. Dur-ing 21 days of continuous 1 cm Hg overpressure in the 5702 area this reduced Rn flux was maintained. The smaller reduction in flux for the 5702 area results in part from the proximity of the foreman's room to a non-pressured area and the presence of a shale lens overlying the ceiling of the 5702 area. A 0.4 cm Hg underpressure of the 5702 area increased the Rn flux into the area by 3-fold over the non-pressured value.
A barometric pressure influence on Rn flux into the mine and on air Rn concentrations in non-pressured areas of the mine was measured. A falling barometric pressure causes an increase
in the flux of interstitial gas into the mine; a rising baro-metric pressure decreases this flux. These effects are not seen in overpressured mine areas.
In the 5702 area, during dilution ventilation, the ratio of activities of air-suspended Rn daughter products to Rn is 50% of the equilibrium value. During overpressure this ratio is reduced to 25%.
13
Radon concentrations in rock interstices show, during overpressure, decreases at all locations monitored except in the immediate vicinity of the shale lens above the 5702 area ceiling. These reductions are the result of air flowing from the mine into the rock interstices under the influence of the pressure gradient induced by the overpressure.
The relative humidity of the 5702 area was reduced after 2 days of 1 cm Hg overpressure from a pre-overpressure value of 96% to 81%.
A theoretical treatment of convection and counter diffusion of miscible compressible fluids moving through an anisotropic porous medium is presented. This leads to an analytic expres-sion for the distribution of Rn within the interstices of a stratified sandstone surrounding an overpressured area. When measured permeabilities and observed interstitial pressure gradients are introduced into this expression the results are
in good agreement with the Rn concentrations observed during overpressure.
(4
1. Introduction
The control of harmful or noisesome gases which emanate into underground mining areas from surrounding rocks is often a costly necessity. In uranium (U) mines this problem is
presented by the high interstitial concentrations of radon-222 (Rn), a radioactive noble gas of 3.82-day half-period, formed in the decay scheme of U 238, and the relative ease with which this noble gas diffuses from its parent rock into the inter-stices of the rock and then to a working area. Long-term exposure to moderate concentrations of Rn (3000 ppc/l) and its short-lived alpha-ray emitting daughter products, RaA
(Po 218) and RaC' (Po 214), has been found to result in an increased incidence of bronchial carcinoma (C-1). The ac-ceptable limit of Rn daughter products in a mine atmosphere is presently set at a concentration of short-lived radon daughters which would be in equilibrium with 100 ppc of Rn/l, of air.
Ventilation of mines is conventionally accomplished by continuously diluting the mine air with fresh air brought in by fan or natural convection from above ground surface. The
diluted air is allowed to vent freely to the atmosphere. This process does nothing to retard the rate at which gases (includ-ing Rn) diffuse into the mine from surround(includ-ing rock. It merely reduces the concentrations of these gases within the mine.
15
It is suggested that in a sufficiently permeable rock environment a slight pressurization of the mine air may induce
air flow from the mine into the interstices of rock surrounding the mine. This convective flow of comparatively fresh air will reduce the concentration and the concentration gradient of
undesirable gases in the rock interstices adjacent to the mine and hence reduce the flux of these gases into the mine.
An investigation into the effect which applied pressures have upon the Rn characteristics of a mine atmosphere has
been in progress at the Kermac Nuclear Fuels Corp. uranium mines, Ambrosia Lake (near Grants), New Mexico, since June 1963. In rock interstices adjacent to the mine and in the mine atmosphere the rate, magnitude, and duration of induced changes in Rn concentration were measured for pressures ranging from -0.4 cm Hg (-2.1 in. water gauge) to 3.8cm Hg (20.0 in.
water gauge) with periods of continuous pressurization varying from 1 day to 21 days. During the tests, humidity in the mine atmosphere, transmitted pressures in the interstices of the adjacent rock, and air consumption required to maintain the desired pressure were also recorded.
Results were intended, in part, to indicate whether an overpressure of several cm Hg in an underground area would reduce the Rn flux into a mine sufficiently to warrant further
16
investigation into the practicality of this technique as amethod of general mine ventilation. Monitoring of Rn concen-trations and transmitted overpressures in the interstices of adjacent rock allows a comparison of these values with theo-retical predictions, and aids in the understanding' of the changes observed in the mine atmosphere.
Analytically, the overpressure problem is one of miscible displacement by compressible fluids flowing through an aniso-tropic porous medium: moderately pressurized air from the mine flows into a layered sedimentary rock and convectively displaces part of the Rn-rich interstitial gas. Radon diffuses counter-current to this convective flow at a rate proportional to its concentration gradient. In time,a steady state of con-vection and counter diffusion is established. The Rn flux
into the mine is never reduced to zero, and only asymptotically approaches zero as the overpressure (and hence the convective velocity of purging air) approaches infinity.
Radon concentrations during overpressure are described mathematically by a steady-state form of Fick's second law
of diffusion taking into account Rn production from radium (Ra226) in the rock and Rn decay, with an additional term to account for the convective displacement of the gases.
2. Experimental Installations
Two locations in the Kermac mines were used: an abandoned foreman's lunch room (referred to as the foreman's room),
mine section 24, 1-4 level, and an area consisting of a stope and adjoining drifts off 57 drift 02 raise (referred to as the 5702 area), mine section 26. The areas are approximately 800 feet and 600 feet below ground level, respectively, and are remote from present mining operations.
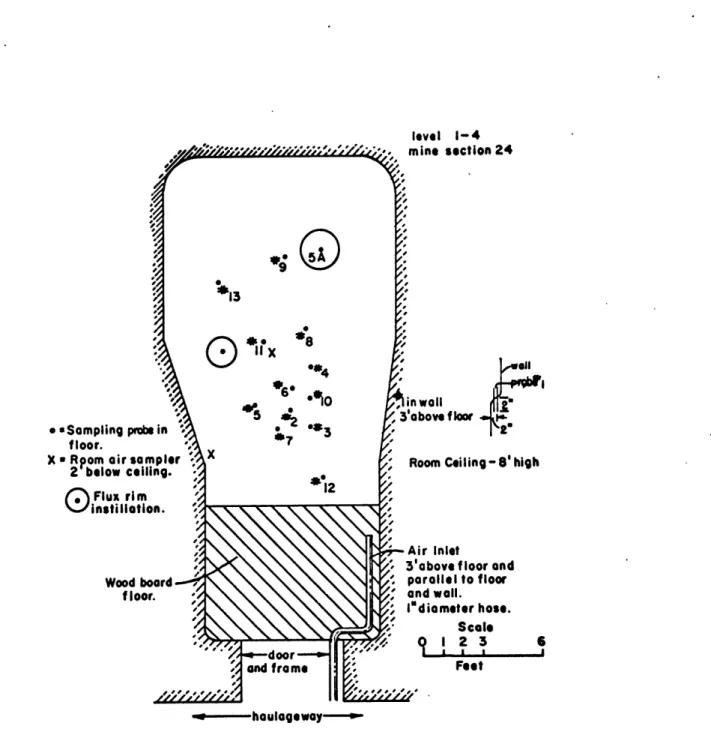
Figure 1 shows the foreman's room in plan. Probes for sampling interstitial gas are indicated in the figure. They are from an experiment performed here. The probes are located in the ribs and floor of the room. The room is nominally
25 ft. long, 9-12 ft. wide and 8 ft. high, with a surface area of about 1100 sq. ft. and volume of about 2100 cu.ft. It is cut into the wall of a main haulageway. The rock surfaces are free of major obstructions to the passage of Rn. The environ-ment is a moist, soft, stratified, uranium-bearing sandstone of low grade and of moderate permeability (14 x 10~9 cm2 per-pendicular to, and 22 x 10~9 cm2 parallel to stratificationsl. Stratifications are approximately horizontal. The floor is covered with 1-2 ft. of crushed, packed sandstone.
Figure 2 shows the 5702 area in plan. This area offers the opportunity of working with typical.mining geometries
Level 1-4
©6
Level 1-4 mine section wood board haulageway Walls of roomO
Indicates sampling location and probe numberPlan view of room and sonpling probes
Air inlet 3 above floor and parallel to floor and wall;I"diameter hose ; 0 1 2 3 6 Scale feet
FIGURE 1. PLAN VIEW OF SAMPLING INSTALLATION FOREMAN'S ROOM
Legend
N I Consolidated rock
Bulkhead (foam-covered wood)
Q
Height of area at indicated location 7 RaiseSurface area of test area 20,000 ft.2 Volume of test area 150,000 ft3 Elevation of shaft collar 7000ft. Elevation of prof ile (A)(floor) 6386f t.
Grade of ore removed 0.17% U308
Surrounding rock 0.05% to 0.10% U308
20
including stopes, drifts, and enclosed pillars. Nominally the surface area of -5702 area is 20,000 sq. ft. and the volume is 150,000 cu. ft. Interstitial gas sampling probes are located in the vicinity of areas A, B, C, Fig. 2. The environment is stratified sandstone of fair-to-high grade ore and is not
completely mined out. Permeability of the rock is not uniform; a representative permeability is about 55 x 10~9 cm2 parallel to and 33 x 10~9 cm2 perpendicular to stratifications. Strati-fications are approximately horizontal. In a section of the stope ceiling a portion of a shale lens was visible. Mine geologists stated that this lens was no more than several feet
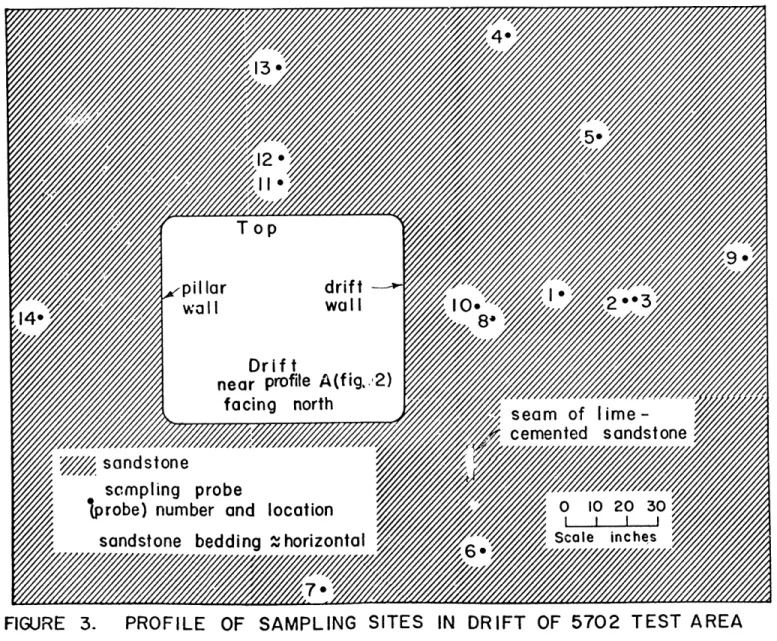
in thickness. Water dripped from much of the stope ceiling in the vicinity of the exposed shale prior to the application of overpressure. Several test holes drilled into the drift ceiling near profile A (Fig. 2) produced water at the rate of a very slow drip. Relative humidity was 96% prior to overpressure. Figure 3 shows, in profile, a portion of the drift near profile A, Fig. 2. Location of sampling probes are indicated in Fig.3.
During overpressure experiments, the outer ring of the 5702 area (Fig. 2) was maintained, by separate air supply, at a pressure close to that of the test area. This ensured that all air utilized in the test area passed into the rock of the area and did not leak out around the inner bulkhead air seals.
sandstone bedding -"horizontal
This precaution was taken since a significant portion of the air consumed in the foreman's room during overpressure experi-ments was believed to have left the room through the rock
immediately surrounding the sealed door to the room. All bulkheads were constructed of a rigid plastic foam sprayed
over wood.
Probes for sampling room air were mounted at two locations in each test area. Pitot tubes, used to estimate the volume rate of air input to the test area, were mounted within the air input hoses, 8 in. to 12 in. from the exhaust end of these hoses.
In both test areas, probes for sampling interstitial gas were placed in several directions with respect to the bedding planes in order to investigate effects which rock
stratifi-cations have on final Rn concentrations. These same probes were also used to measure overpressures transmitted from the test area into the interstices of the sandstone.
Although spatial location of the sampling probes is varied with respect to the mine test areas, their installation was similar in all cases and was as follows: using an air-driven 3/4 to 1 in. dia.star drill, holes were drilled into the rock at selected sites. Holes in the foreman's room were drilled with the aid of water; holes in the 5702 area were drilled
dry. At each location a length of standard 3/1, in. OD (1/8 in. OD for holes less than 6 in. deep), 0.030 in. wall, copper tubing, 5 in. longer than the hole depth, served as the primary
sampling probe. A tuft of glass wool which acted as a filter was fixed over the opening of one end of the copper tube; this end was inserted into the drilled hole. A 2 in. ball of crum-pled paper, glass wool, or powdered sandstone was then packed into the hole to insulate the sampling end of the tubing from the subsequent sealant. A 1 in. plug of hardening sealant
(e.g., expanding cement) was tamped into the hole and allowed to set. The hole was filled with a nonporous sealant [e.g., epoxy, common nonhardening roofing tar, water-emulsified asbestos]. In the case of holes where the sealant could not flow into the hole under force of gravity the sealant was forced in using a plunger arrangement similar to a grease gun with an extended greasing hose.
Lengths of 3/16 in. OD copper tubing were attached by short pieces of rubber pressure tubing to the test probes and pitot tubes and were strung from the holes through the wooden frames of the bulkheads which isolate the test area. This allowed sampling of interstitial gas, room air, and pressures without disturbing the areas. Differential manometers, oil
24
difference between the test area and the immediately adjacent unpressurized area.
Interstitial gas and room air samples were taken in 1-liter glass flasks. For sampling, a previously evacuated flask was
attached by a short rubber tube to the selected sampling probe. The connecting valves were opened and the liter of gas was
25
3. Experimental Procedure
The exact program of each experiment is unique; however, the general pattern of sampling and data recording was similar in all cases.
Prior to the start of each experiment the test area was left unventilated for several days. The bulkheads were usually sealed. Two complete pre-experiment sets of interstitial gas and air samples were taken with a several-hour interval between the sets, the second set being taken shortly before commencing air input. With the start of an experiment, the desired pres-sure or air volume input rate was established as rapidly as possible, usually in a matter of minutes. This condition was then maintained, within conventional mine operational limits, for the duration of the experiment. During the course of an experiment, the applied parameter (e.q., volume rate of air input) rarely varied from the desired value by more than 10 percent.
Air was supplied from the mine compressed-air system except as noted. Interstitial gas and room air samples, and pressure readings in the adjacent rock, were taken at inter-vals dependent upon the specific nature of the experiment. Occasionally the 5702 test area was entered during experiments
concentrations. Since the outer ring formed an air-lock these entries caused only slight perturbations in the pressure con-ditions of the area.
All gas samples were shipped in the 1-liter sampling flasks via Continental Trailways bus or Railway Express.from Grants to Albuquerque. A transfer agent delivered the samples to the airport from which they were sent air express to the M.I.T. Radioactivity Center. Radon analyses of these samples
were performed using y-ray spectroscopy with a 4 in. x 4 in. NaI(Tl) crystal in a low background facility, or by a-ray counting with a ZnS(Ag)-coated scintillation chamber. Nor-mally each sample was analyzed twice.
When using the NaI(Tl) crystal for analysis, activity of the 0.61 Mev y ray of RaC (Bi2 14) was measured. One-liter gas samples containing greater than 105 Lic of Rn could readily be analyzed in this manner by presenting the sample, in its
flask, to the crystal. The Rn content of a sample was deter-mined by comparing the measured activity of the sample with the measured activity of a known amount of Rn in equilibrium with its daughter products. The Rn standard, contained in a routine glass sampling flask, was placed before the crystal in the same position as a gas sample. The Rn standard was obtained by deemanating a 0.2 x 10⁻⁶ c Ra2 2 6 standard into
27
the sampling flask when the Rn in the standard was in near-equilibrium with the Ra. Aged nitrogen was used for the deema-nation.
For samples containing less than 105 ppc Rn/l ZnS(Ag)-coated chambers (K-2) were used. This apparatus consists of a 0.5-liter lucite cylinder, coated on all internal surfaces with ZnS(Ag). A 5 in. photomultiplier tube views each of the two end plates. The PM tube signals are summed and fed into a cathode follower, then to an amplifier and discriminator, and finally to a scaler. To analyze a gas sample, the ZnS(Ag) chamber was evacuated and the one-liter gas sample was shared with this 0.5 liter chamber volume. Hence, about 1/3 of the sample entered the chamber. The portion of sample remaining in the flask was saved for a second analysis. For calibration,
-9 226
a 10 c NBS Ra standard was deemanated into a sampling flask. This known amount of Rn was then shared with the ZnS
(Ag) chamber following the same procedure as in the routine analysis of a gas sample and the activity was monitored. Samples having Rn concentrations of about 105 Vc/l were oc-casionally analyzed on both units to provide a cross-check on the calibrations.
Analysis of concentration of air-suspended Rn daughter products was performed at the mine by Mr. William Lane of
28
Kermac. A known quantity of air, between 10 and 30 cu. ft.,was drawn through a membrane filter (e.g., Gelman AM-4). The alpha activity retained on the surface of this filter was measured and, knowing the time that had passed since the
sample was taken, this activity was extrapolated to a concen-tration at the time of sampling. In this case one must assume a relative ratio of the short-lived Rn daughters, RaA (Po2 1 8),
21 214 214
RaB (Pb2 1 4), RaC (Bi ), RaC (Po ), present at time of sampling. The procedure has been described by D.A. Holaday
29
4. Experiments
It was necessary first to learn whether overpressure could reduce the Rn flux into a chosen mine for periods of at least several days and then to determine empirically the quantitative relationship between Rn flux and amount of mine overpressure.
Initial experiments were performed in the foreman's room. These included 68 hours of continual 3.3 to 3.8 cm Hg over-pressure, direct measurements of Rn flux through the foreman's room floor into the test area prior to and after overpressure
(for this a previously developed flux can, was used; it is described in t-2), and an incremental variation of overpressure
from 0.5 cm Hg to 3 cm Hg with each chosen pressure maintained for a 24 hour period.
Subsequent experiments were carried out in the 5702 area. These included 21 days of continual overpressure at 1 cm Hg, overpressure at 0.6 cm Hg for several days, ventilation of the test area by dilution only (i.e., no overpressure) and by
overpressure combined with dilution, and finally, an under-pressuring of the area. The underpressure test was to demon-strate the effect which a slight vacuum in a mine has upon the Rn characteristics of the mine. The results are of interest since mines are often ventilated by having an exhaust fan vent air from the mine and allowing fresh air, under the influence of the vacuum created by the exhaust fan, to enter the mine at another shaft.
30
5. Empirical Results and InterpretationThe results of all experiments related to this investi-gation of overpressure as a means of mine ventilation confirm
the initial suppositions on which the project was based: mod-erate pressurization of the mine areas studied does induce a
flow of air from the mine into the interstices of the surrounding rock; this flow of relatively fresh air purges and hence reduces the Rn concentration and concentration gradient in the inter-stices of rock adjacent to the pressurized area; such a reduction lowers the Rn flux into the mine. Since less Rn enters the
mine area during overpressure, the amount of dilution air needed to attain a given Rn concentration in the mine atmosphere is less than that required with simple dilution techniques of ventilation. Underpressure does induce a convective flow of interstitial gas into the underpressured area. This flow results in a significant increase of the Rn flux into the mine.
Figures 12 and 13, (section 5b), and Table 1, (section 5c), present the essence of the effects which applied pressures have on the Rn and Rn daughter-product concentrations of the mine environments studied. Figures 12 and 13 describe as a
function of applied pressure the Rn flux into the foreman's room and the 5702 area respectively. Figure 13 includes data for under- and overpressures. In both test areas, the sharp decrease in flux during overpressure as compared with zero
31
applied pressure is evident. The difference in the absolute magnitude of decrease in the flux between the foreman's room and the 5702 area, for a given overpressure, is attributable in part to the proximity of the foreman's room to a non-pres-sured haulageway and the presence of a shale lens overlying much of the 5702 area. For small applied pressures, under-pressuring an area seems to increase the Rn flux as readily
as overpressure decreases it (Fig. 13). Table 1 demonstrates the air economy of overpressure in the 5702 area. Using
130 ft 3/min. total rate of air change, the air Rn concentration at zero applied pressure is 6 times the air Rn concentration observed when 130 ft 3/min. air is supplied at 1 cm Hg over-pressure. The air-suspended Rn daughter-product concentration during these 1 cm Hg overpressure conditions is 10 times lower than during zero applied pressure, 130 ft 3/min. air change
rate. The larger decrease in Rn daughter-product concentration than Rn during overpressure is possibly the result of the
daughters being carried convectively to the mine walls by the purging air as it enters the mine walls.
Error limits have not been assigned to the data because of uncertainties of precision and accuracy inherent in field investigations in which sample analysis.is performed a great distance from the sampling site. The analysis of gas samples for Rn is estimated to be accurate to + 10 percent. This value
is derived from observed variations of the order of +5 percent experienced between routine calibrations of the ZnS(Ag) cham-bers, and'+ 10 percent experienced in calibrations of the NaI(Tl) crystal. These variations are consistent with source geometry reproducibility and electronic stability of the sys-tem. Moreover, inhomogeneities of the mine environment (e.g., variations in Ra content- and permeability of the rock) make any one point of sampling only an indication of the general trend occuring at all similar locations (given depths, given angles within the mine wall). It is not surprising occasion-ally to find sampling sites that yield absolute Rn concentrations which are different from concentrations observed in similar
sampling sites. No error is assigned to the data in an attempt to include the naturally anomalous sites in the general trend.
a. Radon Concentrations in Interstitial- Gas.
The concentration of Rn in the interstices of rock sur-rounding a non-pressured mine increases within the first few feet of rock from the low value at the wall surface,equal to the mine air Rn concentration, to nearly the maximum concentra-tion able to be supported by the emanating Ra in the parent rock. It is because of this very rapid rise in Rn concentra-tion within the surface layers of a mine wall that the
diffusion-driven flux of Rn into a mine is high. The flux of a diffusing substance, it is recalled, is directly proportional to the
concentration gradient of that substance. With the high specific flux of Rn across the wall-air interface, it is not surprising that a mine area unventilated even for a few hours accumulates high Rn and Rn daughter-product concentrations. The ability of overpressure to decrease significantly the interstitial Rn concentration in rock surrounding a mine is fundamental to its applicability as a possible ventilation mechanism.
Radon concentration.s are listed as interstitial concentra-tions, i.e., Lc/l of interstitial volume and not per liter of bulk rock.
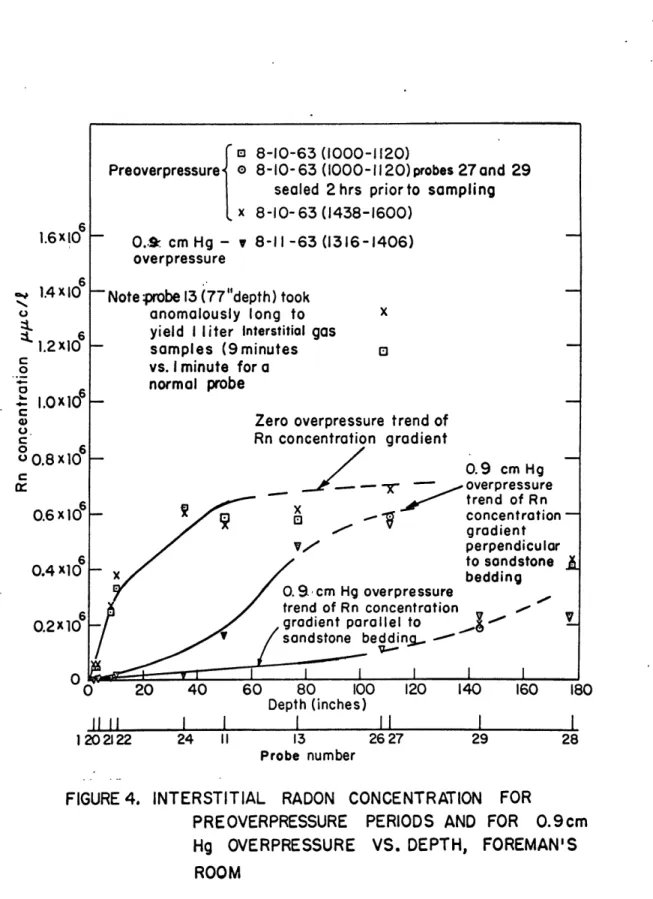
The data in Fig. 4 pertaining to preoverpressure inter-stitial Rn concentrations demonstrate the high concentrations of Rn found in the interstitial gas of sandstone immediately surrounding the foreman's room. Within the surface 40 in. of rock, the Rn concentration closely approaches the maximum steady-state value of about 6 x 10⁵ ggjLc/l for this rock.
In Figs. 4 and 5 it is seen that interstitial Rn concen-trations at the depths studied within the surrounding medium decrease regularly with increasing overpressure. This is the result of convective transport (with air forced by overpressure
0.& cm Hg
-overpressure
*
8-10-63 (1000-1120)o 8-10- 63 (1000-1120) probes 27 and 29
sealed 2hrs priorto sampling x 8-10-63 (1438-1600)
v 8-1 -63 (1316 -1406)
Note probe 13 (77"depth) took anomalously long to
yield I liter interstitial gas
- samples (9minutes
vs. I minute for a normal probe
Zero overpressure trend of Rn concentration gradient -
--X
- x 0. 9L cm Hig c trend of Rn gradient par V sandstone b 20 40 60 80 10 Depth (inches) 24 1I Probe number verpressure concentration allel to e d d in ,.---0.9 cm Hg overpressure trend of Rn concentration -gradient perpendicular to sandstone j bedding I I I 0 120 140 160 180 2627FIGURE 4. INTERSTITIAL RADON CONCENTRATION PREOVERPRESSURE
Hg OVERPRESSURE
ROOM
28
FOR
PERIODS AND FOR 0.9cm
VS. DEPTH, FOREMAN'S
34
1.6 x l0 6 1.4 xlO0 1.2 x10 4'l1.0 x 10 C C 0 6 lu0.8 x10 0.4 X10 0.2x0io 0 C 0.6 x I l I| 1 202122 1. . .12 24 12 24 12 24 12 24 12 24 12 24 12 24 hour
10 Il 12 13 14 15 16 Day August 1963
Time FIGURE 5. INTERSTITIAL RADON
VARIED OVERPRE ROOM CONCE SSURE NTRATION VS. TIME, TEST, FOREMAN'S
35
l0 L 24into the rock) of Rn from the shallow interstices of the rock to greater depths. Observe that in the surface 3 feet of rock during 0.9 cm Hg overpressure the Rn concentration is 5 percent of the pre-overpressure concentration, a twentyfold decrease! The large depression of the concentration gradient during overpressure is indicative of a corresponding decrease in the Rn flux.
The rate at which an interstitial Rn concentration is reduced by overpressure is dependent upon the magnitude of overpressure, the depth under study, and the permeability of
the rock. Generally, for overpressures of about 1 cm Hg and rock permeabilities similar to those of the test areas, the
adaptation of Rn concentrations in the surface 30 in. of rock to the overpressure is completed within the first 24 hours of overpressure;for depths between 30 in. and 110 in.
concentra-tion changes are completed in less than 4 days. In both test areas, the major portion of the pressure-induced Rn changes in the surface 100 in. of rock occur within the initial 20 hours of overpressure.
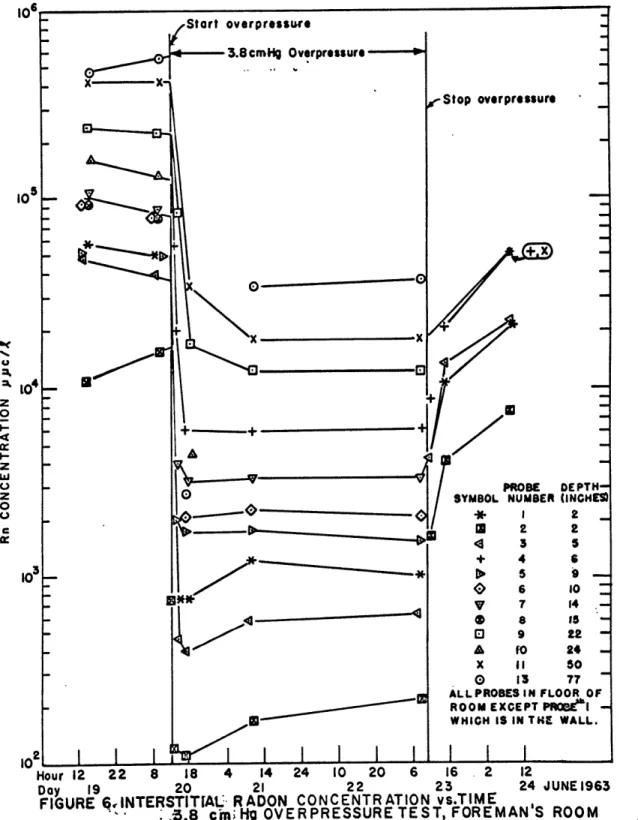
That the interstitial Rn concentrations only gradually return to their pre-overpressure values following a period of overpressure was confirmed at the termination of the 68 hour, 3.8 cm Hg, overpressure test, foreman's room (Fig. 6). Twelve
105
10
l
| | | 1 TyrW
I 1 | 1 I | 1Hour 12 22 8 18 4 14 24 10 20 6 16 . 2 12
Day 19 20 21 22 23 24 JUNE1963
FIGURE qINTERSTITIAL RADON CONCENTR ATION vs.TIME
. -;,5.8 cin Hg OVERPRESSURE TEST, FOREMAN'S ROOM
38
hours after the removal of overpressure the Rn concentrations in the initial 20 in'. of rock had returned to only 1/3 of their original values; at deeper levels the fraction of re-establishment was considerably less (e.g., at 50 in. the Rn concentration had reached 1/12 of its pre-overpressure level
12 hours after the end of overpressure). These results are consistent with observations in 5702 area.
The conception that during overpressure Rn will be held in rock interstices only to flow rapidly out at the termination of overpressure is, of course,' unfounded. Radon that is held within the interstices will decay there and never enter the mine area. At the termination of overpressure the Rn returns at a rate solely determined by its rate of diffusion through rock.
The interstitial Rn concentration data for the 0.9 cm Hg overpressure test shown in Fig. 4 give an indication of the directional variation of rock permeability to convective flow of air. The sampling probes located most vertically below the foreman's room tend to suffer a smaller percentage decrease in Rn concentration than probes located to the side of the
room. In the vicinity of the foreman's room, sandstone bedding is horizontal. Measurements of the permeability of rocks
taken from the mine show that there is less resistance to air motion parallel to stratifications than perpendicular to the
stratifications. In the foreman's room, permeability of the rock parallel to the stratifications is about 22 x 10~9 cm2 and perpendicular to the stratifications it is 14 x 10~9 cm2
The 21-day overpressure test, 5702 area, demonstrated that at least for an environment similar to this test area, over-pressure is an effective method of reducing interstitial Rn concentrations, and hence Rn flux, for periods equal to or
greater than 21 days (Figs.7-9). Once equilibrium overpressure conditions were established (taking 1 day for depths up to 30" and less than 4 days for depths up to 113") no varying trends in Rn flux or air consumption were observed for the duration of the experiment.
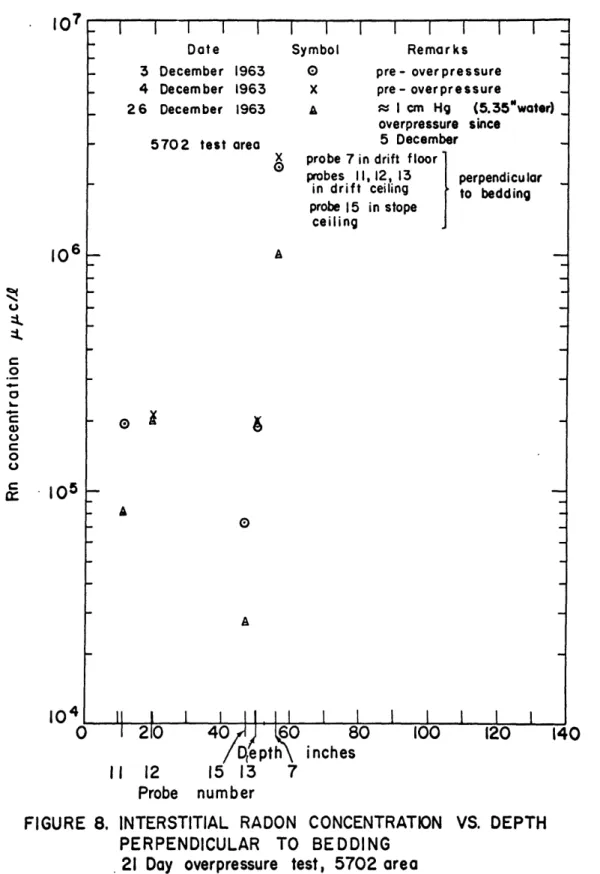
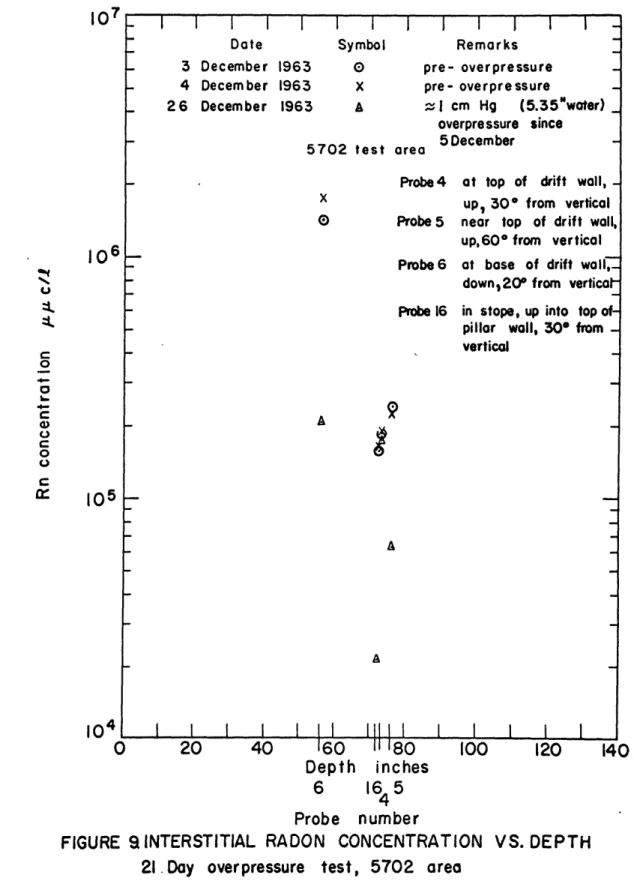
From data in Figs. 7, 8, and 9 (21 day overpressure test, 5702 area) it is at once apparent that there is an anomalous factor affecting sampling sites located above the 5702 area ceiling (5702 area, probes 4, 11, 12, 13). At all of these sites, with the possible exception of probe 11, the
pre-overpressure Rn concentration is considerably lower than that experienced at sites of comparable depths but located at lower absolute elevations. More dramatic in these ceiling sites is the absence of change in interstitial Rn concentrations from the pre-overpressure values throughout the entire 21-day period of overpressure. A comparison of the pressures at the various
Date 3 December 4 December 26 December Symbol Remarks 1963 0 pre-overpressure 1963 x pre - overpressure 1963 A ~ 1 cm Hg (5.35"water) overpressure since 5 December
probe 14 in pillar, all other probes
in drift wall , all parallel to
bedding 5702 test area Zero Overpressure 0 Icm Hg Overpressure I I 1 |
J1
I 1 I [ 1 1 1 I I I I 201 1 40 1 60 1180 Depth inches 10 8 14 I 23 Probe numberINTERSTITIAL RADON CONCENTRATION PARALLEL TO BEDDING
21 Day overpressure test, 5702 area
100 I 120 140 9 VS. DEPTH
40
FIGURE 7. - I I I I I I I I I I I I I -1106- I I I I Date - 3 December - 4 December _ 26 December I I I Symbol 1963 1963 1963 - 5702 test area I I I I Remarks I I o pre - overpressure X pre- overpressure A s I cm Hg (5.35"water) overpressure since 5 December probe 7 in drift floor
probes 11, 12, 13 perpendicular in drift ceiling to bedding probe 15 in stope ceiling - 0 A 1210 40 4 0 80 Dnpth inches Il 12 15 13 7 Probe number 100 120 140
FIGURE 8. INTERSTITIAL RADON CONCENTRATION
PERPENDICULAR TO BEDDING 21 Day overpressure test, 5702 area
VS. DEPTH 1~
4f1
106 1041 0 105Date 3 December 4 December 26 December Il I Symbol 1963 0 1963 x 1963 A 5702 test
I
R e Ir Remarks I i pre- overpressure pre- overpressure zI cm Hg (5.35"water) overpressure since 5 December areaProbe 4 at top of drift wall,
-x up, 300 from vertical
0 Probe 5 near top of drift wall, up,60* from vertical Probe 6 at base of drift wall,
down,20* from vertical-Probe 16 in stope, up into top ofpillar wall, 30* from -vertical A A A 0 20 40 160 11180 100 120 Depth inches 6 16 5 4 Probe number
FIGURE 9 INTERSTITIAL RADON CONCENTRATION VS. DEPTH
2I.Day overpressure test, 5702 area
4Zr
106 0 0 ix1041
140sampling probes with room pressure shows that probes located above the drift ceiling, regardless of depth, had pressures very similar to the room pressure (Fig. 10). For example, probe 4, 73 in. deep in ceiling, has a pressure only 0.08 cm oil below room pressure. At the same time, probe 2, 73 in. deep in wall, has a pressure of 1.40 cm oil below room
pres-sure. The flow-inducing pressure gradient is much greater in the direction of probe 2. The interstices of the rock in this ceiling area had become pressurized. Because of the
simi-larity of pressure between the rock interstices and the room there was little or no dr'iving force (pressure gradient) to cause purging air to flow into the rock. A pressure gradient is essential to cause air flow. The volume of flow, for a given rock permeability, is proportional to 'the pressure grad-ient. A likely supposition was that the shale lens, visible some 60 ft. away in the stope where portions of the ceiling had fallen, extended over these test holes in the drift. Subsequent investigation indicated that this lens did extend above much of the 5702 area ceiling and for several hundred feet beyond the test area. Because the shale lens has an
extremely low permeability, the air cannot easily pass through it. It also appears that the shale and a perched water table above it offer considerable resistance to the diffusion of Rn.
5.0 4.0[-3.0 t-IIIII I I I I I - 5702 test area A 7 December 1963
test area overpressure 15.24 -15.02 cm oil (.92 cm Hg)
Sp. Gr. of oil = 0.826 probe location
F = drift floor
FD = drift floor diagonally
W = drift wall
C - drif t ceilIng
SC = stope ceiling
SP = stope pillar PW = pillar wall, drift
0-E Q. . U) Q. E 0 0 0o0 A depth Inches 0 probe numbe r probe location FIGURE 10. 101 I I C 0 I '201 12 10
C W
PRESSURE VS. DEPTH, 130 8W
0?
11l1 40 14 PW/
--L
' 60
15 13 I (7A6 0) SC C W F FD DIFFERENCE BETWEEN 21 DAY OVERPRESSURE | I I !A 1 1 70'' ' 80 16 (2o,4*) SP W C 90 30,5A)W W
| I I I 100 110 120 9W
SAMPLING PROBE AND TEST AREA TEST, 5702 AREA
2.0
-I I I I
-45
The low interstitial Rn concentrations experienced at sitesabove the drift ceiling indicate that a barrier is present
which stops the diffusional flow of Rn from depth into the rock below the low-permeability lens. With the supply of Rn from
depth blocked, the concentration becomes depleted. Since the Rn flux is proportional to the Rn concentration gradient, these areas will have a low Rn flux. Interestingly, effects cancel: the Rn-purging and hence flux-reducing air cannot enter the interstices of this area of rock because of the impermeable backing; however, this same impermeable backing reduces the flux by its very presence.
Figure 7 shows the tenfold decrease in the Rn concentra-tions measured parallel to rock bedding at depths between 24 in. and 113 in. when 1 cm Hg overpressure was applied. This indi-cates at least a tenfold decrease in the Rn flux into the mine atmosphere from the walls of the mine.
The one probe (probe 14, 40 in. deep) in a pillar sur-rounded entirely by pressurized air had slightly under a factor of two decrease in interstitial Rn concentration during over-pressure. Because the pillar is surrounded by pressurized air, purging air entering the pillar can leave only through the top and bottom. This decreases the efficacy of purging.
Purging of interstitial gas in layers perpendicular to stratifications yielded a 2.5-fold decrease in Rn concentration
46
(Fig. 8, probes 7, 11, 15). If this is indicative of a 2.5 fold decrease in the interstitial Rn concentration gradient, the Rn flux into the mine from the floors and ceilings will be reduced during overpressure by a factor of 2.5.
Underpressuring a mine area that is located in a permeable rock environment establishes a system of pressures which in-crease from the low value in the mine to the normal atmospheric pressure at depth in the interstices of surrounding rock.
Such a pressure gradient induces a flow of gas from the rock interstices into the mine.
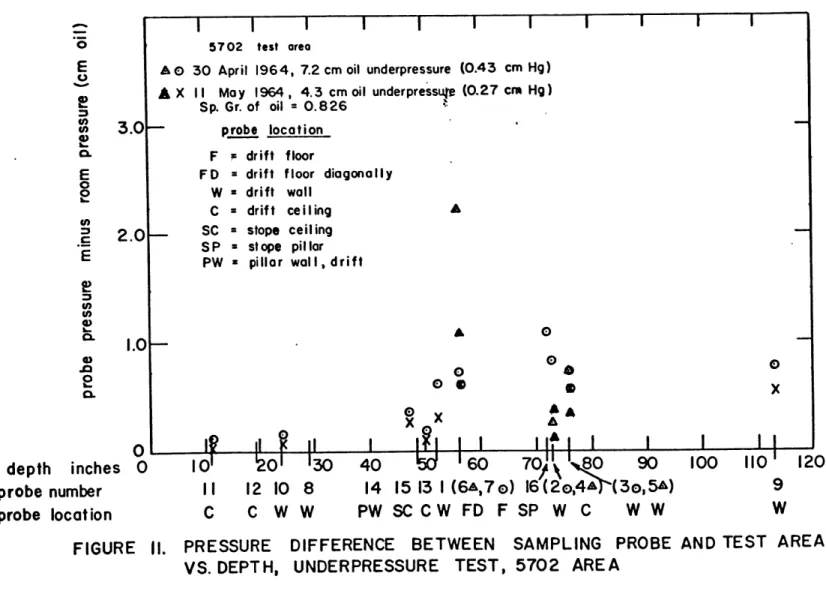
Figure 11 describes differences in pressure between test probes in rock adjacent to the 5702 area and the 5702 area itself, during 0.43 and 0.27 cm Hg (2.3 and 1.4 inches water respectively) underpressure of the 5702 area. In all cases the pressure within the interstices of adjacent rock is greater than that of the 5702 area. The overpressure experiments have shown this rock to be permeable to the flow of air. Thus, existence of the pressure gradient establishes the fact that there is a convective transport of the interstitial gas within this region toward the underpressured area.
Although interstitial gas was not sampled extensively during the underpressure tests, the data obtained follow expected trends. Probes located at large depths ( where Rn
EL E (0 0 . V CL depth inches probe number probe location AO A X 5.OF-2.0I I I I I I I I 1 1 5702 test area
30 April 1964, 7.2 cm oil underpressure (0.43 cm Hg) II May 1964, 4.3 cm oil underpressure (0.27 cm Hg)
Sp. Gr. of oil = 0.826 probe location F F D w C SC S P Pw drift floor
drif t floor diagonally drift wall
drift ceiling slope ceiling st ope piI lor
pillar wall, drift
0 0 0I X to I I C 'o2 12 10 C W 130 8 W 40 14 PW 0 0 A Il--I II II~I 1 60 701\ 8o 90 15C3(6P7W) 16(2 SC C W FD F SP W C W W I I
~L~LL
100 1101 120 9 wFIGURE II. PRESSURE DIFFERENCE BETWEEN SAMPLING PROBE
VS. DEPTH, UNDERPRESSURE TEST, 5702 AREA
AND TEST AREA -
-if || 2
-48
concentration during normal barometric conditions is constant regardless of increasing depth) show no change in concentration during underpressure even though there is a pressure difference between the probe and the 5702 area. The pressure decreases
in the direction of the test area; flow is from depth into the area. Since in these deep regions the Rn concentration does not change with increasing depth, gas from depth flowing past these probes toward the test area has the same Rn
concen-tration as the gas initially at these probes.
At intermediate and shallow depths significant increases in Rn concentration were observed during underpressure. Dur-ing non-pressure condition, this region has its Rn concentra-tion depleted by diffusion of Rn into the test area. During underpressure gas from greater depths, and hence higher Rn concentration regions, flows past these probes toward the test area increasing the local. Rn concentration.
Sampling probes located in the ceiling of the 5702 area showed little or no equilibrium Rn concentration change during underpressure. This is attributed to the presence of the low-permeability shale lens overlying the area. Consistently probes
located at elevations above the drift ceiling and hence near the
49
probes located at comparable depths but lower absoluteeleva-tions (c.f., probe 4 vs. probe 2, probe 13 vs. probe 1, Fig. 11). The small pressure gradient indicates a reduced convective flow in this region.
A drop in the interstitial Rn concentration at several probes was observed on the first day of underpressure and at
no other time during the underpressure experiment. The-origin of this transient decrease is uncertain. It would be expected
that with the establishment of underpressure, flow into the test area from the rock interstices would begin. This, as previously described, would increase shallow depth Rn
concen-trations. The initial decrease in Rn concentration may indicate an initial flow of Rn deficient air from a non-underpressured tunnel outside the test area. The closest non-underpressured area is 50 ft. from the sampling probes.
A study of the naturally occurring Rn concentrations as a function of depth shows that, for the locations sampled, concentration is not necessarily related to depth. Mine anal-yses have shown that large variations in the Ra content of rocks in the mine exist. When not in the immediate vicinity of a tunnel, Rn concentration in interstitial gas is dependent upon emanating Ra concentration in the rock.
50
b. Radon Flux.Consistent with the previously described reduction of the interstitial Rn concentration gradient in rock adjacent to an overpressured area, the Rn flux into an overpressured area is depleted from its pre-overpressure level, the extent of the depletion being related to the magnitude of the actual overpressure. Figure 12 describes the total flux of Rn into the foreman's room as a function of overpressure. The empiri-cal relationship shown indicates how very significantly the Rn flux is reduced for modest overpressures. The flux of Rn into the foreman's room with no overpressure is estimated from flux data gathered in June 1963, to be about 4 x 10⁻⁸ c/sec, nearly 20 times higher than flux during 1 cm Hg over-pressure.
Figure 13 shows the total flux of Rn into the 5702 area as a function of overpressure and underpressure. Overpressure of 1 cm Hg produces a 5-fold decrease from the zero overpressure flux. This reduction, while not as extensive as the reduction experienced in the foreman's room, is still formidable. The 5702 area provided a more rigorous test of the overpressure principle as an application to general mine ventilation than did the foreman's room. This area is more distant from non-pressured areas than is the foreman's room, and a shale lens overlies much of the 5702 area ceiling. Proximity to a
non-0.2 0.6 1.0 1.4 2.0 2.4 3.0 3.4 cm Hg 5.35 10.7 Inches water Over pressure 16.1
FIGURE IZ TOTAL RADON FLUX INTO FOREMAN'S ROOM
APPLIED OVERPRESSURE
51
4.0 x 3.0 x 2.0 1.0 0.2 VS.O 10 Cj I0 I a:
Pressure in 5702 area relative to local barometric pressure FIGURE13.TOTAL RADON FLUX INTO 5702 AREA vs 5702 AREA
PRESSURE RELATIVE TO LOCAL BAROMETRIC PRESSURE.
53
pressured area causes the pressure gradient in the rock adjacent to the test area to be steeper than if the area were surrounded by an infinite rock medium. The steeper pressure gradientincreases the velocity of purging flow within the rock and hence 'allows a greater reduction in the interstitial Rn con-centration. This is reflected in a greater decrease in Rn flux in areas of steep pressure gradients. Pressure gradients within rock adjacent to the foreman's room are 5 to 10 times steeper than in rock adjacent to the 5702 area. This reflects, in part, the difference in permeabilities and geometries of the two areas, and in part, the fact that one end of the fore-man's room is separated from a non-pressured haulageway by only a few feet of rock.
The shale lens that extends over and beyond much or all of the 5702 ceiling prevented purging air from flowing effi-ciently into the ceiling rock. The Rn flux into the 5702 area from the ceiling surface was therefore not reduced as signifi-cantly as it might have been had no barrier been present.
Fortunately, this low permeability lens itself reduces the Rn flux from this area permanently. The enclosed pillar in the 5702 area, which had a large surface area and pre-over-pressure Rn concentrations consistent with sites in the 5702 drift wall, could not be efficiently purged since it was
sur-54
rounded by pressured air.For the pressure ranges studied, underpressure seems as efficient in increasing the Rn flux into a mine as overpressure is in reducing this flux. In the 5702 area, a 0.43 cm Hg
underpressure results in a 3-fold increase in the Rn flux while a 0.43 cm Hg overpressure decreases the flux by about
the same factor (Fig. 13). The mechanism of the increase in flux during underpressure is a convective introduction of interstitial gas, rich in Rn, to the test area. During 0.43 cm Hg underpressure in the 5702 area approximately 30 ft3/min. of interstitial gas are drawn into the area.
The total zero overpressure Rn flux into the 5702 area is approximately 12.5 x 10~7 c/sec. The corresponding flux into the foreman's room is 4 x 10⁻⁸ c/sec. This indicates
an average Rn flux per unit area in the 5702 site of 6.5 x 10¹⁴ c/cm2 sec and in the foreman's room of 4 x 10~14 c/cm2 sec.
Since the Rn flux from the 5702 ceiling is lowered by the
presence of a shale lens, the flux per unit area from the rest of the 5702 surfaces must be greater than the above value to compensate for this. The floor and walls of the 5702 stope contain moderately high grade uranium ore and hence are capable of producing a high Rn flux.
55
C. Room Air Radon Concentrations.
The reduction of Rn flux into a mine area during over-pressure indicates that for a given rate of air consumption a lower ambient Rn concentration will be achieved if an area is overpressured than if the same area is ventilated by dilution techniques. During the 21 day, 1 cm Hg overpressure test, in the 5702 area the equilibrium room air Rn concentration was 4500 ,c/l; the rate of air consumption to maintain this over-pressure was 100 ft3/min. Several weeks after the termination of overpressure the area was ventilated by dilution using
102 ft3/min. The equilibrium Rn concentration with dilution was 23,000 ijjc/l. This is 5 times the Rn level achieved with overpressure although the air consumption was essentially the same in both cases. To reduce the Rn concentration to 4500
ijLc/l, pure dilution would require at least 500 ft3/min. Attempts to use dilution plus overpressure as a combined ventilation technique were hampered by the unavailability of large volumes of fresh air at the very remote location of the 5702 area. At 1 cm Hg, 30 ft3/min. of dilution air was added to the 100 ft3/min. pressurizing air. This was accomplished by having restricted vents at the bulkheads. The equilibrium
air Rn concentration for these conditions was 3300 ±c/l. Had no dilution occurred the Rn concentration would have been about
130
56
of the previous 1 cm Hg overpressure test. The observationindicates that although there is more turbulence in the over-pressured area as a result of the passage of additional dilution air, the Rn flux from the walls is not increased above the
pure overpressure value. Additions of large volumes of Rn-contaminated diluting air (up to 1200 ft3/min.) during 1 cm Hg overpressure also did not increase the Rn flux. In fact
one can expect a decrease in the flux when adding diluting air since the purging air which enters the rock interstices will have a lower Rn content.
For a given rate of air change an area will have higher room air Rn concentrations when it is underpressured than when the ventilation occurs at a pressure equal to or greater than
local barometric pressure.
Pertaining to the following comments and Table 1, it is noted that for conditions of constant Rn flux (i.e., fixed pressure conditions) the air Rn concentration in the test area does not change in direct proportion to changes in the air dilution rate. With high dilution rates, the concentration of Rn is lowered and hence the amount of Rn in the test area that is "removed" by decay is decreased. Calculations must account for Rn removed by decay as well as by the convective displacement of the diluting air.