HAL Id: hal-00613590
https://hal.archives-ouvertes.fr/hal-00613590
Submitted on 5 Aug 2011
HAL is a multi-disciplinary open access
archive for the deposit and dissemination of sci-entific research documents, whether they are pub-lished or not. The documents may come from teaching and research institutions in France or abroad, or from public or private research centers.
L’archive ouverte pluridisciplinaire HAL, est destinée au dépôt et à la diffusion de documents scientifiques de niveau recherche, publiés ou non, émanant des établissements d’enseignement et de recherche français ou étrangers, des laboratoires publics ou privés.
Interpretation of pesticide contamination monitoring
data in surface water in France
C. Gauroy
To cite this version:
C. Gauroy. Interpretation of pesticide contamination monitoring data in surface water in France. International Conference on Priority Pollutants in River Basins, May 2011, Karlsruhe, Germany. 9 p. �hal-00613590�
Interpretation of pesticide contamination monitoring
data in surface water in France
Christine Gauroy Cemagref
Science, water & land management
Aquatic environments, ecology and pollution Research unit 3 bis quai Chauveau,
69336 Lyon Cedex, France
International Conference – Karlsruher Flussgebietstage 2011 1
1 INTRODUCTION
The European Water Framework Directive requires a monitoring of pesticide contamination in surface water. In France, 15 million analyses have been collected since 1997. These data are hard to interpret, partly because the surveillance is carried out under multiple monitoring networks. Each network has its own purpose (general knowledge of water quality, control of drinking water standards, or specific knowledge of pesticide contamination) and area of concern, leading to different monitoring strategies in terms of sampling date, location and rate.
A study has been carried out to find suitable methods to assess the current situation and trends of the contamination and to highlight the link between pesticide pressure and water contamination.
2
METHODS OF ASSESSING CONTAMINATION
2.1 Geographic grouping
Analyses from a single sampling site are not often sufficient to assess a trend in contamination. Moreover, samplings date and analyzed pesticides vary from a site to another. To get round these difficulties, we tested a method of interpretation by gathering data on a geographic basis. We assumed that pesticide transfers, and as a consequence temporal patterns of concentration in water courses, are similar within regions that have homogeneous topography, climate, soil type, bedrock and water flow. We used the hydro-ecoregions (HER), that were defined to implement the European Water Framework Directive, which requires a typology of aquatic ecosystems based on geographical features in order to define reference conditions (Figure 1).
2 International Conference – Karlsruher Flussgebietstage 2011
1 Pyrenees
12 Armorica 2 Inner Alps
13 Landes
3 Southern Massif Central
14 Hillsides of Aquitaine 4 Vosges
15 Plain of the Saône 5 Jura and alpine foredeep
16 Corsica
6 Mediterranean region
17 Depressions of the Massif Central 7 Southern pre -Alps
18 Alsace 8 Cévennes
19 Grands Causses 9 Limestone tables
20 Sand -clay deposits 10 Eastern limestone cuestas
21 Northern Massif Central 11 Causses of Aquitaine 22 Ardennes 1 Pyrenees 12 Armorica 2 Inner Alps 13 Landes
3 Southern Massif Central
14 Hillsides of Aquitaine 4 Vosges
15 Plain of the Saône 5 Jura and alpine foredeep
16 Corsica
6 Mediterranean region
17 Depressions of the Massif Central 7 Southern pre -Alps
18 Alsace 8 Cévennes
19 Grands Causses 9 Limestone tables
20 Sand -clay deposits 10 Eastern limestone cuestas
21 Northern Massif Central 11 Causses of Aquitaine
22 Ardennes
Figure 1: Map of French HER
2.2 Descriptors
Each analysis is described by its sampling location, date and the substance analysed. The result is either the molecule concentration, the limit of detection (LOD) if the molecule was not detected, or the limit of quantification (LOQ) if traces of the molecule were detected but not quantified. A relevant descriptor is the 90th percentile of the results (LOD are replaced by 0 and LOQs by LOQ/2) twice per month (the first 15 days and the rest of the month, thus years can be compared with each other or accumulated) (see Figure 2).
We also used the percentage of concentrations above 0.1 µg/L against all the analyses. These two descriptors are statistically correlated.
2.3 Link with application periods, marketing authorisations and
land use
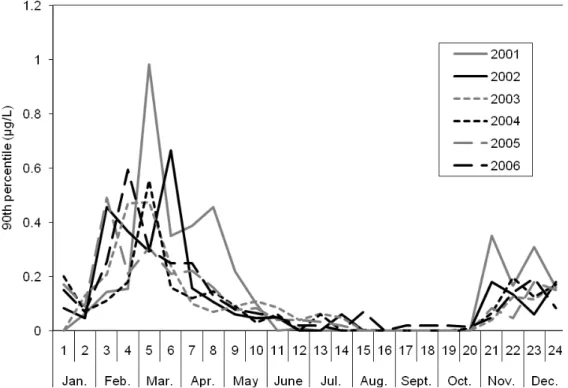
Seasonal variations appear to be similar from one year to another. For example, isoproturon, a herbicide mostly used for cereals, shows two periods of contamination per year (Figure 2): the first one at the end of the winter and the second one in autumn. They fit with the application periods of this pesticide: at the vegetation regrowth and at thewinter cereals’ sowing.
International Conference – Karlsruher Flussgebietstage 2011 3
Figure 2: 90th percentile of analysis results per 15 days, for isoproturon, in the armorican HER (12)
This method also highlights trends between years. For example, Atrazine was detected above all between May and September. Its contamination level decreased steadily until 2003, and sharply between 2003 and 2004. This may be due to the reduction in the applied amounts, as local ban on atrazine use have been implemented since 1997, complete ban on sale at the end of 2002 and complete ban on use at the end of 2003. A Principal Component Analysis (PCA) was conducted on the percentages of the concentrations above 0.1 µg/L per substance and HER. It showed that substances applied mostly on vineyards, such as norflurazon, procymidone and dimethomorph, are mostly detected in HER 15 (Plain of the Saône), more specifically in the Beaujolais area. Similarly, substances used on beets (metamitron and chloridazon) or potatoes (prosulfocarb) are detected in the north: HER 20 (sand-clay deposits) and 9 (limestone tables). Substances used on corn and/or sunflower (acetochlor, dimethenamid, metolachlor and alachlor) are detected in HER 14 (Hillsides of Aquitaine). Contamination of water, as estimated with this method, is therefore consistent with land use, but there are regions particularly contaminated, as for example the plain of the Saône. Is it because larger amounts of products are applied there or because their environment is more vulnerable?
This way of describing contamination is interesting because it shows patterns which are not always visible at the scale of a stand alone sampling site, and which are consistent with application periods, marketing authorisations and land use. It also highlight regions with comparatively high contamination. We then used pesticide sold
4 International Conference – Karlsruher Flussgebietstage 2011
quantities data to pursue the study of the link between pesticide pressure and water contamination.
3
LINK BETWEEN PESTICIDE PRESSURE AND WATER
CONTAMINATION
3.1 Database of pesticide sales
Since 2008, pesticide distributors have had to pay a tax on non-point pollution. Thus sellers must declare the sold quantities of each product for agricultural or non-agricultural uses. At request of the ministry in charge of the environment, Onema (the French national agency for water and aquatic environments) built a tool to access these data for each plant protection product or for each substance.
This leads to a valuable database to assess the quantities of each pesticide applied. However are uncertainties about where the products are used remain. Indeed, some companies have point of sales in much of France, or sell products on the Internet, but declare at their head office the overall quantity sold by the firm.
3.2 Selling periods versus contamination periods
In 2009, sales were declared from January to June and from July to December. This provides information about selling periods. Figure 3 shows a relation between the ratio of contamination from April to September on contamination from October to March and the ratio between quantities sold from January to June and quantities sold along the year. That is, the substances mostly sold during the first part of year are mostly detected in surface water in the middle of the year, and vice versa.
International Conference – Karlsruher Flussgebietstage 2011 5
Figure 3: Period of contamination according to period of sales per pesticide and per unit in 2009
3.3 Sold quantities versus contamination levels
For this study, we did not group the data within HER but within units based both on HER and land use (31 units). We allocated the quantities sold by a firm to the unit where the city of the firm is located.
First, we studied the relation between sold quantities and contamination levels for some pesticides, for example glyphosate (cf Figure 4). Contamination in a geographic unit is related to the amount of glyphosate sold, but 2 regions have a comparatively high contamination: Paris area and Flanders. This may be due to a higher vulnerability of surface water in these regions (in particular, large surfaces are waterproof in Paris area) or to the uncertainties on the application locations.
France, 2009 0,01 0,1 1 10 100 0 20 40 60 80 100
Quantités vendues au 1er semestre 2009 / Quantités vendues en 2009 (% )
/ (% d e [ c ] > 0 ,1 µ g /L d e j a n v à m a rs e t d 'o c to b re à d é c 2 0 0 9 )
France, 2009, per pesticide and per geographic unit
P e rc e n ta g e o f c o n c e n tr a ti o n s a b o v e 0 .1 µ g /L f ro m A p ri l to S e p te m b e r / P e rc e n ta g e o f c o n c e n tr a ti o n s a b o v e 0 ,1 µ g /L f ro m J a n u a ry t o M a rc h a n d fr o m O c to b e r to D e c e m b e r 0 10 20 30 40 50 60
Sold quantities from January to June / Sold quantities along the year (% )
France, 2009 0,01 0,1 1 10 100 0 20 40 60 80 100
Quantités vendues au 1er semestre 2009 / Quantités vendues en 2009 (% )
/ (% d e [ c ] > 0 ,1 µ g /L d e j a n v à m a rs e t d 'o c to b re à d é c 2 0 0 9 )
France, 2009, per pesticide and per geographic unit
P e rc e n ta g e o f c o n c e n tr a ti o n s a b o v e 0 .1 µ g /L f ro m A p ri l to S e p te m b e r / P e rc e n ta g e o f c o n c e n tr a ti o n s a b o v e 0 ,1 µ g /L f ro m J a n u a ry t o M a rc h a n d fr o m O c to b e r to D e c e m b e r 0 10 20 30 40 50 60
6 International Conference – Karlsruher Flussgebietstage 2011
Figure 4: Percentage of concentrations of glyphosate above 0.1 µg/L according to sold quantities, per geographic unit and per year (2008 or 2009)
Then, we studied pesticide transfer for each geographic unit, for example the Cretaceous chalk of Paris Basin. We can see on Figure 5 that, similarly, there is a relation between sold quantities and contamination, but that some substances are comparatively more detected in surface water in this region: aminotriazole, diuron, nicosulfuron and metaldehyde. We can assumed that these substances have a higher transfer ability or are applied in conditions that favour transfers towards surface water.
Glyphosate, per geographic unit and per year (2008 or 2009)
R2 = 0,231 0 10 20 30 40 50 60 70 0 10 20 30 40 50 60 Sold quantities (kg/km²) 0 .1 µ g /L Paris area Flanders P e rc e n ta g e o f c o n c e n tr a ti o n s a b o v e 0 .1 µ g /L
Glyphosate, per geographic unit and per year (2008 or 2009)
R2 = 0,231 0 10 20 30 40 50 60 70 0 10 20 30 40 50 60 Sold quantities (kg/km²) 0 .1 µ g /L Paris area Flanders P e rc e n ta g e o f c o n c e n tr a ti o n s a b o v e 0 .1 µ g /L 20 30 40 Sold quantities (kg/km²) 20 30 40 Sold quantities (kg/km²)
Glyphosate, per geographic unit and per year (2008 or 2009)
R2 = 0,231 0 10 20 30 40 50 60 70 0 10 20 30 40 50 60 Sold quantities (kg/km²) 0 .1 µ g /L Paris area Flanders P e rc e n ta g e o f c o n c e n tr a ti o n s a b o v e 0 .1 µ g /L
Glyphosate, per geographic unit and per year (2008 or 2009)
R2 = 0,231 0 10 20 30 40 50 60 70 0 10 20 30 40 50 60 Sold quantities (kg/km²) 0 .1 µ g /L Paris area Flanders P e rc e n ta g e o f c o n c e n tr a ti o n s a b o v e 0 .1 µ g /L 20 30 40 Sold quantities (kg/km²) 20 30 40 Sold quantities (kg/km²)
International Conference – Karlsruher Flussgebietstage 2011 7
Cretaceous chalk of Paris Basin, per substance unit and per year (2008 or 2009) 2,4-MCPA, 2009 Diuron, 2009 Nicosulfuron, 2009 2,4-MCPA, 2008 Nicosulfuron, 2008 Isoproturon, 2009 Chlortoluron, 2009 Diuron, 2008 Isoproturon, 2008 Chlortoluron, 2008 Aminotriazole, 2009 Metaldehyde, 2008 Aminotriazole, 2008 Metaldehyde, 2009 Glyphosate, 2008 Glyphosate, 2009 0 4 8 12 16 20 24 28 0 5 10 15 20 25 30 35 Sold quantities (kg/km²) µ g /L P e rc e n ta g e o f c o n c e n tr a ti o n s a b o v e 0 .1 µ g /L
Cretaceous chalk of Paris Basin, per substance unit and per year (2008 or 2009) 2,4-MCPA, 2009 Diuron, 2009 Nicosulfuron, 2009 2,4-MCPA, 2008 Nicosulfuron, 2008 Isoproturon, 2009 Chlortoluron, 2009 Diuron, 2008 Isoproturon, 2008 Chlortoluron, 2008 Aminotriazole, 2009 Metaldehyde, 2008 Aminotriazole, 2008 Metaldehyde, 2009 Glyphosate, 2008 Glyphosate, 2009 0 4 8 12 16 20 24 28 0 5 10 15 20 25 30 35 Sold quantities (kg/km²) µ g /L P e rc e n ta g e o f c o n c e n tr a ti o n s a b o v e 0 .1 µ g /L Figure 5
4 Conclusion
Methods of interpretation of pesticide contamination monitoring data by grouping data on a geographic basis are interesting to describe contamination and link it to pesticide applications (dates, regions and quantities). Comparison with quantities sold highlights substances and regions with comparatively high contamination, and further studies are necessary to interpret these results.