HAL Id: insu-02178607
https://hal-insu.archives-ouvertes.fr/insu-02178607
Submitted on 10 Jul 2019
HAL is a multi-disciplinary open access
archive for the deposit and dissemination of sci-entific research documents, whether they are pub-lished or not. The documents may come from teaching and research institutions in France or abroad, or from public or private research centers.
L’archive ouverte pluridisciplinaire HAL, est destinée au dépôt et à la diffusion de documents scientifiques de niveau recherche, publiés ou non, émanant des établissements d’enseignement et de recherche français ou étrangers, des laboratoires publics ou privés.
magnetostratigraphy, tephrostratigraphy, sequence
stratigraphy and Bayesian age modeling
A. L. Deino, M. J. Sier, D. Garello, B. Keller, J. Kingston, J. Scott,
Guillaume Dupont-Nivet, A. Cohen
To cite this version:
A. L. Deino, M. J. Sier, D. Garello, B. Keller, J. Kingston, et al.. Chronostratigraphy of the Baringo-Tugen-Barsemoi (HSPDP-BTB13-1A) core – 40Ar/39Ar dating, magnetostratigraphy, tephrostratig-raphy, sequence stratigraphy and Bayesian age modeling. Palaeogeography, Palaeoclimatology, Palaeoecology, Elsevier, 2019, 532, pp.109258. �10.1016/j.palaeo.2019.109258�. �insu-02178607�
Chronostratigraphy of the Baringo-Tugen-Barsemoi (HSPDP-BTB13-1A) core – 40Ar/39Ar dating, magnetostratigraphy, tephrostratigraphy, sequence stratigraphy and Bayesian age modeling
A.L. Deino, M.J. Sier, D. Garello, B. Keller, J. Kingston, J. Scott, G. Dupont-Nivet, A. Cohen
PII: S0031-0182(18)31049-6
DOI: https://doi.org/10.1016/j.palaeo.2019.109258
Article Number: 109258
Reference: PALAEO 109258
To appear in: Palaeogeography, Palaeoclimatology, Palaeoecology
Received date: 16 December 2018
Revised date: 25 June 2019
Accepted date: 25 June 2019
Please cite this article as: A.L. Deino, M.J. Sier, D. Garello, et al., Chronostratigraphy of the Baringo-Tugen-Barsemoi (HSPDP-BTB13-1A) core – 40Ar/39Ar dating, magnetostratigraphy, tephrostratigraphy, sequence stratigraphy and Bayesian age modeling, Palaeogeography, Palaeoclimatology, Palaeoecology, https://doi.org/10.1016/ j.palaeo.2019.109258
This is a PDF file of an unedited manuscript that has been accepted for publication. As a service to our customers we are providing this early version of the manuscript. The manuscript will undergo copyediting, typesetting, and review of the resulting proof before it is published in its final form. Please note that during the production process errors may be discovered which could affect the content, and all legal disclaimers that apply to the journal pertain.
ACCEPTED MANUSCRIPT
Chronostratigraphy of the Baringo-Tugen-Barsemoi (HSPDP-BTB13-1A) core –
40Ar/39Ar dating, magnetostratigraphy, tephrostratigraphy, sequence
stratigraphy and Bayesian age modeling
A.L. Deino1, M.J. Sier2,3, D. Garello4, B. Keller1, J. Kingston5, J. Scott6, G. Dupont-Nivet7,8, A. Cohen9
1Berkeley Geochronology Center, 2455 Ridge Rd., Berkeley, CA 94709 USA;
[email protected] (corresponding author)
2Department of Earth Sciences, University of Oxford, South Parks Road, OX1 3AN
Oxford, United Kingdom
3CENIEH, Paseo Sierra de Atapuerca 3, 09002 Burgos, Spain
4School of Earth and Space Exploration, Arizona State University, Tempe, AZ 85287,
USA
5Department of Anthropology, University of Michigan, Ann Arbor, MI 48109, USA 6Department of Earth and Environmental Sciences, Mount Royal University, Calgary,
Alberta T3E 6K6, Canada
7Univ Rennes, CNRS, Géosciences Rennes - UMR 6118, F-35000 Rennes, France. 8Institute for Earth and Environmental Science, Potsdam University, Potsdam,
Germany.
9Department of Geosciences, University of Arizona, Tucson, AZ 85721, USA
Abstract
The Baringo-Tugen-Barsemoi 2013 drillcore (BTB13), acquired as part of the Hominin Sites and Paleolakes Drilling Project, recovered 228 m of fluviolacustrine sedimentary rocks and tuffs spanning a ~3.29–2.56 Ma interval of the highly fossiliferous and hominin-bearing Chemeron Formation, Tugen Hills, Kenya. Here we present a Bayesian stratigraphic age model for the core employing chronostratigraphic control points derived from 40Ar/39Ar dating of tuffs from core
and outcrop, 40Ar/39Ar age calibration of related outcrop diatomaceous units, and
core magnetostratigraphy. The age model reveals three main intervals with distinct sediment accumulation rates: an early rapid phase from 3.2–2.9 Ma; a relatively slow phase from 2.9–2.7 Ma; and the highest rate of accumulation from 2.7–2.6 Ma. The intervals of rapid accumulation correspond to periods of high Earth orbital eccentricity, whereas the slow accumulation interval corresponds to low eccentricity at 2.9–2.7 Ma, suggesting that astronomically mediated climate processes may be responsible for the observed changes in sediment accumulation rate. Lacustrine transgression-regression events, as delineated using sequence stratigraphy, dominantly operate on precession scale, particularly within the high eccentricity periods. A set of erosively based fluvial conglomerates correspond to the 2.9–2.7 Ma interval, which could be related to either the depositional response to low eccentricity or to the development of unconformities due to local tectonic activity. Age calibration of core magnetic susceptibility and gamma density logs
ACCEPTED MANUSCRIPT
indicates a close temporal correspondence between a shift from high- to low-frequency signal variability at ~3 Ma, approximately coincident the end of the mid-Piacenzian Warm Period, and the beginning of the cooling of world climate leading to the initiation of Northern Hemispheric glaciation c. 2.7 Ma. BTB13 and the Baringo Basin records may thus provide evidence of a connection between high-latitude glaciation and equatorial terrestrial climate toward the end of the Pliocene. Keywords
Chemeron Formation; Pliocene; eccentricity; precession; paleoclimate; paleolimnology.
1 Introduction
The Hominin Sites and Paleolakes Drilling Project (HSPDP) was initiated to develop a broader understanding of the influence of climate change on the process of human evolution. The guiding concept behind the project is that in order to obtain the most complete, detailed, and reliable paleoclimatic constraints on evolutionary processes, not only is it necessary to study the outcrops where hominin fossils are found, but it is also essential to acquire deep drillcores from nearby paleolake sedimentary strata that potentially provide a more complete and unaltered record than discontinuous surface exposures. Lake-bed drillcores provide the opportunity to collect continuous, high resolution, quantitative proxy records of key paleoclimatic (temperature, precipitation, seasonality), ecology (watershed vegetation, fire history, lake ecology) and landscape/tectonic variables critical for evaluating competing hypotheses linking environmental history to human evolution.
Six Plio-Pleistocene paleolake sites in Kenya and Ethiopia were chosen for this project based on their proximity to important hominin fossil sites, and on the time interval they encompass, in order to document the environmental context of human evolution through key intervals of our evolutionary history (Campisano et al., 2017; Cohen et al., 2016). One of these critical intervals is the Plio-Pleistocene transition, a time of both important Earth history events (i.e., the onset of global cooling and Northern Hemisphere glaciation) and events in hominin prehistory (evolutionary change and extinction of Australopithecus afarensis (Lockwood et al., 2000; Reed and Rector, 2007), first appearance of our own genus Homo (Villmoare et al., 2015), and the earliest record of stone tools (Harmand et al., 2015) and cutmarks (McPherron et al., 2010).
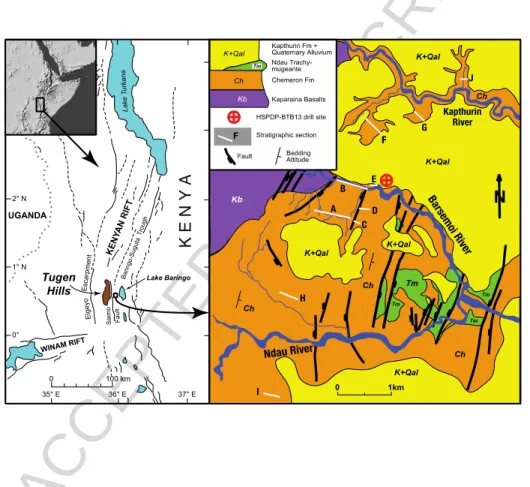
The Baringo-Tugen Hills-Barsemoi core site (the core has the project identifier ‘HSPDP-BTB13-1A,’ herein abbreviated ‘BTB13’) was chosen by HSPDP as a unique opportunity to investigate these transitions in eastern Africa (Figure 1). The cored strata target the highly fossiliferous Plio-Pleistocene Chemeron Formation, exposed in the axial portion of the central Kenya Rift, east of the southern margin of Lake Baringo. The specific targeted interval begins at the top of a previously documented sequence of five precessionally paced lake expansion events from 2.7–2.55 Ma (Deino et al., 2006; Kingston et al., 2007). Based on outcrop
ACCEPTED MANUSCRIPT
mapping, the core interval was anticipated to extend downward through non-lacustrine intervals, with possible return to alternating non-lacustrine conditions at ~3 Ma toward the base of the core. The upper Cenozoic strata of this region have been explored paleontologically for decades (Bishop et al., 1971; Hill, 1985; Hill et al., 1985; Hill, 1994; Hill and Ward, 1988), and have yielded important hominin finds, including Orrorin tugenensis (Senut et al., 2001), Ardipithecus? (Hill, 1985; White et al., 2009), and early Homo (Hill et al., 1992). The large-scale climatic fluctuations exhibited by the Chemeron Formation during the late Pleistocene, combined with close proximity to a rich record of hominin evolution, ideally situates BTB13 to explore and develop hypotheses of climatic influences on hominin evolution that are central to the HSPDP project goals.
Figure 1. Location map and geological setting of BTB13. Stratigraphic sections are described elsewhere (Deino et al., 2006; Kingston et al., 2007).
2 Geological setting
The BTB13 drill site is situated near the axis of the Kenya Rift, in east-central Kenya. Exposures of probable rift-related volcanic activity extend back as far as 21 Ma along the boundary faults of the rift in this region (Chapman and Brook, 1978). Widespread volcanic activity began ~16 Ma, and as much as 3000 m of lava flows, pyroclastic rocks, and intercalated fluviolacustrine beds accumulated intermittently
ACCEPTED MANUSCRIPT
into the late Pleistocene, terminating with the fluvial deposits and volcaniclastic tuffs of the Kapthurin Formation (Chapman et al., 1978). The exact structural position of the drill site is unusual in the East African Rift System overall, in that it lies in the eastern foothills of a major intra-rift westward tilting horst that forms the Tugen Hills. The Saimo Fault, which bounds the Tugen Hills on the east, has a maximum displacement of 4000 m (Chapman et al., 1978), and is situated only ~10 km west of the drill site. The age of movement along the fault is not precisely known, but has been interpreted to mostly post-date deposition of the Chemeron Fm (Chapman et al., 1978). Structural deformation in post-Chemeron Fm time has resulted in extensive normal faulting of the eastern foothills of the Tugen Hills encompassing the drill site area.
The Chemeron Fm spans approximately 3.7 Ma, from 5.3–1.6 Ma (McCall et al., 1967; Chapman and Brook, 1978; Hill et al., 1986; Deino et al., 2002; Deino and Hill, 2002; Deino et al., 2006; Kingston et al., 2007), and is composed of subaerial fluvial/alluvial and lacustrine sedimentary strata and siliceous tuffs. The formation is exposed discontinuously in the foothills east of the Tugen Hills and west of Lake Baringo (Figure 1). Chemeron Fm strata typically rest disconformably on the widespread Kaparaina Basalts (~5.7–5.3 Ma; Chapman and Brook, 1978; Hill et al., 1986; Deino et al., 2002), and in the eastern exposures are overlain with angular unconformity by the middle Pleistocene Kapthurin Formation (Deino and McBrearty, 2002; Blegen, 2017). Present day exposures of the Chemeron Fm occur in two roughly N–S discontinuous patches: (1) a southeastern belt between the Kapthurin and Chemeron Rivers (encompassing the location of BTB13) – the ‘Chemeron Basin,’ and (2) a belt 11–25 km to the northwest extending from Kipcherere, northward through Tabarin and beyond (the ‘Kipcherere/Tabarin Basin’). Previously it was believed that the Kipcherere/Tabarin basin predated the Chemeron Basin by several million years, however recent and ongoing field investigations reveal that both areas extend to ~5 Ma. Exposed strata younger than ~3 Ma are restricted to the Chemeron Basin.
Between 0˚30’N and 0˚35’N in the Chemeron Basin near the drill site, the Chemeron Fm. is preserved within an eastward-dipping structural block frequently cut by ~N-S normal faults. The Ndau, Barsemoi and Kapthurin Rivers and their tributaries expose these strata primarily in east-west major drainages and variably oriented tributary channels to these major rivers. The lithologies exposed are mainly fluviolacustrine beds composed of mudstone, siltstone, and sandstone with intercalations of tuff, diatomaceous sediments, and conglomerate.
Within an area of approximately 5–6 km N-S of the drill site, the Chemeron Fm from 2.7–2.55 Ma is characterized by a distinctive lithologic package of five 2–7 m thick diatomaceous beds, intercalated with fluvial and alluvial fan coarse-grained clastic deposits and tuffs (the oldest of the lacustrine beds is locally represented by a tuffaceous mudstone). Based on the precessionally paced timing of these diatomaceous/fluvial cycles, and their correspondence to an interval of extreme solar-insolation fluctuations at a maximum of earth orbital eccentricity, the succession is interpreted to reflect a narrow interval of orbitally forced wet/dry climatic conditions leading to the abrupt appearance of deep lacustrine
ACCEPTED MANUSCRIPT
paleoenvironments within the axial portion of the rift (Deino et al., 2006; Kingston et al., 2007).
BTB13 was drilled just north of the main Barsemoi River drainage in June, 2013 (location 0.55458°N, 35.93748°E). The location was selected with the intention of sampling the 2.7-2.55 Ma diatomaceous/subaerial cycles toward the top, and downward through strata potentially as old as 4–5 Ma. Technical problems ultimately prevented drilling to depths greater than 228 m. In general, the core is dominated by coarse-grained clastic deposits ranging from muddy fine-grained sandstones to pebble-conglomerates, intercalated with clayey and diatomaceous lacustrine deposits (Westover, this issue; Scott, this issue), and can be subdivided into four main lithologic intervals: (1) a conglomerate- and mudstone-dominated interval at the base (~228 mbs–~201 mbs); (2) a finer-grained clastic-dominated interval with relatively deep lacustrine deposits occasionally present (~201 mbs – ~107 mbs); (3) a second interval with abundant conglomerates (~107 mbs – ~78 mbs); and, (4) an upper interval with diatomaceous and clayey deep lacustrine sediments intercalated with fine-grained clastic sediments (~78 mbs to the top of the core at 5 mbs).
An accurate chronostratigraphic representation of the core, both in terms of absolute age and realistic age uncertainties, is critical for understanding the rates of processes interpreted from the core itself, and for precisely relating core lithostratigraphic events and paleoenvironmental proxies to broader regional and global scale events. We establish four types of chronostratigraphic age control: (1) new 40Ar/39Ar single-crystal K-feldspar dates on tuffs from core samples; (2) new 40Ar/39Ar dating of tuffs correlated to BTB13 by geochemical analyses of outcrop
samples; (3) correlation to the core of a distinctive sequence of thick diatomaceous units whose ages are calibrated through outcrop 40Ar/39Ar dating and
paleomagnetism (Deino et al., 2006; Kingston et al., 2007), and (4) new paleomagnetic reversal stratigraphy from core samples. We then employ Bayesian methods to develop a chronostratigraphic model of BTB13, using the established age control.
3 Methods
3.1 40Ar/39Ar dating
Tuffaceous zones in BTB13 were identified by visual inspection of both the working and archival core halves, examined immediately after core splitting during the Initial Core Description (ICD) sampling phase at the National Lacustrine Core Facility (LacCore) in December 2013. Initial inspection was completed promptly (within minutes to hours of core splitting), to facilitate observation of subtle lithologic variations indicating tephra characteristics and contacts, before later alteration of the surfaces due to drying and oxidation, and to obtain samples for dating prior to other sampling procedures. Possible tuffaceous zones were further examined during the ICD using smear slides and, where identification of shard texture was difficult, by desktop scanning electron microscope (Hitachi TM-1000). Follow-up acquisition of high-resolution core images helped identify further
ACCEPTED MANUSCRIPT
potential tuffaceous horizons, and to provide a stratigraphic context for relevant beds. In total, 56 samples were taken from the working core halves for further processing at the Berkeley Geochronology Center (BGC).
Initial mineral separations were designed to retain all material and employed only distilled water, since follow-up studies such as tephra geochemistry require unaltered material from residual material for analysis. Separations began with gentle disaggregation and wet sieving through a new 90 or 400 micron sieve bag, depending on grain size. K-feldspar in the coarser fraction was concentrated with a Frantz magnetic separator (if necessary), hand-picked, washed in 5% HF and distilled water, and hand-picked again to obtain the clearest, most inclusion-free material. Typically, it was unnecessary to use heavy liquids to separate plagioclase from K-feldspar, as most tephra have only anorthoclase as the feldspar component.
The completed separates for 40Ar/39Ar dating were irradiated in the Cd-lined
CLICIT position of the Oregon State University TRIGA reactor in five batches (BGC irradiation numbers 432 for 2.5 hours, 437 for 2.63 hours, 441 for 7 hours, 449 for 3 hours, and 461 for 4 hours). One irradiation (449) employed sanidine from the Fish Canyon Tuff of Colorado as a monitor mineral (orbitally referenced age of 28.201 ± 0.023 1 Ma (Kuiper et al., 2008), whereas all others used sanidine phenocrysts from the Alder Creek Rhyolite of California (orbitally referenced age = 1.1848 ± 0.0006 Ma (Niespolo et al., 2017). Reactor-induced isotopic production ratios for these irradiations were: (36Ar/37Ar)Ca = 2.65 ± 0.02 × 10⁻⁴, (38Ar/37Ar)Ca = 1.96 ± 0.08
× 10-5, (39Ar/37Ar) Ca = 6.95 ± 0.09 × 10⁻⁴, (37Ar/39Ar) K = 2.24 ± 0.16 × 10⁻⁴,
(38Ar/39Ar) K = 1.220 ± 0.003 × 10⁻², (40Ar/39Ar) K = 2.5 ± 0.9 × 10⁻⁴. Atmospheric 40Ar/36Ar = 298.56 ± 0.31 (Lee et al., 2006) and decay constants follow (Min et al.,
2000). Previously published 40Ar/39Ar ages referenced herein (Deino et al., 2006)
are recalculated for consistency using the decay constants and Fish Canyon sanidine age stated above.
Following a period of at least several weeks of radiological ‘cooling’ after irradiation, the feldspars were analyzed individually by the 40Ar/39Ar technique
using single-crystal incremental heating (SCIH). In the SCIH technique, individual phenocrysts are incrementally heated in 3-10 steps (depending on grain size and gas yield) at progressively increasing power to fusion, to better examine the argon systematics of an individual grain (consistency of release patterns in terms of age, radiogenic content, and chemical composition), more effectively drive off surficial and trapped atmospheric contamination, and maintain fairly consistent gas yields for improved spectrometer detection reproducibility. These detailed analyses were conducted on a Nu Instruments Noblesse noble-gas mass spectrometer, featuring a high-efficiency ionization source and simultaneous multi-isotope measurement using all ion-counting electron multiplier detection systems.
Although incremental heating is a time-consuming process, potentially resulting in analysis of fewer grains than a single-step (total-fusion) approach, the step-heating experiments yield information about the argon systematics of individual crystals that permit testing for geological reliability. Here, we examine the incremental release experiment for calculated age consistency as a function of the fraction of 39Ar released. Grains that have a near-uniform release pattern
ACCEPTED MANUSCRIPT
irregular age patterns. The plateau identification algorithm used here (following Fleck et al., 1977), delineates the set of contiguous steps encompassing the greatest percent of 39Ar release that exhibit an acceptable MSWD (‘mean square of weighted
deviates,’ with a threshold probability >95% that the observed scatter is caused by analytical error alone and that geological scatter is not demonstrated). A plateau must comprise at least 50% of the total 39Ar release and consist of at least three
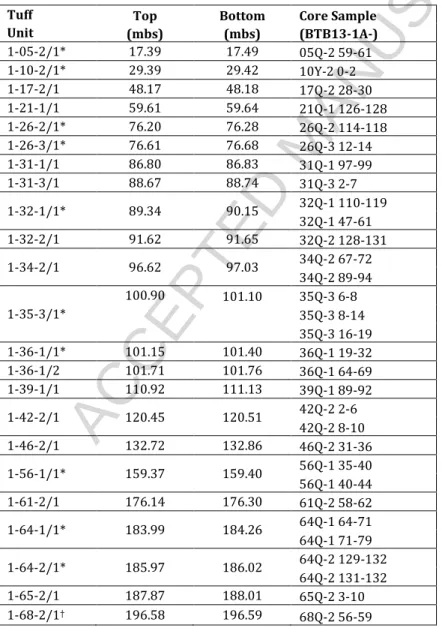
consecutive steps. The age and uncertainty assigned to the plateau are weighted means (weighted by the inverse variance of each step) and modified standard error (standard error expanded by root MSWD if MSWD >1). After single-grain plateau determination, but before computing overall means, individual sample data sets were aggregated by tuff unit (bed as delineated in the core lithostratigraphy) where multiple samples for an individual tuff were processed, for improved statistical power in subsequent data treatment (Table 1).
Table 1. BTB13 tephra units
Tuff Top Bottom Core Sample
Unit (mbs) (mbs) (BTB13-1A-) 1-05-2/1* 17.39 17.49 05Q-2 59-61 1-10-2/1* 29.39 29.42 10Y-2 0-2 1-17-2/1 48.17 48.18 17Q-2 28-30 1-21-1/1 59.61 59.64 21Q-1 126-128 1-26-2/1* 76.20 76.28 26Q-2 114-118 1-26-3/1* 76.61 76.68 26Q-3 12-14 1-31-1/1 86.80 86.83 31Q-1 97-99 1-31-3/1 88.67 88.74 31Q-3 2-7 1-32-1/1* 89.34 90.15 32Q-1 110-119 32Q-1 47-61 1-32-2/1 91.62 91.65 32Q-2 128-131 1-34-2/1 96.62 97.03 34Q-2 67-72 34Q-2 89-94 1-35-3/1* 100.90 101.10 35Q-3 6-8 35Q-3 8-14 35Q-3 16-19 1-36-1/1* 101.15 101.40 36Q-1 19-32 1-36-1/2 101.71 101.76 36Q-1 64-69 1-39-1/1 110.92 111.13 39Q-1 89-92 1-42-2/1 120.45 120.51 42Q-2 2-6 42Q-2 8-10 1-46-2/1 132.72 132.86 46Q-2 31-36 1-56-1/1* 159.37 159.40 56Q-1 35-40 56Q-1 40-44 1-61-2/1 176.14 176.30 61Q-2 58-62 1-64-1/1* 183.99 184.26 64Q-1 64-71 64Q-1 71-79 1-64-2/1* 185.97 186.02 64Q-2 129-132 64Q-2 131-132 1-65-2/1 187.87 188.01 65Q-2 3-10 1-68-2/1† 196.58 196.59 68Q-2 56-59
ACCEPTED MANUSCRIPT
1-68-2/2 196.69 196.74 68Q-2 69-74 1-68-2/3 197.00 197.01 68Q-2 101-102 1-68-3/1*† 197.03 197.37 68Q-3 0-8 68Q-3 8-20 1-70-1/1*† 201.86 202.45 70Q-1 20-22 70Q-1 50-60 70Q-1 60-64 1-75-1/1† 211.48 212.11 75Q-1 33-36 75Q-1 39-46 1-79-2/1† 221.67 221.97 79Q-2 40-51 1-79-3/1 222.52 222.58 79Q-3 5-6 79Q-3 7-8 *Included in age model.†Tuffaceous sandstone
At this stage, the geochronological data consist of a suite of plateau ages derived from analysis of single phenocrysts, perhaps from multiple samples but aggregated on a per-tuff basis obtained for each tuff bed. Computation of an eruptive age from a suite of single-grain ages is often complicated by the occurrence of anomalous results, from sources including xenocrysts, excess 40Ar trapped in primary
phenocrysts, or subtle alteration. Statistical treatments, described below, are taken to mitigate their influence of anomalous ages on the determination of an eruption age.
A similar situation arises from efforts to date the lowest, coarse detrital part of the core where primary tuffs were not available (below ~197 mbs). Several samples of tuffaceous (fine pumice-bearing) coarse-grained sandstone or pebbly conglomerate were dated with the goal of identifying a reasonable eruption age for the primary tuffaceous component. In these cases, the interval between eruption and deposition is not necessarily geologically rapid. Nevertheless the goal of data synthesis is this case is similar to that of a primary tuff: to derive the youngest valid age component to represent the closest approximation of the depositional age of the stratigraphic unit.
A three-stage outlier detection scheme was applied on a unit-by-unit basis to help isolate a potential primary age component. First, distinctly older xenocrysts were excluded from the age population based on a procedure that evaluates age gaps in the ordered age distribution. This algorithm proceeds by testing each analysis against all younger analyses. A gap score is generated by evaluating the magnitude of the age difference for each pair of analyses, divided by their joint error combined in quadrature. If this score exceeds a fixed, pre-established criterion, the older analysis, and all analyses older than it, are deemed outliers and excluded from the age population. An arbitrary criterion for forming this decision (gap score = 7) effectively identifies age gaps obvious to a human observer, but has minimal effect on distributions that lack a visually pronounced modal gap. In two cases (units 1-61-2/1 and 1-79-1-61-2/1), an older mode was not recognized by the gap algorithm, and was eliminated manually. Secondly, outliers were omitted based on their deviation from the median (‘normalized median absolute deviation’ = 2). Only those units with a remaining population count n ≥ 4 were considered adequate for further processing
ACCEPTED MANUSCRIPT
(13 out of the original 27 tuffaceous stratigraphic units). An additional sample (1-34-2/1) was eliminated because of a marginal number of scattered analyses (n =4) with more than double the relative mean age uncertainty of the other tuff units.
Finally, because of the high number of anomalous older ages prevalent in many of the samples, we utilize here a relatively novel approach to identifying a depositional age based on Bayesian estimation (Keller et al., 2018). This method offers an objective technique formulated with minimal pre-conditions, which can be applied universally to the current data set, and to other problematic suites of
40Ar/39Ar ages. First, a mimimally trimmed age data set for each unit was
established using a gap elimination procedure described above (gap = 20). Using this filtered data set, depositional ages were calculated using a Bayesian parameter estimation approach that takes advantage of the ability to construct an informative prior estimate of the relative closure age distribution, the form of which is a characteristic of the physical processes responsible for the heterogeneity of Ar-Ar closure ages in a given tephra horizon. In particular, we know a priori that although inherited, xenocrystic, or detrital grains may predate deposition, no 40Ar/39Ar ages
may postdate deposition, except due to analytical uncertainty. Consequently, we expect a relative distribution of true single-crystal closure ages that is sharply truncated at the time of deposition. Empirically, we observe that this distribution tends to take a roughly triangular form, with a greater number of ages clustered around the youngest single age. Considering both our requirement for a sharp truncation at deposition and the form of the observed (bootstrapped) distribution, we find that a simple triangular distribution effectively encapsulates our prior expectation for the relative distribution of individual crystal ages in a given sample. Since the deposition age acts as a parameter (the minimum) of our closure age distribution (formally an array of hyperparameters), we use a likelihood-based approach to estimate the value and uncertainty of this parameter and thus the depositional age for each sample.
3.2 Tephrochemical correlation
Glass shards and feldspars of BTB13 core tephra were analyzed for major, minor, and trace elements using EMPA and LA-ICP-MS at Arizona State University and the Carnegie Institute of Washington, respectively, for the purposes of identifying core-to-outcrop correlations (Garello et al., 2019). We use glass shard over feldspar fingerprinting as the predominant data for establishing correlations. Glass shard chemical analysis is a widely used method and has been proven to be an accurate way to assess tephra correlation (Kuehn et al., 2011; Lane et al., 2011; Lane et al., 2013; Lowe, 2011; Pearce et al., 2012). Feldspar phenocrysts are analyzed for geochemical correlations where glass shards are absent in targeted BTB core tephra. Due to the generally wide range in compositions within a tephra and indistinct feldspar populations in this study, tephra age, stratigraphic positioning, and glass shard analyses, when applicable, are used as primary correlative determinants. Correlations based solely on feldspar are considered tentative.
ACCEPTED MANUSCRIPT
3.3 Age calibration of core diatomaceous beds
We previously documented the occurrence of a 2.68–2.58 Ma, precessionally paced succession of five, 3–7 m thick, laterally persistent white diatomaceous beds intercalated in the fluviolacustrine sedimentary succession of the middle Chemeron Fm in the Barsemoi River area (numbered for reference from oldest to youngest ‘Diatomite 1’ or ‘D1,’ through ‘Diatomite 5’ ‘D5’) (Deino et al., 2006; Kingston et al., 2007). Field investigations in 2018 demonstrated that the lowest of these beds (D1) is expressed as a diatomaceous lacustrine mudstone near to the core site, and as diatomite further north. These five lacustrine beds are exposed just hundreds of meters north of the plateau on which the BTB13 drill site is situated, approximately along strike of the general bedding attitude, and so it was anticipated that this succession would also be identified in the upper part of the core. Four prominent diatomites and a relatively deep-water clayey lacustrine bed were observed in the upper part of BTB13, ranging in thickness from 2 to 7 m, and roughly equally spaced stratigraphically from 8.6 to 52.8 mbs. Correlation of the second diatomite from the top in the core is supported by the identification of a geochemically linked ash bed near the top of D4 in outcrop, as described above. Previous studies of the diatomite-dominates succession in the Barsemoi River drainage established the abrupt nature of the upper and lower contacts of the diatomaceous lacustrine facies (Deino et al., 2006; Kingston et al., 2007). These lithostatic boundaries are considered to provide approximate time-lines from section to section in outcrop, and into the core.
(Deino et al., 2006) employed the longest, most complete measured section near the Barsemoi River as a reference section for understanding detailed chronostratigraphic relationships (Section A–A’). Eight tuff units were dated by the single-crystal total-fusion (‘SCTF’) 40Ar/39Ar technique: three above the
diatomaceous sequence; three above/within/and below D4; and two below the entire succession. These ages encompass a stratigraphic interval of 178 m and range from 2.922 to 2.390 Ma. Interpolated ages for the upper and lower contacts of diatomaceous horizons were calculated assuming linear sedimentation rates between the dated tuffs that bracket the interval.
Two modifications to the data and approach in (Deino et al., 2006) were utilized here to provide more accurate correspondence to the current analysis. All
40Ar/39Ar ages have been recalculated for consistency with the decay constants and
standard ages used herein. Also, rather than use step-wise line segments between dated tuffs in the stratigraphic succession (Deino et al., 2006), we have applied the same Bayesian stratigraphic analysis to these legacy data as used for BTB13 chronostratigraphy (methods described in 3.5). The control points (40Ar/39Ar ages and depths in section A, Deino et al., 2006) are provided in Table S3.
3.4 Paleomagnetism methods
The following is a summary of the magnetostratigraphic analytical technique applied to BTB13 (Sier, this issue). Magnetostratigraphy relies on identifying paleomagnetic directions of either normal polarity with declination towards the north and positive downward inclinations or reversed polarities with declination
ACCEPTED MANUSCRIPT
towards the south and negative downward inclinations (inclinations are opposite in the southern hemisphere). Due to the rotational movement of the core during the coring process, the azimuthal orientation of the recovered core segments has been lost. Generally, normal or reversed magnetic polarities can still be recovered by positive or negative paleomagnetic inclination respectively. However, this method cannot be employed at low equatorial latitudes such as the BTB13 site (0° 33’ N latitude), due to near zero paleomagnetic inclinations. Two methods are used to overcome this difficulty (Sier et al., 2017). The first reorients the core segments with respect to the azimuth of the bedding dip direction (assumed constant) preserved in the sedimentary fabric and expressed in the anisotropy of the magnetic susceptibility (AMS). This method requires there be a significant difference (>10°) between the coring dip and the perpendicular of the bedding dip. The second method takes advantage of the presence of secondary viscous remanent magnetization oriented in the present day field, thus providing a reference for re-orientating core segments (Sier et al., 2017; Sier, this issue).
A total of 567 paleomagnetic samples were taken at 543 levels of BTB13 resulting in an average spatial resolution of 0.41 cm. A first set of 100 samples throughout the core were carefully demagnetized to identify Characteristic Remanent Magnetization (ChRM) and the possible stratigraphic locations of paleomagnetic reversals. Further sample analyses were conducted in the intervals of possible magnetic reversals to achieve the highest degree of resolution possible with the available sample set. From the original 567 samples, 262 were sufficient to identify the reversals. These samples were fully thermally demagnetized to 600° C in either 12 or 14 temperature steps using an ASC thermal demagnetizer with a residual field lower than 20 nT. After each temperature step the remaining Natural Remanent Magnetization (NRM) was measured with a 2G DC-SQUID cryogenic magnetometer. Paleomagnetism.org, an online multi-platform open source environment for paleomagnetic data analysis, was used to interpret the demagnetization results and identify the ChRM directions (Koymans et al., 2016). 3.5 Bayesian stratigraphic age modeling
The primary goal of this study is to produce a continuous age-depth model for BTB13 using all available constraints – including the core depositional ages obtained from the 40Ar/39Ar age spectra by the first MCMC inversion,
tephrocorrelation, diatomaceous beds and tuff ages correlated from outcrop, and paleomagnetic reversal ages. Finally, control points with exaggerated uncertainties are added at the top and bottom of the core to better constrain the trend of the model extrapolation. All BTB13 chronostratigraphic control points are then together used to constrain the final core age-depth model.
In order to obtain a consistent age-depth model that accurately incorporates all available age constraints, we again use a Bayesian method based on the Metropolis algorithm. The algorithm requires us to calculate the likelihood of obtaining the observed data from a given model, adjust the proposed model, and accept that proposal with a calculated probability. We calculate the model for equally spaced points (20 cm) throughout the depth of the core. This age model is
ACCEPTED MANUSCRIPT
directly constrained in two ways: (1) it must be monotonically non-decreasing with depth; and (2) the likelihood of the observed data corresponding to a proposed given model is readily calculated given the uncertainty of each data point and its absolute deviation from the proposed model age at the same depth. In this way, only the model point closest in depth to a given observed age is directly constrained by that observed age, but each model point is indirectly constrained by every data point through our constraint of superposition.
As before, the proposed model is perturbed by a symmetric Gaussian proposal distribution, changing only one model parameter at a time (i.e., the age at a single depth). However, after this perturbation, adjacent model points may be moved in time as necessary to preserve superposition: any points adjacent to our perturbed point that would violate superposition are immediately adjusted to have an age equal to the proposed age for our perturbed point, thus maintaining a monotonically non-decreasing model with depth. Consequently, although the model may appear underdetermined given that the number of parameters (number of model age-depth points) generally far exceeds the number of data, the constraint of superposition introduces a strong covariance structure to the model that effectively decreases the number of model degrees of freedom. The set of all accepted proposals provides our age model mean and uncertainty.
4 Results
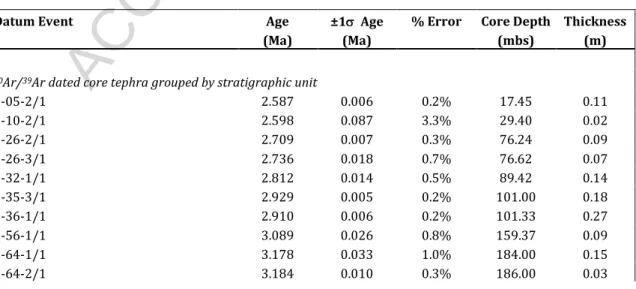
Table 2 shows the final set of chronostratigraphic data supporting a Bayesian age model of BTB13, consisting of five data types: (1) 40Ar/39Ar ages obtained
directly from core samples; (2) 40Ar/39Ar ages of outcrop tuffs correlated into
BTB13; (3) diatomaceous bed top and bottom ages calibrated in outcrop, and correlated into the core; (4) paleomagnetic reversal boundaries; and (5) points derived from linear extrapolation of sediment accumulation rates to the top and bottom of the core. Each of these data types is discussed below.
Table 2. Age model chronostratigraphic data set
Datum Event Age ±1 Age % Error Core Depth Thickness
(Ma) (Ma) (mbs) (m)
40Ar/39Ar dated core tephra grouped by stratigraphic unit
1-05-2/1 2.587 0.006 0.2% 17.45 0.11 1-10-2/1 2.598 0.087 3.3% 29.40 0.02 1-26-2/1 2.709 0.007 0.3% 76.24 0.09 1-26-3/1 2.736 0.018 0.7% 76.62 0.07 1-32-1/1 2.812 0.014 0.5% 89.42 0.14 1-35-3/1 2.929 0.005 0.2% 101.00 0.18 1-36-1/1 2.910 0.006 0.2% 101.33 0.27 1-56-1/1 3.089 0.026 0.8% 159.37 0.09 1-64-1/1 3.178 0.033 1.0% 184.00 0.15 1-64-2/1 3.184 0.010 0.3% 186.00 0.03
ACCEPTED MANUSCRIPT
1-68-3/1 3.215 0.007 0.2% 197.14 0.20
1-70-1/1 3.208 0.036 1.1% 202.21 1.08
40Ar/39Ar dated outcrop tuffs correlated into core
Unit B (BARS97-6) 2.604 0.005 0.2% 17.45 0.11
Unit H (upper; BARS/94-3) 2.732 0.007 0.3% 76.24 0.07
Unit H (lower; BARS/94-7; BARS/94-9c) 2.738 0.007 0.3% 76.62 0.07
Unit J (BARS94-2) 2.922 0.012 0.4% 101.16 0.46
Diatomite top/bottom contacts
D5 top 2.580 0.007 0.3% 8.64 0.01 D5 bottom 2.588 0.007 0.3% 10.87 0.11 D4 top 2.603 0.003 0.1% 15.21 0.01 D4 bottom 2.610 0.003 0.1% 22.34 0.01 D3 top 2.622 0.007 0.3% 25.27 0.01 D3 bottom 2.635 0.009 0.3% 32.42 0.01 D2 top 2.654 0.010 0.4% 41.43 0.01 D2 bottom 2.661 0.011 0.4% 43.48 0.01 D1 top 2.677 0.011 0.4% 50.33 0.01 D1 bottom 2.685 0.011 0.4% 52.77 0.01
Paleomagnetic reversal boundaries
Matuyama/Gauss 2.602 0.013 0.5% 19.79 0.20
Upper Kaena 3.032 0.015 0.5% 125.86 0.60
Lower Kaena 3.116 0.015 0.5% 154.64 0.29
Upper Mammoth 3.207 0.015 0.5% 199.63 0.49
Sediment accumulatioin rate extrapolations at top and bottom of core
Top extrapolated from upper ~75 m 2.56 0.2 7.8% 0.00 1.00
Bottom extrapolated from lower ~100 m 3.28 0.2 6.1% 228.00 1.00 4.1 Chronostratigraphic data from direct 40Ar/39Ar dating of BTB13 tuffs
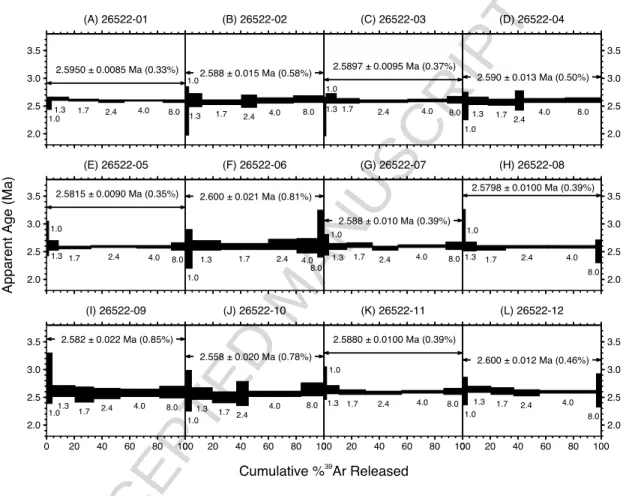
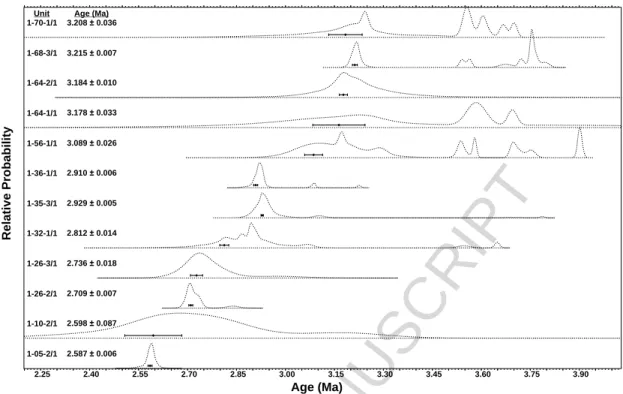
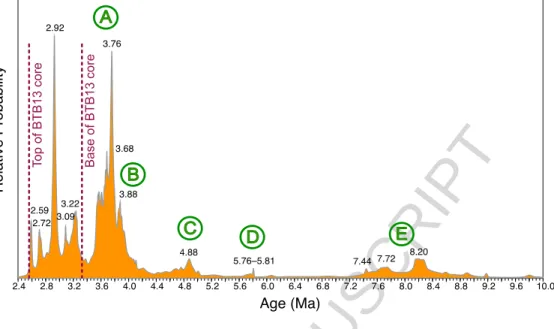
A total of 3,026 SCIH steps on 867 phenocrysts from 43 samples were analyzed (Table S1). 454 of these phenocrysts were rejected as candidates for complete step-heating analysis, after evaluation of one or two low-power steps, due to obviously old xenocrystic ages or high Ca/K content (indicative of plagioclase and an anticipated low-precision result), whereas the remainder (413 grains) were carried to completion (example spectra are provided in Figure 2). A dominant proportion of the grains carried to completion in the SCIH experiments yielded apparent-age plateaus (398 out of 413 grains, Table S2). The apparent-age plateaus are plotted as age-probability density functions in Figure 3, for each stratigraphic unit included in the age model (see Figure SX for probability plots for each tuff unit individually). Whereas some units approach simple unimodal Gaussian-like distributions (i.e., unit 1-36-1/1), most exhibit multimodality with ages much older
ACCEPTED MANUSCRIPT
than the inferred stratigraphic age (~3.4–2.6 Ma upward); these older grains are interpreted as xenocrysts incorporated during eruption, transportation and deposition. Abundant xenocrystic contamination is especially evident in the lower ~25 meters of the core, where tuffaceous sandstone and gravel units were sampled in an attempt to obtain chronologic control in a zone devoid of primary tuffs. After outlier elimination procedures and Bayesian age estimation as described above, a suite of 12 40Ar/39Ar tuff ages were derived, from 17.45–202.21 mbs in the core. The
median uncertainty is 0.4%, with a maximum of 3.3% and minimum of 0.2%.
Figure 2. Representative 40Ar/39Ar incremental heating release spectra for 12
individual K-feldspar grains from stratigraphic unit 1-05/2/1 (full analytical data for all samples are provided in Table S2). Double-barbed arrow indicates the range of heating steps (black boxes) included in the apparent age plateau, with the plateau age given (± 1 uncertainty). Numbers below or to the side of each step give the laser wattage of the gas extraction phase of the analysis.
ACCEPTED MANUSCRIPT
Figure 3. Age-probability density plots of the inferred primary eruptive mode of tuff units included in the age-modeling chronostratigraphy (Table 2). Ages shown as horizontal error bars (with 1 uncertainty) are posterior estimates derived from the Bayesian depositional age modeling described in section 3.5. Dashed line represents age-probability density curve of all step-heating plateaus for a given tuff unit; light grey is the curve after application of the gap outlier algorithm (gap = 20); and the dark grey curve is the Bayesian posterior probability distribution.
4.2 Chronostratigraphic data from correlation of outcrop-dated tuffs to BTB13 Detailed discussion of the geochemical correlation effort, using glass and feldspar phenocrysts from tephra deposits, is provided in (Garello et al., 2019), and summarized here. 40Ar/39Ar age control is available for each potential outcrop
sample, and preliminary model core ages employing the other chronostratigraphic control data types identify an appropriate time interval for comparison of outcrop-to-core tuff geochemistry.
Although geochemical analysis of glass shards is preferred for our correlation study, glass is preserved in only four BTB13 tephra, all from the upper half of the core (Figure 4; Garello et al., 2019), and only one of these could be correlated to outcrop exposures. The uppermost glassy tephra in the core (5Q-2 (59-61 cm)) is found ~0.5 m below the top of Diatomite 4 at 17.45 mbs. This sample is a good match chemically for glass from previously dated BARS97-6, from outcrops 0.37 km to the southwest of the drill site where this tuff occurs within diatomaceous mudstone also at the top of Diatomite 4 (tephra ‘Unit B’ of Deino et al., 2006). Unit B
2.25 2.40 2.55 2.70 2.85 3.00 3.15 3.30 3.45 3.60 3.75 3.90 1-70-1/1
Unit Age (Ma)
1-68-3/1 1-64-2/1 1-64-1/1 1-56-1/1 1-36-1/1 1-35-3/1 1-32-1/1 1-26-3/1 1-26-2/1 1-10-2/1 1-05-2/1 Age (Ma) R e la ti v e P ro b a b il it y 2.587± 0.006 2.598± 0.087 2.709± 0.007 2.736± 0.018 2.812± 0.014 2.929± 0.005 2.910± 0.006 3.089± 0.026 3.178± 0.033 3.184± 0.010 3.215± 0.007 3.208± 0.036
ACCEPTED MANUSCRIPT
is found across 3 km within stratigraphic sections E, H, and I (Figure 1; Deino et al., 2006; Kingston et al., 2007).
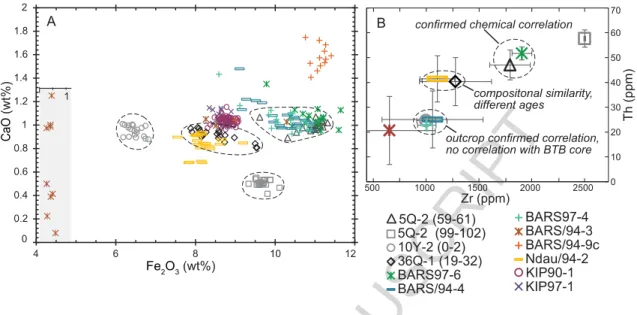
Figure 4. Bivariate compositional plots of glass shard chemistry from BTB13 (grey and black symbols) and Chemeron Fm outcrop tephra (colored symbols). A) Normalized weight percent CaO vs Fe2O3 for individual glass shards. Dashed fields
indicate the range of the BTB13 tephra. Grey box highlights BARS94-3 shard compositions at an expanded horizontal scale. B) Th vs Zr average composition. Dashed fields encircle compositional similar samples. Sample names beginning with numbers refer to BTB13 core segments; names beginning with ‘BAR’ are from nearby outcrops in the Barsemoi River drainage (Deino et al., 2006); KIP97-1 and KIP90-1 are Chemeron Fm outcrop samples collected from a tuff at the Kipcherere locality 10.5 km to the northwest, with an unpublished age 40Ar/39Ar of ~3.20 Ma;
and NDAU/94-2 is a tuff from the Chemeron Fm 2.7 km southwest of the drill site with an unpublished 40Ar/39Ar age of ~3.72 Ma.
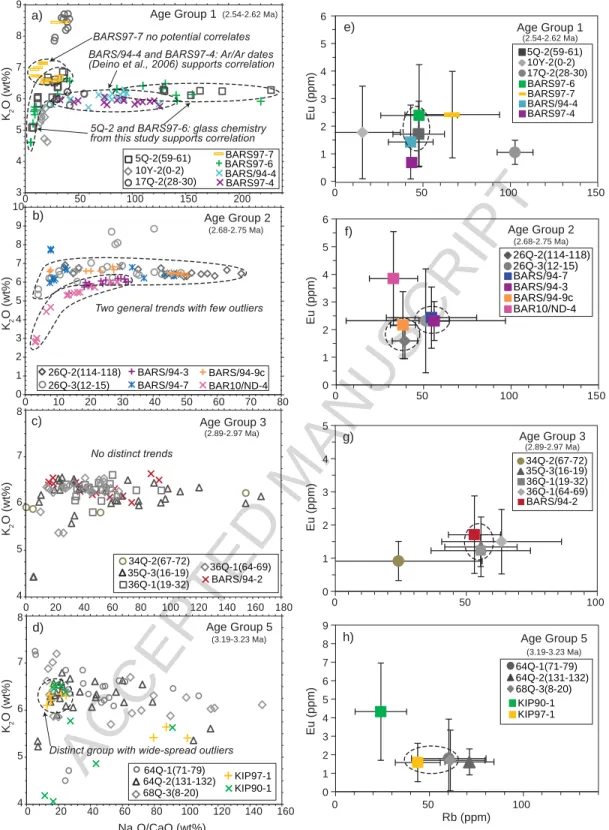
Feldspar phenocryst chemistry in the trachytic assemblage of tephra compositions exhibited by the Chemeron Formation is not as diverse, and often exhibits more within-sample scatter than corresponding volcanic glass. Nevertheless, the geochemical characterization helps to establish three correlations between nearby outcrops to the upper third of BTB13 (Figure 5). Feldspar phenocrysts were separated from 13 core samples and divided into five age groups (2.54–2.62, 2.68–2.75, 2.89–2.97, 3.11–3.16, and 3.19–3.23 Ma) as a means of narrowing the potential number of correlative outcrop tuffs (Garello et al., 2019). In Age Group 1 (2.54–2.62 Ma), feldspar phenocryst compositional results support the glass shard geochemical correlation between 5Q-2 (59-61) with BAR97-6. Age Group 2 (2.68–2.75 Ma) supports a geochemical link between outcrop tuffs BARS/94-7 and BARS/94-9c with a single thick tephra depositional event represented by two core samples separated by ~40 cm: 26Q-2 (114-118) and 26Q-3 (12-14). The two outcrop samples occur in similar fault-repeated sections 200 m
ACCEPTED MANUSCRIPT
apart in the Barsemoi River drainage, and there is a high likelihood they represent the same eruptive event on geochronologic, lithologic, and stratigraphic grounds: these were grouped together as ‘Unit H’ of (Deino et al., 2006). However, the feldspar chemistry, as well as the glass chemistry mentioned above, distinguishes these outcrop samples from BARS/94-3, previously also grouped in Unit H (Deino et al., 2006). This sample was collected further away (760 m), and the hypothesized equivalence to BARS/94-7 and BARS/94-9c is now shown to be incorrect. In Age Group 3 (2.89–2.97 Ma), outcrop sample BARS/94-2 exhibits good overlap with core tephras 35Q-3 (16-19), 36Q-1 (19-32), and 36Q-1 (64-69) in Figure 5. However, in overall elemental comparisons (Garello et al., 2019), 36Q-1 (64-69) does not adequately overlap, thus is excluded from correlation. Age Group 4 (3.11–3.16 Ma) feldspar analyses did not result in any identifiable correlations. Within Age Group 5 (3.19–3.23 Ma), a weak correlation is identified between Chemeron Fm outcrop samples KIP97-1 and KIP90-1 (both collected from the same tuff in an outcrop in the Kipcherere locality 10.5 km to the northwest, with an unpublished age of ~3.20 Ma) and core sample 68Q-3 (8-20). However, the core sample represents pumice fragments in coarse sandstone, present at various levels in this part of the core, thus it is problematic to identify the best level of an emplacement event for primary tephra. Because the correlation is only weakly substantiated, and since the correlative core sample is poorly defined, these outcrop samples are excluded from the BTB13 age model.
ACCEPTED MANUSCRIPT
Figure 5. Bivariate compositional plots of feldspar phenocryst chemistry from BTB13 (grey and black symbols) and Chemeron Fm outcrop tephra (colored symbols), divided into five age groups. Dashed fields delineate compositional similarity and potential correlation. A-D) Normalized K2O vs Na2O/CaO of individual
crystals. E-H) Eu vs Rb sample averages, with standard deviation bars. Sample Age Group 1 3 4 5 6 7 8 9 0 50 100 150 200
5Q-2 and BARS97-6: glass chemistry from this study supports correlation BARS/94-4 and BARS97-4: Ar/Ar dates (Deino et al., 2006) supports correlation
BARS97-7 no potential correlates
BARS/94-4 BARS97-4 BARS97-6 5Q-2(59-61) 10Y-2(0-2) 17Q-2(28-30) BARS97-7 0 1 2 3 4 5 6 7 8 9 10 0 10 20 30 40 50 60 70 80
Two general trends with few outliers
Age Group 2 26Q-2(114-118) 26Q-3(12-15) BARS/94-3 BARS/94-7 BARS/94-9c BAR10/ND-4 Na2O/CaO (wt%) 4 5 6 7 8 0 20 40 60 80 100 120 140 160 Age Group 5
Distinct group with wide-spread outliers
64Q-2(131-132) 68Q-3(8-20) KIP97-1 KIP90-1 64Q-1(71-79) 4 5 6 7 8 0 20 40 60 80 100 120 140 160 180 No distinct trends Age Group 3 BARS/94-2 34Q-2(67-72) 35Q-3(16-19) 36Q-1(19-32) 36Q-1(64-69) E u (p p m ) Rb (ppm) 0 1 2 3 4 5 6 0 50 100 150 E u (p p m ) E u (p p m ) E u (p p m ) 0 1 2 3 4 5 6 7 8 9 0 50 100 0 1 2 3 4 5 6 0 50 100 150 0 1 2 3 4 5 0 50 100 K2 O (w t% ) K2 O (w t% ) K2 O (w t% ) K2 O (w t% ) a) b) c) d) 34Q-2(67-72) 35Q-3(16-19) 36Q-1(19-32) 36Q-1(64-69) BARS/94-2 Age Group 3 (2.89-2.97 Ma) 5Q-2(59-61) 10Y-2(0-2) 17Q-2(28-30) BARS/94-4 BARS97-7 BARS97-4 BARS97-6 Age Group 1 (2.54-2.62 Ma) 26Q-2(114-118) 26Q-3(12-15) BARS/94-7 BARS/94-3 BARS/94-9c BAR10/ND-4 Age Group 2 (2.68-2.75 Ma) e) f) g) h) (2.54-2.62 Ma) Age Group 5 (3.19-3.23 Ma) 64Q-1(71-79) 64Q-2(131-132) 68Q-3(8-20) KIP90-1 KIP97-1 (3.19-3.23 Ma) (2.89-2.97 Ma) (2.68-2.75 Ma)
ACCEPTED MANUSCRIPT
names are designated as per Figure 4, with the addition of sample BAR10/ND-4, a tuff from the Chemeron Fm 2.6 km southwest of the drill site with an unpublished
40Ar/39Ar age of ~2.73 Ma.
4.3 Chronostratigraphic data from correlated diatomaceous beds
The Bayesian stratigraphic model for the outcrop section discussed in 4.6 is provided in Table S4. Resulting interpolated ages for the diatomaceous bed boundaries are listed in Table 2, which include the ages, their uncertainties, and positions of these strata boundaries serving as outcrop age input into the BTB13 age model.
4.4 Chronostratigraphic data from BTB13 paleomagnetic reversal stratigraphy
The method of reorienting core segments using bedding dip azimuth identified by AMS could not be used in the case of BTB13 due to variable coring dip and dip directions, and perpendicularity of coring dip to bedding dip through large intervals of the core. Instead, secondary overprints oriented in the present-day field were used to orientating the core paleomagnetic directions (Sier, this issue).
Demagnetizations yielded straightforward paths decreasing steadily towards the origin. In most samples, two components are clearly identified, from room temperature to ca. 150-250°C, and from ca. 175-250°C up to 550-600°C. The high temperature component, probably carried by titanomagnetite, is interpreted as a primary component acquired shortly after the time of deposition. The low temperature component is interpreted as a secondary normal overprint due to its typical orientation either parallel or antiparallel to the high temperature component. These parallel or antiparallel component configurations were used to identify, respectively, normal or reversed polarity directions of the high temperature component. By rotating the low temperature component directions toward the north, and rotating the high temperature component directions by the same amount, we could determine the original directions of the high temperature primary magnetizations. These re-orientated high temperature ChRM directions plotted versus depth define five polarity zones separated by four reversals situated at 19.79 ± 0.1 mbs, 125.86 ± 0.3 mbs, 154.64 ± 0.145 mbs and 199.635 ± 0.245 mbs respectively (Sier, this issue). Based on the chronostratigraphic data presented above we have correlated unequivocally the polarity zones from top to bottom for the Matuyama, Gauss, Kaena, and Mammoth chrons.
The paleomagnetic data points use reversal ages provided in the 2012 geomagnetic polarity time scale of (Ogg et al., 2012) (‘GPTS12’), with the exception of the Gauss–Matuyama transition. Several alternative ages for this reversal are older than the GPTS12 age of 2.581 Ma. One relevant analysis is that of (Deino et al., 2006) on the age of the reversal as identified and calibrated in D4 of the Barsemoi River drainage, at 2.606 ± 0.003 Ma. (Lisiecki and Raymo, 2005) place the boundary at 2.608 Ma based on a stack of 57 globally distributed marine benthic 18O records.
ACCEPTED MANUSCRIPT
Range, Oregon-Washington, indicate that this transition is older than 2.632 ± 0.009 Ma (Hagstrum et al., 2017). In order to maintain independence of the magnetostratigraphic and 40Ar/39Ar chronostratigraphic control points in the age
model, we omit from consideration the (Deino et al., 2006) result for the G/M boundary, but instead choose as a representative value the median of the GPTS12, marine stack, and Boring volcanic field results, or 2.608 Ma.
4.5 Extrapolated data points at core boundaries
In order to realistically model the extrapolated upper and lower bounds of the core beyond the limits of the measured constraints (i.e., above 8.64 and below 202.2 mbs), control points were added based on sediment accumulation rates proximal to the top and bottom of the core (i.e., within ~75 m of the top and 100 m of the bottom) – a point at 0 mbs (2.56 Ma), and another at the bottom of the core at 228 m (3.28 Ma). Very large uncertainties (± 0.2 Ma) were assigned to these points to avoid constraining the model confidence limits in the extrapolated areas.
4.6 Bayesian age model
BTB13 extends to 228 mbs, with excellent recovery (94.3%) in all but the uppermost 5 m, where the loss is attributable to disruption from surface regolith processes. Four classes of chronostratigraphic control points have been acquired, encompassing 85% of the core depth, from ~8.6–202.2 mbs (Table 2). The Bayesian chronology model presented here is based principally upon these control points, with linear extrapolation of the A–B interval upward, and the D–G interval downward (Figure 6; Table S5). The downward extrapolation, to a maximum of ~3.29 Ma at the base of the core, is consistent with the non-observation of the lower Mammoth paleomagnetic reversal (APTS12 age of 3.330 Ma) that is expected to lie beneath the maximum core interval recovered. It should be emphasized that the extrapolated portions of the model (0–8.6 and 202.2–228 mbs) are speculative and not as reliable as the 85% of the model bracketed by chronostratigraphic control points; this is consistent with confidence intervals in these extrapolated areas that increase rapidly with distance from the control points A and G (Figure 6.6).
ACCEPTED MANUSCRIPT
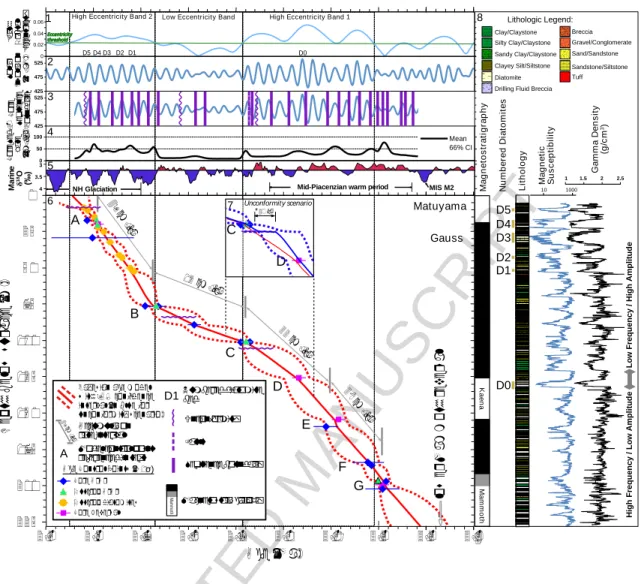
Figure 6. Graph of the BTB13 age model and chronostratigraphic control points, plotted against ancillary data sets. (7.1) Earth orbital eccentricity (Laskar et al., 2004). (7.2) Solar insolation calculated for 30°N latitude on June 21 (Laskar et al., 2004). Also shown are the modeled ages of diatomaceous beds D1–D5 observed in the upper part of the core (7.3). Sequence stratigraphic boundaries interpreted from BTB13 (Scott et al., this issue). (7.4) Sediment accumulation rate curve derived from the Bayesian stratigraphic age model at 10 cm intervals, with estimated 66% confidence interval. (7.5) LR04 marine benthic 18O stack (Lisiecki and Raymo,
2005) as a proxy for global ice volume. Intervals of high (blue) vs. low (red) ice volume are emphasized at a 18O threshold of 3.75‰. (7.6) BTB13 Bayesian
stratigraphic age model (red) with 95% confidence interval (red dashed area). (7.7) Speculative alternative Bayesian stratigraphic age model (blue solid line), accommodating missing section of ~40 ka duration at the fault identified in the core lithostratigraphy. (7.8) BTB13 magnetostratigraphy, diatomaceous bed location and nomenclature, lithology, magnetic susceptibility, and gamma density measurements, plotted against core depth (mbs).
G a m m a D e n s it y (g /c m 3)
Mid-Piacenzian warm period
Co re Se d. R at e (c m /k a) Mean 66% CI 0.06 0.04 0.02 0 Ea rt h O rb it al Ec ce nt ri ci
ty 1 High Eccentricity Band 2 Low Eccentricity Band High Eccentricity Band 1
2.5 2.6 2.7 2.8 2.9 3.0 3.1 3.2 3.3 3.4 A ge(M a) 49 cm /ka 12 cm/ka 32 cm /ka 38 cm /ka F lo w er M am m ot h re ve rs al 0 25 5 0 75 100 125 15 0 175 200 225 D ep th b el o w su rf ac e (m ) Unconformity Fault Sequenceboundary Magnetostra�graphy M am m oth Numbereddiatomite bed D1 49cm /ka Accumula�on rateinterval
A Modelcontrreferencedintexolpointst C ore A rA r
C ore Revers als O utcrop A rA r O utcrop diatom ites A geC ontrolPoints (± 1σ)
Bayes ian agem odel w ith 95 % confidence interval(in bluefor unconform itys cenario)
Gauss Matuyama K a e n a M a m m o th A B C D E G 1 1.5 2 2.5 10 1000 M a g n e ti c S u s c e p ti b il it y L it h o lo g y N u m b e re d D ia to m it e s M a g n e to s tr a ti g ra p h y D5 D4 D3 D2 D1 D0 Co re Se qu en ce B ou nd ar ie s 3 4 D5 D4 D3 D2 D1 D0 425 475 525 425 0 50 100 4 3.5 3 475 525 So la r In so la � on (W /m 2) 2 5 ~ 40ka C D Unconformity scenario 7 6 M a ri n e 1 8O (‰ ) MIS M2 8 L o w F re q u e n c y / H ig h A m p li tu d e H ig h F re q u e n c y / L o w A m p li tu d e NH Glaciation Breccia Sandstone/Siltstone Tuff Gravel/Conglomerate Sand/Sandstone Clay/Claystone Silty Clay/Claystone Diatomite Sandy Clay/Claystone Clayey Silt/Siltstone
Drilling Fluid Breccia Lithologic Legend:
ACCEPTED MANUSCRIPT
The model is particularly well constrained by multiple reinforcing data types at ~20 mbs (~2.61 Ma or the point marked ‘A’ in Figure 6.6, by core and outcrop
40Ar/39Ar ages, the location of the Gauss/Matuyama boundary in the core, and ages
on diatomaceous bed boundaries), 76 mbs (~2.72 Ma or ‘B’, by core and outcrop
40Ar/39Ar ages), 101 mbs (~2.92 Ma or ‘C’, by core and outcrop 40Ar/39Ar ages), and
~184–202 (~3.18–3.22 Ma or ‘G’, by core and outcrop 40Ar/39Ar ages and the
location of the upper Mammoth chron boundary). Other than the extrapolations to the top and bottom of the core as noted above, the model is probably most vulnerable to absolute error in age where only paleomagnetic reversals provide constraints, or the core 40Ar/39Ar ages are relatively imprecise –– between 101 and
184 mbs (C and F). It is possible, because of the method used to determine the paleomagnetic reversal stratigraphy, that the core position of the upper Kaena paleomagnetic subchron boundary might be higher than observed, and the lower boundary might be lower, if normal overprints were effective in removing the original reversed magnetic orientation or if no overprints are present. In regards to the lower bound of the Kaena reversed interval (154.6 mbs, APTS12 age of 3.116 Ma), stratigraphic agreement would be improved relative to a fairly imprecise outcrop 40Ar/39Ar age (159.4 mbs; 3.089 ± 0.026 Ma) by placement of the
paleomagnetic boundary lower in the core. The Bayesian model takes this stratigraphic age reversal into account by deviating slightly toward the outcrop age, but is dominantly controlled in this interval by the more precise lower Kaena age and position. The model varies smoothly from B–G (~2.72 Ma down to 3.22 Ma, encompassing the Kaena interval), without major kinks in sediment accumulation rate that might be impetus for re-examination of the model assumptions.
The interval C–D may, alternatively, feature upward continuation of the sediment accumulation rates observed through D–G, to a level just below C (Figure 6.7). Two features of the core below C suggest hiatuses: (1) a brecciated fault zone at 103.61 mbs; and (2) fluvial incision at 106.69 mbs that appears to remove several meters of sediment. Here, profundal lacustrine deposits are erosionally incised and overlain by conglomerate, and do not follow the predicted succession of facies as seen elsewhere in BTB13, likely representing a significant discontinuity where Walther’s Law has been broken. A variant of the reference Bayesian stratigraphic age model was calculated to test the influence of a ~40 ka hiatus at 106.69 mbs (Table S6). The duration of the hiatus is approximated to maintain steady sediment accumulation rates for the G–C interval. This variant has the principal effect of increasing model ages progressively from near point D to a maximum of 35 ka just below the hiatus. Almost two full precessional cycles are lost. Although this hiatus model is not adopted as the reference model for BTB13, events within this interval should be considered in light of this potential scenario.
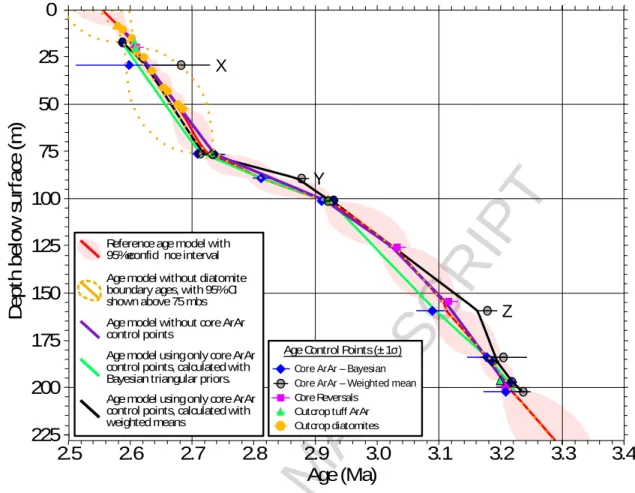
Figure 7 compares several further variations of the Bayesian stratigraphic age model at 50 cm resolution, using various combinations of the types of chronostratigraphic control points (Table S6). The reference model is provided for comparison with its 95% confidence interval. A separate model was generated by omitting all core 40Ar/39Ar age control in order to examine sensitivity to this data
type. As shown in Figure 7, the result is almost identical to the reference model, with departures reaching a maximum of ~20 ka in a limited part of the core at ~80 mbs
ACCEPTED MANUSCRIPT
(Point Y, Figure 7). Likewise, a model based only on the core 40Ar/39Ar ages (green
line, Figure 7) follows closely in the upper half of the sequence to about 100 mbs both the reference and the model lacking the core 40Ar/39Ar data set (purple line).
However, from 100–175 mbs the departure is quite significant (up to ~35 ka) due to the lack of important paleomagnetic reversal control points. Thirdly, Figure 7 illustrates a model based only on core 40Ar/39Ar control points, but with their age
calculated using weighted means of the plateau ages, an alternative approach to the Bayesian technique used above. Although most of the outcrop 40Ar/39Ar control
points are very similar in age and uncertainty, several stratigraphic units exhibit 2.3–3.2% deviation (Table S7), with the weighted-mean ages being older (points X, Y, and Z, Figure 7). Point X has no influence on either age model due to its high uncertainty, adjacent to much more precise data at 17.45 mbs; however, points Y and Z are much older in the weighted-mean calculations, and lead to divergence of this model from the reference model or the model without the core 40Ar/39Ar ages.
The Bayesian model ages for the stratigraphic units at Y and Z are younger and closer to the other models. Finally, Figure 7 also shows (gold dotted line) a model excluding the diatomaceous age control points. The result differs from the reference model above 75 mbs (where the diatomaceous beds are present) by a nearly constant offset of 7–11 ka toward younger ages, or about half a precessional cycle. Thus, although the relative age spacing of the core diatomaceous beds and sequence boundaries in this interval would not significantly change, these events would no longer align with the peaks of insolation, rather with troughs (Figure 6). Additionally, the confidence interval on the model without the diatomaceous bed control points expands significantly from 0–75 mbs due to the removal of much of the constraining data. The above experiments demonstrate that, while no single chronostratigraphic control type is required to define the general shape and uncertainty of the age model, each type exerts a controlling influence in certain depth ranges. The reference model, incorporating all data types, is taken as the best representation of the age-depth profile of BTB13.
ACCEPTED MANUSCRIPT
Figure 7. BTB13 Bayesian model comparison and alternative means of deriving a representative age of dated units. The reference model using all available chronostratigraphic control data is shown as the red line with red shading representing a 95% confidence interval on the age. Three additional models are compared: (1) without the 40Ar/39Ar control points from the core (purple); (2) using
only the 40Ar/39Ar control points from the core with stratigraphic unit ages derived
from the population of single-crystal ages calculated using Bayesian triangular priors (green); and (3) same as (2), except with stratigraphic unit ages calculated using weighted means (black). Three points of maximum departure of the Bayesian and weighted mean unit ages are identified on the plot at points X, Y, and Z.
5 Discussion
5.1 Prior magmatic and erosional history
The Tugen Hills have experienced tectonic activity and volcanism associated with rifting since at least the middle Miocene (Chapman and Brook, 1978). The oldest volcanism recorded in the central part of the Tugen Hills are the widespread flood phonolite eruptions ~16–13 Ma of the Sidekh and Tiim Phonolites Formations
2.5 2.6 2.7 2.8 2.9 3.0 3.1 3.2 3.3 3.4 Age(Ma) 0 25 50 75 100 125 150 175 200 225 D e p th b e lo w su rf a ce (m ) Referenceagemodel with 95%confide nceinterval
Agemodel without diatomite boundary ages, with 95%CI shown above75mbs Agemodel without coreArAr control points
Agemodel usingonly coreArAr control points, calculated with Bayesian triangular priors. Agemodel usingonly coreArAr control points, calculated with weighted means
Core ArAr– Bayesian Core ArAr– Weighted mean CoreReversals
Outcrop tuff ArAr Outcrop diatomites AgeControl Points(±1σ)
X
Y