HAL Id: hal-00304616
https://hal.archives-ouvertes.fr/hal-00304616
Submitted on 1 Jan 2001HAL is a multi-disciplinary open access archive for the deposit and dissemination of sci-entific research documents, whether they are pub-lished or not. The documents may come from teaching and research institutions in France or abroad, or from public or private research centers.
L’archive ouverte pluridisciplinaire HAL, est destinée au dépôt et à la diffusion de documents scientifiques de niveau recherche, publiés ou non, émanant des établissements d’enseignement et de recherche français ou étrangers, des laboratoires publics ou privés.
calibrated catchments in Norway, Sweden and Finland
F. Moldan, R. F. Wright, S. Löfgren, M. Forsius, T. Ruoho-Airola, B. L.
Skjelkvåle
To cite this version:
F. Moldan, R. F. Wright, S. Löfgren, M. Forsius, T. Ruoho-Airola, et al.. Long-term changes in acidification and recovery at nine calibrated catchments in Norway, Sweden and Finland. Hydrology and Earth System Sciences Discussions, European Geosciences Union, 2001, 5 (3), pp.339-350. �hal-00304616�
Long-term changes in acidification and recovery at nine calibrated
catchments in Norway, Sweden and Finland
F. Moldan
1, R.F. Wright
2, S. Löfgren
3, M. Forsius
4, T. Ruoho-Airola
5and B.L. Skjelkvåle
21 IVL Swedish Environmental Research Institute, Box 47086, S-40258 Gothenburg, Sweden 2 Norwegian Institute for Water Research, Box 173 Kjelsås, N-0411 Oslo, Norway
3 Insitute for Environmental Assessment, Swedish University of Agricultural Sciences, Box 7050, S-75007 Uppsala, Sweden 4 Finnish Environment Institute, Box 140, FIN-00251, Helsinki, Finland
5 Finnish Meteorological Institute, Box 503, FIN-00101 Helsinki, Finland
Email for corresponding author: filip.moldan@ivl.se
Abstract
International agreements to reduce the emissions of acidifying pollutants have resulted in major changes in deposition of sulphur and nitrogen in southern Scandinavia over the past 25 years. Long-term monitoring of deposition and run-off chemistry over the past 12-25 years at nine small calibrated catchments in Finland, Norway and Sweden provide the basis for analysis of trends with special attention to recovery in response to decreased sulphur and nitrogen deposition in the 1980s and 1990s. During the 1980s and 1990s sulphate deposition in the region decreased by 30 to 60%, whereas inorganic nitrogen deposition showed very little change until the mid-1990s. Deposition of non-marine base cations (especially calcium) declined in the 1990s most markedly in southern Finland. Run-off response to these changes in deposition has been rapid and clear at the nine catchments. Sulphate and base cations (mostly calcium) concentrations declined and acid neutralising capacity increased. Occasional years with unusually high inputs of sea-salt confound the general trends. Trends at all the catchments show the same general picture as that from small lakes in Scandinavia and in acid-sensitive waters elsewhere in Europe.
Keywords: acidification, recovery, Scandinavia, catchment, trend analysis
Introduction
For more than 100 years, acid deposition resulting in acidification of freshwaters and damage to fish populations has been a major environmental problem in southern Scandinavia. Research aimed at discovering the causes of acidification and the terrestrial and aquatic processes governing the rates of acidification and recovery has made use of small calibrated catchments (e.g. Moldan and Cerný, 1994). Careful measurements of fluxes of water and chemical components into and out of catchments reveals processes in soils and water controlling acidification and information on dose-response relationships. The strength of such small catchments in environmental research has been shown by such work as the pioneering investigations at, for example, the Hubbard Brook Experimental Forest (Likens
et al., 1977).
Calibrated catchments have become integral parts of acidification monitoring programmes in Finland, Norway and Sweden. These national programmes are carried out under the auspices of the Finnish Environment Institute, the Norwegian State Pollution Control Authority and the Swedish Environmental Protection Agency. They also provide input data for international networks such as the International Co-operative Programme on Integrated Monitoring (ICP-IM), a programme of the United Nations Economic Commission for Europe’s (UN-ECE) Convention on Long-Range Transboundary Air Pollution (LRTAP).
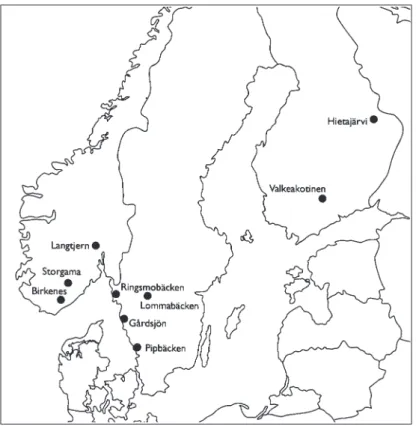
Systematic monitoring of inputs and outputs at small calibrated catchments in southern Scandinavia began in 1973-74 in Norway (three catchments), in 1981-1985 in Sweden (four catchments) and in 1988 in Finland (two catchments). Together, these nine catchments cover a large
geographic area and represent a diversity of natural physiographic regimes of precipitation, vegetation, soils and geology.
International agreements to reduce the emissions of acidifying pollutants (ECE, 1994; ECE, 1998; UN-ECE, 1999) have resulted in major changes in deposition of sulphur (S) and nitrogen (N) over the past 25 years in southern Scandinavia (Barrett et al., 2000). These reductions are intended to stop the acidification trend and allow recovery from acidification in terrestrial and aquatic ecosystems. The long-term records from the nine calibrated catchments provide a robust dataset for evaluation of trends in recovery. Harmonised analysis and synthesis of the data has been undertaken as part of projects of the Nordic Council of Ministers and the European Union (RECOVER:2010) (Ferrier et al., 2001), as well as the national programmes.
Here, trends in deposition and run-off chemistry at these nine calibrated catchments are investigated with special attention to the recovery in response to decreased S and N deposition during the 1980s and 1990s.
The work complements and adds to the work of Skjelkvåle
et al. (2001) who conducted a similar analysis on small lakes
in the same region. The lakes were sampled much less frequently (1–4 times per year) but data from many more sites (344) are available. The catchment data presented in this study are from more frequent sampling (usually weekly),
which allows calculation of input-output budgets and flow weighting of annual concentrations.
The Nordic data from calibrated catchments (this paper) and from small lakes (Skjelkvåle et al., 2001) comprise part of a large European-wide assessment of trends in acidification and recovery. The European overview is given by Evans et al. (2001a), trends in S are given by Prechtel et
al. (2001) and trends in N are given by Wright et al. (2001).
Sites and methods
The data used in this work are from national monitoring programmes in Finland, Norway and Sweden (Johannessen, 1995; Forsius et al., 1995; Wilander, 1998). The sampling and analytical methods are similar in the three countries. Site descriptions for the Norwegian catchments are from Lydersen (1994). Key catchment parameters are summarised in Table 1.
THE SITES Norway
The Birkenes catchment is located in southernmost Norway, about 15 km north of Kristiansand (Fig. 1). The catchment area is 0.41 km2 and altitude ranges from 200–300 m.
Bedrock is biotite granite. Overburden is a thin layer of ground moraine upon which podsols and peaty podsols have developed. The vegetation is predominantly mature mixed coniferous forest of Norway spruce (Picea abies L.) and Scots pine (Pinus sylvestris L.) with some birch (Betula
pendulosa L.). The ground vegetation consists primarily of
heather (Calluna vulgaris L.) and blueberry (Vaccinium
myrtillus L.). The station for precipitation and air sampling
is located about 500 m north of the catchment. The site was instrumented in 1972 as part of the Norwegian SNSF-project (Overrein et al., 1980).
The Storgama catchment is located in southernmost Norway about 50 km north of Arendal (Fig. 1). The catchment area is 0.6 km2 and altitude ranges from 580–
690 m. Bedrock is granitic. Overburden is a thin layer of ground moraine upon which podsols and peaty podsols have developed. About 20% of the catchment is exposed bare rock and 20% of the catchment covered by peat > 30 cm in depth. The vegetation is predominantly sparse unproductive forest of Scots pine (Pinus sylvestris L.) and some birch (Betula pendulosa L.). The ground vegetation consists primarily of heather (Calluna vulgaris L.). The weir at the
Table 1. Catchments characteristics
Country Latitude Longitude Altitude Area (ha) Precipi- Runoff Temperature
N E m.a.s.l. tation(mm) (mm) (ºC) Birkenes Norway 58º23´ 8º15´ 200-300 41 1530 1170 5.4 Storgama Norway 59º01´ 8º32´ 580-690 60 1210 950 5.1 Langtjern Norway 60º22´ 9º39´ 510-750 480 860 610 3 Hietajärvi Finland 63º10´ 30º43´ 170-210 464 630 400 2 Valkeakotinen Finland 61º14´ 25º04´ 150-190 30 650 200 3.1 Gårdsjön F1 Sweden 58º03´ 12º01´ 120-140 4 1100 550 6.3 Lommabäcken Sweden 58º42´ 14º38´ 190-230 104 660 540 5.6 Nedre Pipbäcken Sweden 57º03´ 12º47´ 80-170 93 1010 514 6 Nedre Ringsmobäcken Sweden 58º59´ 11º45´ 180-250 112 780 320 5.4
Forest/vegetation Geology Soil type Mean soil Data Key
depth (m) periods reference
Birkenes Mixed coniferous Granite Podzols 0.4 1974-1999 Lydersen (1994)
Storgama Individual trees, Granite Rankers and 0.32 1975-1999 Lydersen (1994)
heather, moorgrass Podzols
Langtjern Mixed coniferous Gneiss Podzols, 0.4 1974-1999 Lydersen (1994)
bedrock outcrops
Hietajärvi Pine/spruce Granitoides Podzols, 0.85 1988-1999 Forsius et al.,
Histosols (1995),
Valkeakotinen Pine/spruce/birch Gneis Dystric Cambi- 1.5 1988-1999 Forsius et al.,
sols and Histosols (1995),
Gårdsjön F1 Spruce/pine Gneissic Podzols 0.43 1981-1999 Moldan (1999)
granodiorite
Lommabäcken Pine/spruce Granite Histosols, 0.02 1985-1999 Löfgren and
Nedre bedrock outcrops Kvarnäs (1995)
Pipbäcken Nedre Mixed coniferous Gneiss, Histosols, 0.69 1985-1999 Löfgren and
deciduous forest amphibolite Podzols Kvarnäs (1995)
Ringsmobäcken Pine/spruce Gneiss Histosols, 0.01 1986-1999 Löfgren and
bottom of the catchment is at the outlet of a small pond. The station for precipitation and air sampling is located about 6 km east of the catchment at Treungen. The site was instrumented in 1974 as part of the Norwegian SNSF-project (Overrein et al., 1980).
The Langtjern catchment is located in southeastern Norway about 100 km northwest of Oslo (Fig. 1). The catchment area is 4.8 km2 and altitude ranges from 510–
750 m. Bedrock is biotite gneiss and granite. Overburden is a thin layer of ground moraine upon which podsols and peaty podsols have developed. About 16% of the catchment is exposed bare rock, 16% of the catchment covered by peat > 30 cm in depth and 5% is ponds and small lakes. The vegetation is predominantly mixed forest of Norway spruce (Picea abies L.), and ( Scots pine (Pinus sylvestris L.) and some birch (Betula pendulosa L.). The ground vegetation consists primarily of heather (Calluna vulgaris L.) and blueberry (Vaccinium myrtillus L.). The weir at the bottom of the catchment is at the outlet of the lake Langtjern (0.26 km2; water retention time about two months). Until
1995 the station for precipitation and air sampling was located about 6 km east of the catchment at Gulsvik and then was moved a short distance to Brekkebygda. The site was instrumented in 1974 as part of the Norwegian SNSF-project (Overrein et al., 1980).
Since 1980, the Birkenes, Storgama and Langtjern catchments have been part of the Norwegian Monitoring Programme for Long-Range Transported Air Pollutants (Johannessen, 1995).
Finland
The Valkeakotinen catchment is located in southernmost Finland, about 140 km north of Helsinki (Fig. 1). The catchment area is 0.30 km2 and altitude ranges from 150 to
190 m. Bedrock is gneiss and granitoids. Overburden is glacial drift upon which dystric cambisols have developed with some peatlands (histosols). There is a small lake within the catchment and vegetation is predominantly mature mixed coniferous forest of Norway spruce (Picea abies L.) and Scots pine (Pinus sylvestris L.) with some birch (Betula sp.). The Hietajärvi catchment is located in southeastern Finland, about 80 km northeast of Joensuu (Fig. 1). The catchment area is 4.64 km2 and altitude ranges from 170 to
210 m. Bedrock is granitoids and gneiss. Overburden is glacial drift with some small eskers upon which orthic podsols have developed. There are also some peatlands (histosols) and two small lakes in the catchment. The vegetation is predominantly mature mixed coniferous forest of Norway spruce (Picea abies L.) and Scots pine (Pinus
sylvestris L.) with some birch (Betula sp.).
At both sites the atmospheric deposition and run-off have been monitored, since 1988, by the Finnish Meteorological Institute and the Finnish Environment Institute as a part of the Finnish ICP-IM Programme (Bergström et al., 1995).
Sweden
The Gårdsjön catchment F1 is located in southwestern Sweden, about 50 km north of Gothenburg (Fig. 1). The catchment area is 0.04 km2 and altitude ranges from 115 to
135 m. Bedrock is gneiss and granodiorite partly overlain by glacial till upon which podsols, and in the valley bottom, histosols, have developed. The vegetation is predominantly mature mixed forest of Norway spruce (Picea abies L.), birch (Betula pendula and B. pubescens.) and Scots pine (Pinus sylvestris L.). The ground vegetation consists primarily of blueberry (Vaccinium sp.), grass (mainly
Deschamsia flexuosa), abundant mosses (mainly Dicranum maius) and lichens (Hypogymnia physodes, Lepraria incana). The site was instrumented in 1979 and has been
continuously operated by IVL Swedish Environmental Research Institute since 1980 (Andersson and Olsson, 1985). The Pipbäcken Nedre catchment is located in southwestern Sweden, about 25 km northeast of Falkenberg (Fig. 1). The catchment area is 0.93 km2 and altitude ranges from 75 to
165 m. Bedrock is gneiss and amphibolite overlain mainly by moraine upon which podsols have developed. The vegetation is mature mixed forest of spruce (Picea abies), pine (Pinus sylvestris), beech (Fagus sylvatica) and oak (Quercus petraea). About 31% of catchment is covered by peatland (Löfgren and Kvarnäs, 1995). The catchment was established as a part of the Swedish National Environmental Monitoring Programme (Aastrup et al., 1996) and the continuous data on precipitation and run-off are available since 1986. The catchment is operated by the Swedish University of Agricultural Sciences.
The Ringsmobäcken catchment is located in southwestern Sweden, about 160 km north of Gothenburg in the Stora Tresticklan area (Fig. 1). The catchment area is 1.12 km2
and altitude ranges from 180 to 245 m. Bedrock is gneiss and about 80% is bedrock outcrop. The rest of the catchment is covered by peatland and a small lake. The vegetation is sparse consisting mainly of heather (Calluna vulgaris) and a thin pine forest (Pinus sylvestris). The catchment was established as a part of the Swedish National Environmental Monitoring Programme (Aastrup et al., 1996) and continuous run-off data are available since 1985. Precipitation data were available for only four complete years (1983, 1984, 1988 and 1989) and were complemented by measurements at Gårdsjön catchment. The catchment is operated by the Swedish University of Agricultural Sciences.
The Lommabäcken Nedre catchment is located in the Tiveden national park about 20 km northeast of Karlsborg in southern Sweden (Fig. 1). The catchment area is 1.04 km2
and altitude ranges from 190 to 230 m. Bedrock is granite and about 85% of the catchment area is bedrock outcrop. A small lake and peatland cover about 11% of the catchment area and the rest is covered by thin organic soil. The vegetation is dominated by blueberry (Vaccinium myrtillus) and thin mixed forest of pine (Pinus sylvestris), spruce (Picea abies) and birch (Betula sp.) (Löfgren and Kvarnäs, 1995). The catchment was established as a part of the Swedish National Environmental Monitoring Programme (Aastrup et al., 1996) and continuous run-off data since 1985 are available. Precipitation was monitored at nearby station Sjöängen. The catchment is operated by the Swedish University of Agricultural Sciences.
METHODS
Non-marine fractions of sulphate (SO4*) and calcium (Ca*) are calculated under the assumptions that all chloride (Cl) is of marine origin (cyclic sea-salts) and is accompanied by other ions in the same proportions as in sea water. Acid neutralising capacity (ANC) is defined as the equivalent sum of base cations (Ca + magnesium (Mg) + sodium (Na) + potassium (K) minus the equivalent sum of strong acid anions (SO4 + Cl + nitrate (NO3)) (Reuss and Johnson, 1986). As a consequence of the ion balance (SO4 + Cl + NO3+ bicarbonate (HCO3) + OA) = (Ca + Mg + Na + K+ hydrogen (H) + aluminium (Al), ANC can also be expressed as the equivalent sum of (HCO + OA) - (H + Al). OA is organic anions. Aluminium is the sum of positively-charged Al species.
Trend analysis for each stream and each relevant variable were analysed with a non-parametric Seasonal Kendall tau (SKT) test (Hirsch et al., 1982). One limitation of the SKT is that it detects only monotonic trends; trends need not be linear, but they must proceed in only one direction (increasing or decreasing) to be detectable.
In brief, the SKT analyses the data within blocks, and compares the rank value for a single observation to the rank values of subsequent data from that same season. The signs (indicating whether the second observation in each pair-wise comparison is higher or lower than the first) for all pair-wise comparisons within each block are summed and a Z statistic calculated as the ratio of the sum of signs divided by the standard deviation in the signs. The SKT does not estimate the slopes of trends, but it has become customary to associate slopes calculated according to the method of Sen (1968), which estimates the slope by calculating the median of all between-year differences in the variable of
interest. The trend analysis are performed on SO4*, NO 3,
Ca*, ANC and H.
Results
DEPOSITION
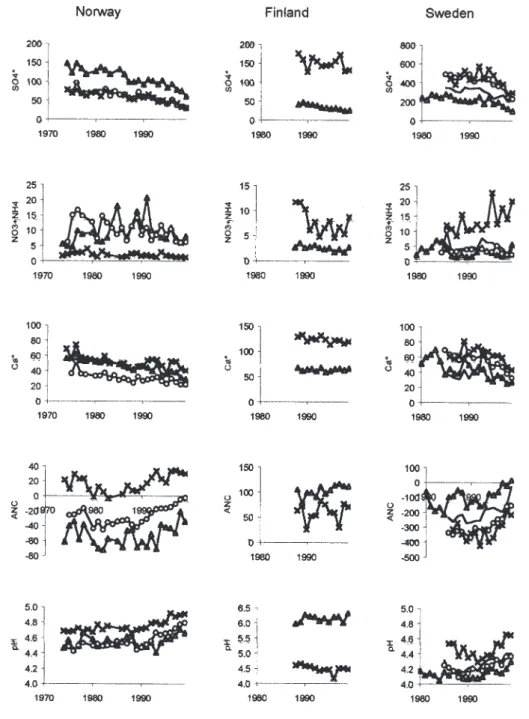
Deposition of SO4* has declined at all sites, with significant decreasing trends in the 1980s and continuing in the 1990s (Fig. 2). In the 1990s, the period for which data are available for the entire region, SO4* deposition declined from 21% at Treungen, Norway, to 37% at Sjöängen, Sweden, relative to the average levels during the 1980s. Data from before 1980 are available only from the three Norwegian sites; these show no changes prior to 1980. Dry deposition of S has probably declined commensurately, as concentrations of sulphur dioxide (SO2) gas have also declined in the region during the 1980s and 1990s (Barrett et al., 2000).
Deposition of inorganic N compounds has changed very little in Norway and Sweden whereas in Finland it has declined during 1990s (Fig. 2). Concentrations in bulk precipitation have been relatively constant during the 1980s and show only about 20% decline, mostly as NO3, during the late 1990s at some sites (Barrett et al., 2000). Deposition of non-marine base cations has decreased strongly in the late 1980s and early 1990s in Finland, and to a much lesser extent in Sweden and Norway.
The magnitude of trends in precipitation concentrations was separately analysed for three periods; 1974–1980, 1981–1990 and 1991–1999. The changes of the average slope over these three periods showed clear differences. During the 1970s, only the Norwegian sites were monitored. Non-marine sulphate and Ca* increased at two out of three sites, and inorganic N increased at all three. In the 1980s, Norwegian and Swedish sites were monitored. Non-marine sulphate decreased at all sites as did, with one exception, Ca*. Nitrate did not show any consistent pattern. In the 1990s there was a pronounced decrease in the SO4* concentrations at seven of the eight sites for which deposition data are available. Inorganic N decreased at all sites whereas Ca* did not show any consistent pattern (Fig. 2).
RUN-OFF
The long records from the three Norwegian catchments show that SO4* concentrations were high (peak) in late 1970s and early 1980s (Fig. 3). Non marine sulphate concentrations began to decline in the 1980s and the decline accelerated in the 1990s (Table 2). This pattern is seen at all the nine catchments. The overall decrease since 1980 in Norway has
Table 2. Average slopes in runoff trends divided into decades (1970s = 1974-80; 1980s = 1981-90; 1990s = 1991-1999)
and slope for the whole period, where only trends significant at p < 0.05 level are given. na= data not available for whole period. NS= no significant trend detected. Units: µeq L-1 yr-1.
SO4* NO3 Ca*
1970s 1980s 1990s all 1970s 1980s 1990s all 1970s 1980s 1990s all
years years years
Birkenes –2.9 –4.8 –4.9 –4.3 0.9 0.7 –1.1 NS –1.2 –1.0 –1.7 –1.3 Storgama –2.3 –1.5 –3.5 –2.4 0.9 –0.1 –0.4 NS –2.0 –0.9 –1.0 –1.2 Langtjern –1.1 –1.6 –3.6 –2.2 0.2 0.0 –0.1 NS –2.3 –1.4 –1.5 –1.6 Valkeakotinen na na –2.2 –2.2 na na –0.1 NS na na –1.1 –1.1 Hietajärvi na na –1.8 –1.8 na na –0.1 –0.1 na na 0.2 NS Gårdsjön F1 na –5.8 –15.2 –10.2 na –0.4 –0.1 –0.3 na –2.0 –2.3 –2.1 Ringsmobäcken na –1.5 –17.3 –11.0 na –0.2 –0.2 –0.2 na –0.4 5.7 NS Lommabäcken n. na –0.8 –26.5 –16.2 na –0.4 –0.2 NS na –0.6 –3.4 –2.3 Pipbäcken n. na 13.3 –28.3 –10.1 na 0.6 0.6 0.6 na 2.8 –3.3 NS ANC H+ 1970s 1980s 1990s all 1970s 1980s 1990s all years years –1.1 1.3 4.4 NS –1.4 –0.2 –1.8 NS –3.0 0.2 3.1 0.5 –0.7 0.2 –1.6 –0.7 –2.7 0.4 1.4 –0.1 0.0 0.3 –0.8 NS na na 0.3 NS na na 0.7 0.7 na na 2.4 2.4 na na 0.0 NS na 9.0 20.6 14.5 na 0.3 –3.4 NS na –4.9 20.7 NS na 2.4 –2.8 –0.8 na –4.5 22.1 11.4 na 3.9 –2.9 –0.2 na –17.7 22.2 NS na 3.5 –3.3 NS
been about 72% (27% in the 1980s and a further 45% in the 1990s). The records for Finland cover only the 1990s and here, SO4* declined by 28%. In Sweden, the decline was 24% in the 1980s and 50% in the 1990s.
Nitrate accounted for by far the largest portion of inorganic N in run-off; NH4 concentrations are negligible in streams draining non-agricultural catchments (data not shown). Most of the inorganic N in deposition was retained in the catchment. Nitrate is a minor acid anion compared to SO4. Concentrations of NO3 in run-off at the nine catchments showed very few trends over time. The exception was Pipbäcken Nedre in southern Sweden, which had the highest absolute concentration of NO3 of the nine catchments and showed significant increases in concentrations during the 1990s (Fig. 3, Table 2).
The decreased concentrations of anions (mainly SO4*) must be accompanied by decreased concentration of one or
more cation or compensated by increased concentration of another anion. Some of the decline in SO4* has been accompanied by decline in concentrations of base cations, mostly Ca* (Fig. 3).
Increased ANC compensates for the rest of the decline in SO4*. The pattern is clearest at the three Norwegian catchments. Here, acidification continued until the early 1980s (declining ANC), at which time the decline stopped, turned around and ANC began to recover, with the largest increases in the 1990s. The changes in ANC are comprised of decreased Al, decreased H (in sites with substantial H, that is, pH < 5), and increased HCO3 (at higher pH sites).
This general picture is confounded in part by year-to-year variations in sea-salt inputs. In southwestern Norway (Hindar et al., 1994), and in Sweden (Gustafsson and Hallgren-Larsson, 2000) the winter of 1993 had unusually severe storms, with high inputs of sea-salts. As a result of
this, run-off that year had abnormally high concentrations of Cl. Due to cation exchange in the soil, some of the base cations in this sea-salt input were exchanged with acid cations (H and Al) in the soil and caused a temporary decrease in ANC (Hindar et al., 1994). In Sweden, the winter of 1989 was similar, with high inputs of sea-salts in the southwestern parts of the country (Hultberg and Grennfelt, 1992).
Discussion
Sulphate concentrations and fluxes in run-off responded rapidly to the changes in S deposition at all sites. The catchment F1 at Gårdsjön illustrates well the role of the soil in delaying and modifying changes in deposition. The decline of SO4 concentrations in stream water output from F1 catchment was delayed relative to the decline in S deposition (Figs. 2 and 4). In terms of chemical budgets the deposition input is exceeded by the run-off output and there was a net release of previously stored SO4 from the catchment. Desorption of SO4 and mineralisation of
organically bound S from the catchment soils are two mechanisms which might cause a lag in the run-off response. In the relatively young soils in Scandinavia developed from parent material after the last glaciation, adsorbed SO4 is typically only a small fraction of the total S present in the soil. Most of the store of S is incorporated in soil organic matter (Mörth et al., 1999).
The dynamics of the S release from the soil is an important factor that needs to be considered when predicting the future development of recovery of soils and surface waters from acidification. Desorption of SO4 involves release of acidity in nearly stochiometric proportion (Gustafsson, 1995). Soils with large amounts of adsorbed SO4 might, therefore, remain acidified for years or even decades after a substantial decrease in S deposition (Beier et al., 1995). Release of organically bound S from the soils might potentially prolong the lag in recovery in soils and surface water for decades (Löfgren et al., 2001).
The delay in response due to the bleeding of “old” S from the nine Scandinavian catchments was generally less than about five years. This rapid response is characteristic for
Fig. 2. Volume-weighted annual mean concentrations of SO4*, inorganic N (NO3+NH4) and Ca* in bulk precipitation sampled at three sites in Norway (data from Aas et al., 2000), two in Finland and three in Sweden. Triangles: Birkenes, NO, Hietajärvi, FI, and Gårdsjön, SE. Crosses: Langtjern, NO, Valkeakotinen, FI, and Pipbäcken Nedre, SE. Circles: Storgama, NO, and Lommabäcken Nedre, SE.
Fig. 3. Volume-weighted annual mean concentrations of SO4*, inorganic N (NO3+ NH4), Ca*, ANC
and pH in run-off sampled at three catchments in Norway (data from SFT, 1998), two in Finland and four in Sweden. Symbols: Triangles: Birkenes, NO, Hietajärvi, FI, and Gårdsjön, SE. Crosses: Langtjern, NO, Valkeakotinen, FI, and Pipbäcken Nedre, SE. Circles: Storgama, NO, and
Lommabäcken Nedre, SE. No symbols: Ringsmobäcken, SE. Units: µeq L-1 except for pH.
young and well-drained soils developed since the last glaciation; such soils have low SO4 adsorption capacity. In contrast, at sites with old and highly weathered soils the response in SO4* in run-off can be delayed by decades or more (Harrison et al., 1989; Johnson, 1984; Johnson et al., 1980).
The Scandinavian catchments examined here fit well into
the general picture of S response in the rest of Scandinavia. All catchments showed statistically significant decreases in SO4* concentration during the 1990s, as is also the picture shown by annual surveys of 344 small lakes in Finland, Norway and Sweden (Skjelkvåle et al., 2001). Indeed, these trends have occurred in acidified surface waters generally in Europe (Prechtel et al., 2001).
The lack of a statistically significant trend in NO3 concentrations and fluxes at eight of the nine catchments also is consistent with the results from small lakes in the region (Skjelkvåle et al., 2001) and with trends in NO3 in surface waters elsewhere in Europe (Wright et al., 2001). Therefore, there is no evidence of N saturation at these catchments (with the possible exception of Pipbäcken Nedre in southern Sweden) over the past 12-25 years, despite the fact that the catchments retained > 90 % of inorganic N inputs.
The decline in SO4* was accompanied in part by decline in base cations, mostly Ca*. This is the same picture as found in the Nordic lakes (Skjelkvåle et al., 2001) and in acidified surface waters in Europe in general (Evans et al., 2001a). The response of base cations is most probably due to the “salt effect”; cations must decrease simply as a consequence of reduced anions (Reuss and Johnson, 1986). In southern Finland and, to a lesser extent, in southern Sweden, however, decreased deposition of base cations may be a factor contributing to declining run-off concentrations of base cations, as has been postulated at Hubbard Brook, USA (Likens et al., 1996). The decrease in base cation deposition in Finland is related to the reduced emissions of dust and fly ash from cement factories and power plants in the Baltic countries and adjacent areas of Russia. Over decadal time frames, a gradual increase in base cation concentrations in run-off should occur as the pools of exchangeable base cations in soil are replenished by weathering in the “post-acidification” era of the future.
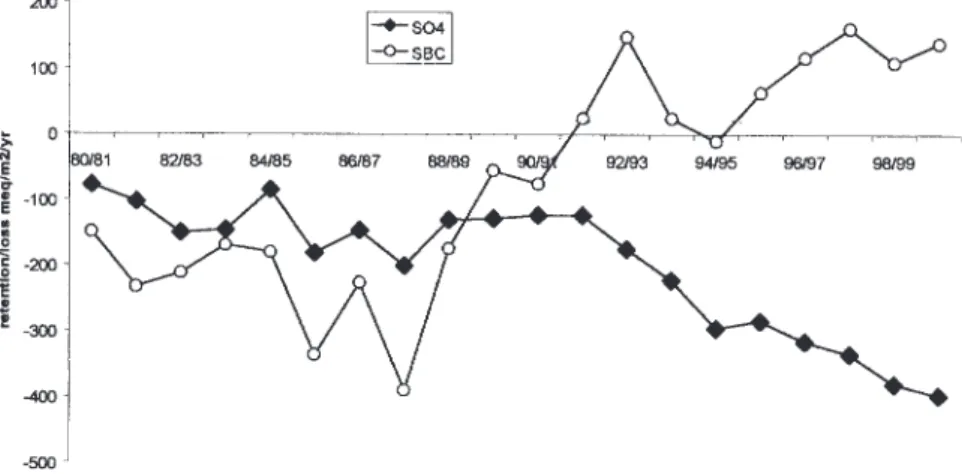
At catchment F1 (Gårdsjön, Sweden), the cumulative mass balances illustrate the general picture for SO4 and the sum of base cations (SBC) (Fig. 4). For SO4 every year the output (run-off) was subtracted from the input (throughfall) and the flux was accumulated. In the case of SBC, the output was run-off and estimated net uptake to the trees and the
Fig. 4. Cumulative net flux of SO4 and base cations for F1 catchment at Gårdsjön, Sweden.
input was estimated deposition plus weathering.
For the first ten years, the input and output were, for most of the time, in approximate SO4 balance (Fig. 4). From 1980 to 1990 about 100 meq m-2 of SO
4 were lost from the soil,
most of it in the first measured year. Since 1990, however, the catchment started to lose SO4 almost every year with exception of the extremely dry year of 1995. The total loss was about 250 meq m-2. For the base cations, the picture is
the opposite; up to 1990 a slight loss (c. 50 meq m-2, even
though there were some ups and downs). Since then, the soils retained about 250 meq m-2 of base cations (Fig. 4).
A fraction of the reduced SO4* concentration has been compensated for by increased ANC in run-off at the nine Scandinavian catchments. This is consistent with the pattern found in the Nordic lakes (Skjelkvåle et al., 2001) and in acid-sensitive waters in Europe as a whole (Evans et al., 2001a). For Europe generally about 50% of the decrease in SO4* was compensated by decreased base cations and about 50% by increased ANC.
The increased ANC means that water chemistry conditions have improved for aquatic organisms such as fish and invertebrates. Concentrations of toxic inorganic Al species have decreased and pH has increased. Again this is the same general picture as found in the lakes in Scandinavia (Skjelkvåle et al., 2001) and in acid-sensitive waters in Europe generally (Evans et al., 2001a).
The sea-salt-rich years of 1989 in Sweden and 1993 in southwestern Sweden and southern Norway confound the picture by causing temporary decreases in ANC thus delaying recovery. The sea-salt effect (temporary acidification due to episodic inputs of sea-salts) has been well-documented in Norway (Hindar et al., 1994; Wright
et al., 1988) as well as in the eastern US (Heath et al., 1992).
These episodes of sea-salt inputs generate noise in the signal of long-term trends, and thus larger monotonic changes over
longer time periods are required to obtain statistically significant trends (Wright and Jenkins, 2001). Sea-salt deposition may be cyclic over several years, due to such things as regular changes of the North Atlantic Oscillation (Evans et al., 2001b) and, therefore, any given period of several years might be influenced by consistently declining or increasing sea-salt, which also complicates the picture. For example, at the nine Scandinavian catchments the increase in ANC during the 1990s was often larger than the decrease in SO4* (Table 2) due to the decreasing Cl concentration in run-off (aftermath of the high sea-salt years early in the decade).
The present analysis of the nine catchments in southern Scandinavia extends in time previous trend analyses that have included surface waters in the Nordic countries. The patterns of recovery for the early 1990s documented by the ICP-Waters network (Stoddard et al., 1999) (part of the UN-ECE LRTAP convention) have continued through the decade and are now quite clear and consistent at acid-sensitive surface water sites in Scandinavia and elsewhere in Europe. There have been no systematic trends in NO3 in run-off, strong decreases in SO4*, accompanied by decreases in base cations and increases in ANC. Continued long-term monitoring at these sites is essential to document that large investments in emission control pay off in terms of a better environment and that water chemistry returns towards ecologically acceptable levels as the protocols of the UN-ECE Convention on Long-Range Transboundary Air Pollution are implemented (UN-ECE, 1999).
Acknowledgements
Data used here come from the national monitoring programmes of the Norwegian State Pollution Control Authority, the Swedish Environmental Protection Agency and the Finnish Environment Institute. This work was in part carried out as part of these programmes. Chris Evans and Jo Cullen at CEH are acknowledged for their expert help on trend evaluation and Sirpa Kleemola at FEI and Bibbi Manngård at IVL for help with processing the data. Financial support came from the Nordic Council of Ministers (Committee on Air and Oceans), the Commission of European Communities (RECOVER:2010 project, EVK1-CT-1999-00018), the ASTA research programme of the Swedish Foundation for Strategic Environmental Research (MISTRA), the Swedish Environmental Protection Agency, the Research Council of Norway, and the Norwegian Institute for Water Research.
References
Aas, W., Tørseth, K., Solberg, S., Berg, T. and Manø, S., 2000.
Overvåking av langtransportert forurenset luft og nedbør.
Atmosfærisk tilførsel 1999. Rapport 797/00, Statens forurensningstilsyn, Oslo, Norway, 147 pp.
Aastrup, M., Bringmark, L., Bråkenhielm, S., Hultberg, H., Iverfeldt, Å., Kvarnäs, H., Liu, Q., Löfgren, S. and Thunholm, B., 1996. Impact of air pollutants on processes in small
catchments. Report 4524, Swedish Environmental Protection
Agency, Stockholm, Sweden, 39 pp.
Andersson, F. and Olsson, B., 1985. Lake Gårdsjön, An acid forest lake and its catchment. Ecological Bulletins, 37, Stockholm, 336 pp.
Barrett, K., Aas, W., Hjellbrekke, A.G., Tarrason, L. and Schaug, J., 2000. An evaluation of trends for concentrations in air and precipitation. In: Transboundary Acidification and
Eutrophication in Europe, L. Tarrason and J. Schaug (Eds.),
41–58. EMEP Summary Report 2000, Norwegian Meteorological Institute, Oslo, Norway.
Beier, C., Hultberg, H., Moldan, F. and Wright, R.F., 1995. MAGIC applied to roof experiments (Risdalsheia, N; Gårdsjön, S; Klosterhede, DK) to evaluate the rate of reversibility of acidification following experimentally reduced acid deposition.
Water Air Soil Pollut., 85, 1745–1751.
Bergström, I., Mäkelä, K. and Starr, M. (Eds.), 1995. Integrated
Monitoring Programme in Finland. First National Report.
Report 1. Ministry of the Environment, Environmental Policy Department, Helsinki, Finland.
Evans, C.D., Cullen, J.M., Alewell, C., Marchetto, A., Moldan, F., Kopácek, J., Prechtel, A., Rogora, M., Veselý, J. and Wright, R.F., 2001a. Recovery from acidification in European surface waters. Hydrol. Earth Syst. Sci., 5, 283–297.
Evans, C.D., Monteith, D.T. and Harriman, R., 2001b. Long-term variability in the deposition of marine ions at west coast sites in the UK Acid Waters Monitoring Network: impacts on surface water chemistry and significance for trend determination. Sci.
Total Envir., 265, 115–129.
Ferrier, R.C., Jenkins, A., Wright, R.F., Schöpp, W. and Barth, H., 2001. Assessment of recovery of surface waters from acidification, 1970 - 2000: Introduction to the Special Issue.
Hydrol. Earth Syst. Sci., 5, 274–282.
Forsius, M., Kleemola, S., Starr, M. and Ruoho-Airola, T., 1995. Ion mass budgets for small forested catchments in Finland. Water
Air Soil Pollut., 79, 19–38.
Gustafsson, J.P., 1995. Modelling pH-dependent sulphate adsorption in the Bs horizons of podsolized soils. J. Environ.
Qual., 24, 882–888.
Gustafsson, M.E.R. and Hallgren-Larsson, E., 2000. Spatial and temporal patterns of chloride deposition in southern Sweden.
Water Air Soil Pollut., 124, 345–369.
Harrison, R.B., Johnson, D.W. and Todd, D.E., 1989. Sulfate adsorption and desorption reversibility in a variety of forest soils. J. Environ. Qual., 18, 419–426.
Heath, R.H., Kahl, J.S., Norton, S.A. and Fernandez, I.J., 1992. Episodic acidification caused by the seasalt effect in coastal Maine streams. Water Resour. Res., 28, 1081–1088.
Hindar, A., Henriksen, A., Tørseth, K. and Semb, A., 1994. Acid water and fish death. Nature, 372, 327–328.
Hirsch, R.M., Slack, J.R. and Smith, R.A., 1982. Techniques of trend analysis for monthly water quality analysis. Water Resour.
Res. 18, 107–121.
Hultberg, H. and Grennfelt, P., 1992. Sulphur and seasalt deposition as reflected by throughfall and run-off chemistry in forested catchments. Environ. Poll., 75, 215–22.
Johannessen, T., 1995. Acidification in Norway. The Norwegian monitoring programme for long range transported air pollutants.
Water Air Soil Pollut., 85, 617–621.
Johnson, D.W., 1984. Sulfur cycling in forests. Biogeochem., 1, 29–43.
Johnson, D.W., Hornbeck, J.W., Kelly, J.M., Swank, W.T. and Todd, D.E., 1980. Regional patterns of soil sulfate accumulation: relevance to ecosystem sulfur budgets. In: Atmospheric Sulfur
Deposition: Environmental Impact and Health Effects, D.S.
Shriner, C.R. Richmond and S.E. Lindberg (Eds.), 507–520. Butterworth, Ann Arbor, USA.
Likens, G.E., Bormann, F.H., Pierce, R.S., Eaton, J.S. and Johnson, N.M., 1977. Biogeochemistry of a Forested Ecosystem. Springer, New York, 146 pp.
Likens, G.E., Driscoll, C.T. and Buso, D.C., 1996. Long-term effects of acid rain: response and recovery of a forest ecosystem.
Science, 272, 244–246.
Löfgren, S. and Kvarnäs, H., 1995. Ion mass balances for three small forested catchments in Sweden. Water Air Soil Pollut.,
85, 529–534.
Löfgren, S., Bringmark, L., Aaastrup, M., Hultberg, H., Kindbom, K. and Kvarnäs, H., 2001. Sulphur balances and dynamics in three forested catchments in Sweden. Water Air Soil Pollut., (in press).
Lydersen, E., 1994. Long-term Monitored Catchments in Norway
- A Hydrologic and Chemical Evaluation. Acid Rain Research
Report 34-A/1994, Norwegian Institute for Water Research, Oslo, Norway, 306 pp.
Moldan, B. and Cerný, J. (Eds), 1994. Biogeochemistry of small
catchments: A tool for environmental research. Scope, 51, Wiley,
Chichester, UK, 419 pp.
Mörth, C.M., Torssander, P., Kusakabe, M. and Hultberg, H., 1999. Sulfur isotope values in a forested catchment over four years: Evidence for oxidation and reduction processes.
Biogeochemistry, 44, 51–71.
Overrein, L., Seip, H.M. and Tollan, A 1980. Acid precipitation
-Effects on forest and fish. Final report of the SNSF-project 1972–
1980. Fagrapport FR 19-80, Oslo-Ås, Norway, 175 pp. Prechtel, A., Alewell, C., Armbruster, M., Bittersohl, J., Cullen,
J., Evans, C.D., Helliwell, R.C., Kopácek, J., Marchetto, A., Matzner, E., Meesenburg, H., Moldan, F., Moritz, K., Veselý, J. and Wright, R.F., 2001. Response of sulphur dynamics in European catchments to decreasing sulphate deposition. Hydrol.
Earth Syst. Sci., 311–325.
Reuss, J.O. and Johnson, D.W., 1986. Acid Deposition and the
Acidification of Soils and Waters. Ecological Studies. Springer,
New York, 119 pp.
Sen, P.K., 1968. On a class of aligned rank order tests in two-way layouts. Annals of Mathematics and Statistics, 39, 1115–1124. SFT, 1998. Overvåking av langtransportert forurenset luft og
nedbør. Årsrapport – Effekter 1997. Statlig program for
fururensningsovervåking Rapport 748/98, Statens forurensningstilsyn, Oslo, Norway, 215 pp.
Skjelkvåle, B.L., Andersen, T., Fjeld, E., Mannio, J. and Wilander, A., 2001. Recovery from acidification of lakes in Finland, Norway and Sweden, 1990-1999. Hydrol. Earth Syst. Sci., 5, 327–337.
Stoddard, J.L., Jeffries, D.S., Lükewille, A., Clair, T.A., Dillon, P.J., Driscoll, C.T., Forsius, M., Johannessen, M., Kahl, J.S., Kellogg, J.H., Kemp, A., Mannio, J., Monteith, D.T., Murdoch, P.S., Patrick, S., Rebsdorf, A., Skjelkvåle, B.L., Stainton, M.P., Traaen, T.S., van Dam, H., Webster, K.E., Wieting, J. and Wilander, A., 1999. Regional trends in aquatic recovery from acidification in North America and Europe 1980–95. Nature,
401, 575–578.
UN-ECE, 1994. Protocol to the 1979 Convention on Long-range
Transboundary Air Pollution on Further Reduction of Sulphur Emissions. Document ECE/EB.AIR/40, United Nations
Economic Commission for Europe, New York and Geneva. 106pp.
UN-ECE, 1998. Protocol to the 1979 Convention on Long-range
Transboundary Air Pollution on Reduction of Heavy Metals.
(2001, August 7, online) URL: http://www.unece/env/lrtap/ protocol/98hm.htm.
UN-ECE, 1999. The 1999 Protocol to Abate Acidification,
Eutrophication and Ground-level Ozone. (2001, August 7,
online) URL: http://www.unece/env/lrtap/protocol/98hm.htm. Wilander, A., 1998. Referanssjöarnas vattenkemi under 12 år;
tillstånd och trender. Rapport 4652, Naturvårdsverket Förlag,
Stockholm, Sweden, 79 pp.
Wright, R.F. and Jenkins, A., 2001. Climate change as a confounding factor in reversibility of acidification: RAIN and CLIMEX projects. Hydrol. Earth Syst. Sci., 477–486. Wright, R.F., Norton, S.A., Brakke, D.F., and Frogner, T., 1988.
Experimental verification of episodic acidification of freshwaters by sea-salts. Nature, 334, 422–424.
Wright, R.F., Alewell, C., Cullen, J., Evans, C.D., Marchetto, A., Moldan, F., Prechtel, A. and Rogora, M., 2001. Trends in nitrogen deposition and leaching in acid-sensitive streams in Europe. Hydrol. Earth System Sci., 5, 299–310.