HAL Id: hal-00298638
https://hal.archives-ouvertes.fr/hal-00298638
Submitted on 2 Jan 2006HAL is a multi-disciplinary open access
archive for the deposit and dissemination of sci-entific research documents, whether they are pub-lished or not. The documents may come from teaching and research institutions in France or abroad, or from public or private research centers.
L’archive ouverte pluridisciplinaire HAL, est destinée au dépôt et à la diffusion de documents scientifiques de niveau recherche, publiés ou non, émanant des établissements d’enseignement et de recherche français ou étrangers, des laboratoires publics ou privés.
Virtual water highway: water use efficiency in global
food trade
H. Yang, L. Wang, K. C. Abbaspour, A. J. B. Zehnder
To cite this version:
H. Yang, L. Wang, K. C. Abbaspour, A. J. B. Zehnder. Virtual water highway: water use efficiency in global food trade. Hydrology and Earth System Sciences Discussions, European Geosciences Union, 2006, 3 (1), pp.1-26. �hal-00298638�
HESSD
3, 1–26, 2006
Virtual water highway
H. Yang et al. Title Page Abstract Introduction Conclusions References Tables Figures J I J I Back Close
Full Screen / Esc
Print Version Interactive Discussion
EGU Hydrol. Earth Syst. Sci. Discuss., 3, 1–26, 2006
www.copernicus.org/EGU/hess/hessd/3/1/ SRef-ID: 1812-2116/hessd/2006-3-1 European Geosciences Union
Hydrology and Earth System Sciences Discussions
Papers published in Hydrology and Earth System Sciences Discussions are under open-access review for the journal Hydrology and Earth System Sciences
Virtual water highway: water use
e
fficiency in global food trade
H. Yang1, L. Wang1, K. C. Abbaspour1, and A. J. B. Zehnder2
1
Swiss Federal Institute for Environmental Science and Technology, Ueberlandstrasse 133, 8600 Duebendorf, Switzerland
2
Board of Swiss Federal Institute of Technology, ETH Zentrum, 8092 Zurich, Switzerland Received: 29 November 2005 – Accepted: 13 December 2005 – Published: 2 January 2006 Correspondence to: H. Yang ([email protected])
HESSD
3, 1–26, 2006
Virtual water highway
H. Yang et al. Title Page Abstract Introduction Conclusions References Tables Figures J I J I Back Close
Full Screen / Esc
Print Version Interactive Discussion
EGU
Abstract
Amid an increasing water scarcity in many parts of the world, virtual water trade as both a policy instrument and practical means to balance the regional, national and global water budget has received much attention in recent years. Built upon the knowledge of virtual water accounting in the literature, this study examines the efficiency of the
5
resource use embodied in the global virtual water trade from the perspectives of ex-porting and imex-porting countries. Different characteristics between “green” and “blue” virtual water corresponding to rainfed and irrigated agriculture are elaborated. The in-vestigation reveals that the virtual water flows primarily from countries of high water productivity to countries of low water productivity, generating a global saving of water
10
resources. Meanwhile, the domination of green virtual water in the total virtual water trade constitutes low opportunity costs and environmental impacts as opposed to blue virtual water. The results suggest efficiency gains in the global food trade in terms of water resource utilization. The study raises awareness of negative impacts of increas-ing reliance on irrigation for food production in many countries, includincreas-ing food exportincreas-ing
15
countries. The findings of the study call for a greater emphasis on rainfed agriculture to improve global food security and environmental sustainability.
1. Introduction
With the continuous population growth and related developments, water resources have become increasingly scarce in a growing number of countries and regions in
20
the world. As the largest water user, accounting for over 80% of the global total wa-ter withdrawal, food production is directly constrained by wawa-ter scarcity (Cosgrove and Rijsberman, 2000; Rosegrant et al., 2002). To compensate for the domestic water deficit and meet the food demand, many countries have opted for importing food from abroad. This is virtually equivalent to importing water that would otherwise be needed
25
HESSD
3, 1–26, 2006
Virtual water highway
H. Yang et al. Title Page Abstract Introduction Conclusions References Tables Figures J I J I Back Close
Full Screen / Esc
Print Version Interactive Discussion
EGU as “virtual water”. In recent years, the concept of virtual water has been extended to
refer to the water that is required for the production of agricultural commodities and in-dustrial goods (Hoekstra and Hung, 2002; Oki et al., 2002). Nevertheless, discussions on virtual water issues have so far focused primarily on food commodities due to their large share in total water use. With the continuous intensification of water scarcity in
5
many areas of the world, the role of virtual water trade in balancing water budget and improving food security is expected to increase (Yang et al., 2003).
Against this background, studies concerning water scarcity, food security and virtual water trade have flourished in recent years. The efforts have greatly helped the under-standing of water and food challenges and provided useful information for formulating
10
national and international policies to deal with them. In view of the important role of virtual water trade in alleviating water stress, a number of studies have estimated the scale of virtual water embodied in the global food trade (Hoekstra and Hung, 2002; Oki et al., 2002; Zimmer and Renault, 2002). The results from these studies, however, vary to some extent partly because of the different coverage of food commodities in
15
the calculation. The variations also reflect the complexity of site specific conditions in different regions and countries.
Built upon the virtual water accounting in the literature, this study goes further to examine the efficiency gains embodied in the global virtual water trade with respect to water saving, opportunity costs and environmental impacts. In different countries, the
20
amount of water required for producing a unit of crop differs. A global water saving results when food is exported by countries whose water use is relatively more produc-tive to countries whose water use is less productivity. Flows in an opposite direction lead to an inefficient use of global water resources. Meanwhile, water use in rainfed and irrigated agriculture differs in opportunity costs and environmental impacts.
Rain-25
fed agriculture uses the “green water” while irrigated agriculture uses the “blue water”. These characteristics are reflected in the trading of virtual water. As to be elaborated in this study, trading “green virtual water” is more efficient in terms of resources utilization than that of “blue virtual water”, holding other conditions constant.
HESSD
3, 1–26, 2006
Virtual water highway
H. Yang et al. Title Page Abstract Introduction Conclusions References Tables Figures J I J I Back Close
Full Screen / Esc
Print Version Interactive Discussion
EGU Our focus in this study is the global water use efficiency admitting, however, that
the virtual water trade issue is more complicated because of the sensitive political and social conditions, which also merit careful analyses. In this study we examine virtual water trade for both importing and exporting countries, estimate the scale of water saving or overuse for different crops resulting from global food trade, and carry out a
5
virtual water partitioning to specify the contribution of green and blue virtual water in global food trade.
Food exporting countries are the source of virtual water. They are imperative players in the global virtual water trade. However, previous studies of virtual water issues have focused overwhelmingly on food importing countries. Little attention has been
10
paid to food exporting countries concerning their water endowments and resource use efficiency, as well as environmental impacts associated with virtual water export. In discussions of the application of the concept, current and future food and water policies of food exporting countries have generally been neglected (Merrett, 2003). With the virtual water trade increasingly being emphasized in the global effort to combat regional
15
water scarcity, the perspective of exporting countries deserves more attention.
The subsequent sections of this paper tackle the following issues: 1) crop virtual water content and water productivity in different countries; 2) the scale of the global water use efficiency, quantified as the water saving, achieved through the global virtual water trade; 3) the economic and environmental implications of green and blue water
20
corresponding, respectively, to rainfed and irrigated agriculture, and; 4) the contribution of green and blue virtual water in the global virtual water trade. Concluding remarks and policy implications are given in the final section.
2. Virtual water content and water productivity
In the virtual water literature, a ratio of 1 kg of cereal (excluding rice) to 1 m3 of water
25
has commonly been used as a rule of thumb in estimating the volume of virtual water imported to or exported from a country. For rice, a ratio of 1 to 2 is often applied (Yang
HESSD
3, 1–26, 2006
Virtual water highway
H. Yang et al. Title Page Abstract Introduction Conclusions References Tables Figures J I J I Back Close
Full Screen / Esc
Print Version Interactive Discussion
EGU and Zehnder, 2002; Allan, 2003; Zehnder et al., 2003). This approximation is useful for
political and conceptual discussions on virtual water issues. It, however, overlooks the variations in virtual water content among different crops and across countries. In reality, water required for producing a unit product, or virtual water content, varies substantially among different crops and across different climate zones.
5
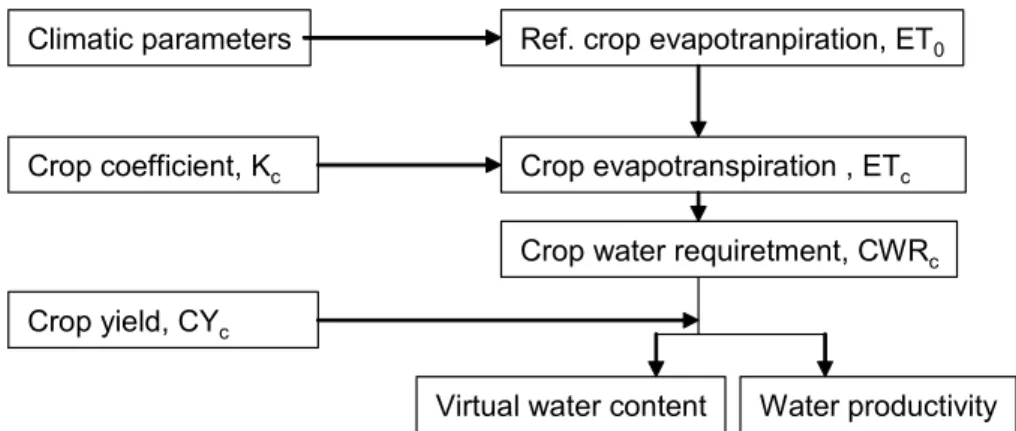
Various models have been applied in estimating crop virtual water contents. CROP-WAT is one of the mostly used models. The model is developed by the Food and Agricultural Organization of the United Nations (FAO) and is downloadable from the In-ternet. The climate parameters and crop coefficients required for estimating crop water requirements are available in the FAO databases (FAO, 1986a, 1986b). Steps of the
10
virtual water estimation are given in Fig. 1.
In the CROPWAT model, crop evapotranspiration E Tc is estimated on the basis of the “reference crop evapotranspiration” E T0and the crop coefficient Kc.
E Tc = KcE T0 (1)
Specific crop water requirement CW Rc(m3ha−1) over the complete growing period
15 is calculated as: CW Rc = m X i=1 E Tc,i, (2)
where m is the total number of growing days for crop c.
Based on the CW Rc, crop virtual water content (CV W Cc, m3ton−1) and its inversion, crop water productivity (CW Pc, ton m−3) can be calculated as:
20
CV W Cc =CW Rc
Yc (3)
CW Pc= Yc
HESSD
3, 1–26, 2006
Virtual water highway
H. Yang et al. Title Page Abstract Introduction Conclusions References Tables Figures J I J I Back Close
Full Screen / Esc
Print Version Interactive Discussion
EGU where Yc is the yield of crop c (ton ha−1).
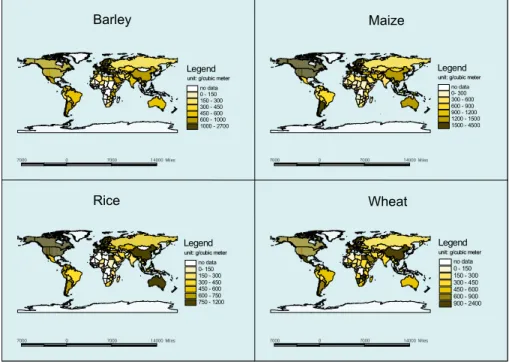
Applying the CROPWAT model, Hoekstra and Hung (2002) estimated the CV W C for major food crops in different countries. Given the crudeness of the available data and the complexity of crop systems in different countries, errors are inevitable in the estimation. Nevertheless, their study is so far the only systematic estimation of virtual
5
water content of crops on the global scale. Improving the estimation requires more accurate data at the country and sub-country levels, which are not currently available at the global level. For this reason, this study uses the virtual water contents estimated by Hoekstra and Hung (2002). Based on their estimation, CW P for major food crops in different countries is calculated in this study. The results for selected major crops are
10
displayed in Fig. 2.
Water productivity varies significantly across countries and among crops. Neverthe-less, it is noticeable that water productivity for the respective crops is generally high in North America and the Western European countries. Other countries with high wa-ter productivity include Argentina, China, Australia, and some countries in the Middle
15
East. In contrast, water productivity is manifestly low in the Sub-Sahara African coun-tries. This situation is expected because water productivity is closely related to the agronomic practices and water management at both regional and farm-level. Efforts to raise water productivity are often associated with greater inputs and improved agro-nomic practice and water management, which are generally lacking in poor countries.
20
It should be pointed out that the estimation of crop virtual water contents and crop water productivity are based on the actual crop evapotranspiration. In reality, more wa-ter is required in the irrigated production due to the losses during the conveyance and field supply. In most developing countries, for example, the amount of water supplied to irrigated field is typically 2–3 times of that required for actual crop evapotranspiration.
25
At the basin level, although part of the losses on specific irrigation sites can recharge the aquifers or can be used by downstream users and ecosystems, the real losses are nevertheless significant. Recent studies have suggested that the losses to non-beneficial evapotranspiration at the river basin level are between 10–20% of the total
HESSD
3, 1–26, 2006
Virtual water highway
H. Yang et al. Title Page Abstract Introduction Conclusions References Tables Figures J I J I Back Close
Full Screen / Esc
Print Version Interactive Discussion
EGU supply (Seckler et al., 1998). This means that the real water productivity is lower than
that estimated above. The discount would be larger in developing countries where the non-beneficial losses are generally greater.
3. Virtual water accounting and global virtual water flows
3.1. Virtual water accounting and scale of water saving
5
A large variety of food commodities is traded in the international market. It is difficult to include all the commodities in the calculation. In this study, the estimation is based on 20 major food crops (items) shown in Table 1. They account for about 70% of the total calorie intake on a world average (FAO, 2003). The rest of the 30% is made up by animal products and other crops, mainly vegetables and fruits. Because not
10
all the traded food commodities are included, the scale of virtual water trade may be underestimated. Nevertheless, this will not significantly affect the major points to be addressed and the conclusions to be drawn. Meanwhile, volumes of virtual water trade estimated in this study may not be compared directly with the results from other studies due to different coverage of crop commodities in the calculation.
15
The gross volume of virtual water import (GV W I) to a country is the sum of crop imports (CIc) multiplied by their associated crop virtual water content (CV W Cc) in that country:
GV W I =X
c
(CIc× CV W Cc) (5)
Similarly, the gross volume of virtual water export (GV W E ) from a country is the sum of
20
crop exports (CEc) multiplied by their associated crop virtual water content (CV W Cc) in that country:
GV W E =X
c
HESSD
3, 1–26, 2006
Virtual water highway
H. Yang et al. Title Page Abstract Introduction Conclusions References Tables Figures J I J I Back Close
Full Screen / Esc
Print Version Interactive Discussion
EGU In the global food trade system, the volume of total food export is approximately equal
to the volume of total food import to achieve the market clearance. This is especially so when averaged over a period of time as the effect of yearly stock exchange is smoothed out. Concerning the global virtual water trade, however, this equilibrium does not ap-ply. Due to variations in crop virtual water contents, water needed for producing a given
5
amount of food in exporting countries (the production side) can differ from that in im-porting countries (the consumption side). In other words, the virtual water “value” of a given amount of food is not identical on the two sides. When virtual water imports and exports for all the countries are summed up separately, a gap between the two volumes occurs. Depending on the sign of the gap, water saving or loss in the global food trade
10
can result. Equations for estimating the total global virtual water import (T GV W I) and total global virtual water export (T GV W E ) are expressed as:
T GV W I = N X n=1 C X c=1 GV W In,c (7) T GV W E = N X n=1 C X c=1 GV W En,c (8)
where N is the number of countries, C is the number of crops considered. Water
15
saving/loss generated from the global virtual water trade (GNV W T ) can be calculated as: GNV W T (N, C)= N X n=1 C X c=1 (GV W In,c− GV W En,c) (9)
Table 2 shows the estimates of gross virtual water import and export at the global level. Total volume of virtual water export associated with the food crops considered is
20
about 644 km3 year−1. The corresponding volume for import is 981 km3 year−1. The difference of 337 km3year−1is the global water saving resulting from the food trade. In
HESSD
3, 1–26, 2006
Virtual water highway
H. Yang et al. Title Page Abstract Introduction Conclusions References Tables Figures J I J I Back Close
Full Screen / Esc
Print Version Interactive Discussion
EGU other words, this amount of additional water would otherwise be required if the imported
amount of food were produced in the importing countries. Apparently, this water saving is achieved from the generally high water productivity in the food exporting countries in comparison to the food importing countries (Fig. 2).
For individual crops, the scale of water saving varies. For wheat and maize, 41% and
5
59% of water are saved, respectively. This means that the importing countries would have to use approximately twice as much as the water used in the exporting countries for producing the same amount of wheat and maize they import. The trading of these two crops contributes greatly to the total global water saving. An exception, however, is rice where the volume of virtual water embodied in rice export is larger than that in rice
10
import. This implies that the rice production in the exporting countries requires more water than the production in the importing countries. This may partly be explained by the relatively high crop evapotranspiration in the major rice exporting countries, such as Vietnam and Thailand (FAO, 2003).
3.2. Global virtual water flows
15
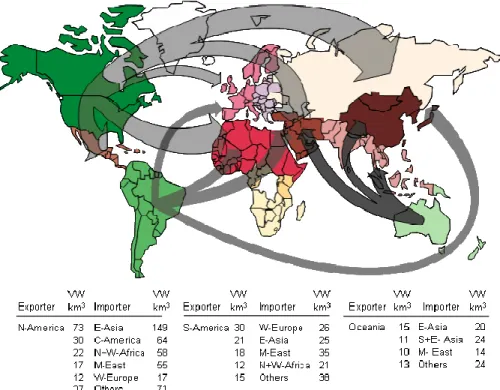
As water productivity is generally lower in importing countries than in exporting coun-tries, a given amount of food commodities is worth more virtual water in the former than in the latter. To illustrate this point visually, Fig. 3 depicts the net virtual water flows viewed from the exporting and importing sides in the 14 regions of the world. The net volume of virtual water export is the net export quantities multiplied by the crop
20
virtual water contents in the corresponding exporting countries. The net volume of virtual water import is the net import quantities multiplied by the crop virtual water con-tents in the corresponding importing countries. The two volumes represent the virtual water “values” of a given amount of food commodity measured at the source and desti-nation. The data for the calculation are from the Commodity Trade Statistics Database
25
(COMTRADE) of the United Nations Statistic Division in New York in collaboration with the International Trade Centre in Geneva (UN, 2003). Individual country’s virtual water export and import by source and destination is calculated first. All the countries are
HESSD
3, 1–26, 2006
Virtual water highway
H. Yang et al. Title Page Abstract Introduction Conclusions References Tables Figures J I J I Back Close
Full Screen / Esc
Print Version Interactive Discussion
EGU then grouped into 14 regions for a visual clarity.
North America, South America and Oceania are the net exporting regions of virtual water. All other regions are net importers. East Asia, Central America, North and West Africa and Middle East are the major destinations of virtual water. It can be seen that the volumes of virtual water differ largely on the exporting and importing sides. For
5
example, the volume of 73 km3of virtual water exported from North America is trans-lated into 149 km3 of virtual water in East Asia. In the Middle East, the corresponding volumes are 17 km3and 55 km3, respectively. One exception is the virtual water export from South America to Western Europe. The virtual water exported from South Amer-ica is worth less in Western Europe because water productivity in the former region is
10
lower than the latter region.
Global food trade reduces the overall water use in world food production. This is of significance in terms of efficient use of global water resources. Down to the coun-try level, such a saving is more important for the countries where water resources are scarce and water productivity is low. By importing food, these countries are able to
ben-15
efit from both water resources and higher water productivity of exporting countries. For water abundant countries, however, the water saving in food import is less significant. Importing food is often not directly related to their water endowments. The significance of the global water saving should be viewed with these differences in perspective.
4. “Green” vs. “blue” water in agricultural production and virtual water trade
20
In the hydrological cycle water resources can be divided into “blue” and “green”. Blue water refers to the water in rivers, lakes, reservoirs, ponds and aquifers (Rockstr ¨om, 1999). Irrigated agriculture typically uses blue water. The concept of green water was first introduced by Falkenmark (1995) to refer to the return flow of water to the atmo-sphere as evapotranspiration (E T ) which includes a productive part as transpiration (T )
25
and a non-productive part as direct evaporation (E ) from the surfaces of soils, lakes, ponds, and from water intercepted by canopies. Later, green water has been generally
HESSD
3, 1–26, 2006
Virtual water highway
H. Yang et al. Title Page Abstract Introduction Conclusions References Tables Figures J I J I Back Close
Full Screen / Esc
Print Version Interactive Discussion
EGU used to refer to the water stored in the unsaturated soils (Savenije, 2000). Green water
is the water source of rainfed agriculture.
Green water and blue water have different characteristics in many aspects. Ta-ble 3 summarized some features that are pertinent to agricultural production. Cen-tral to these differences are the opportunity costs and the hydrological/environmental
5
impacts.
The opportunity cost of water is its value in other uses, such as in municipal, indus-trial, or recreational activities, and ecosystems. Green water comes from rainfall. Such water is a “free good” in terms of supply. Plants other than food crop (which often have lower direct economic value of water use) are the only major competitive users of this
10
water. Hence, rainfed agriculture is rather efficient in terms of the opportunity cost of water use. Meanwhile, the environmental impact of the use of green water is relatively small because it generally does not change the distribution of water resources and the hydrological cycle.
In contrast, the opportunity cost of blue water in agriculture is high since it has many
15
other functions. Irrigation often yields the lowest economic value among all the func-tions (Zehnder et al., 2003). Meanwhile, blue water requires facilities for storage and distribution before it can be delivered to users. The supply of water involves cost. The environmental impact of such water use is also significant as it changes the natural courses of water flows. Moreover, excessive irrigation can cause severe salinization,
20
water logging and soil degradation, which are evident in many areas of the world. Tak-ing into consideration the opportunity costs and environmental impacts in the use of water resources, trading green virtual water is overall more efficient than trading blue virtual water, holding other factors constant.
The ratio of irrigated areas to total crop areas indicates the dependence of a
coun-25
try’s agricultural production on blue water. A high ratio means a high reliance on blue water. Both supply cost and opportunity cost of the water use is high. This is par-ticularly so in water scarce countries where alternative uses of water often generate much higher returns. Conversely, a low irrigation ratio indicates a domination of rainfed
HESSD
3, 1–26, 2006
Virtual water highway
H. Yang et al. Title Page Abstract Introduction Conclusions References Tables Figures J I J I Back Close
Full Screen / Esc
Print Version Interactive Discussion
EGU agriculture. Such a practice is more efficient in terms of opportunity cost and supply
cost.
The ratio of irrigated areas to total cultivated areas shown in Fig. 4 appears to have a high geographical correlation with the virtual water import/export depicted in Fig. 3. In major food exporting countries, especially the USA, Canada, France, Australia and
5
Argentina, the irrigation ratio is low. This situation indicates that food production in these countries is dominantly rainfed. A further inference is that food exporting coun-tries generally export their green virtual water. In food importing councoun-tries, irrigation ratio varies widely but is on average higher than that in food exporting countries. This situation suggests that food importing countries have a higher dependence on blue
10
water for agricultural production. This is not surprising given the close links between low precipitation, need for irrigation and the demand for virtual water import. For water scarce countries, using limited water resources for irrigation leads to allocation ine ffi-ciency. However, this inefficiency is often taken as a trade-off for easing other more pressing concerns, typically food security, rural employment and political stability. It is
15
also noticed that in many poor countries, the irrigation ratio is low irrespective of their water resources. This situation is no doubt related to the lack of financial ability in these countries to bring water into irrigation.
5. Contribution of blue and green virtual water in global food trade
In order to specifically estimate the contribution of green and blue water in total virtual
20
water trade, a virtual water partitioning is conducted below.
Let C be defined as the ratio of the yield on irrigated land to the yield on rainfed land:
Yi rr
Yrf = C (10)
For individual countries, total crop production can be expressed as:
Pt= Yi rrAi rr+ YrfArf = CYrfAi rr+ YrfArf = Yrf(CAi rr + Arf, (11)
HESSD
3, 1–26, 2006
Virtual water highway
H. Yang et al. Title Page Abstract Introduction Conclusions References Tables Figures J I J I Back Close
Full Screen / Esc
Print Version Interactive Discussion
EGU where Pt is total crop production, Y is crop yield, A is crop sown area, and subscripts
i rr and rf denote, respectively, irrigated and rainfed items.
Crop production that is generated from green water on irrigated land and rainfed land can be calculated as:
Prf = Yrf(Ai rr+ Arf) (12)
5
Crop production that is generated from the supplement of blue water on irrigated land can be calculated as:
Pbw = Pt− Prf = Yrf(CAi rr+ Arf − Ai rr− Arf)= YrfAi rr(C − 1) , (13) where Pbw refers to the production using blue water for irrigation.
As the average yield Yav g can be expressed as:
10 Yav g = Yi rrAi rr+ YrfArf At = CAi rr+ Arf At Yrf (14)
the yield on rainfed land can be calculated as:
Yrf = AtYav g
CAi rr+ Arf =
Pt
CAi rr+ Arf (15)
Replacing Yrf in Eq. (13) with Eq. (15), the contribution of blue water can be specified as:
15
Pbw = PtAi rr(C − 1)
CAi rr+ Arf (16)
In order to estimate Pbw quantities C, Ai rr and Arf for each country need to be de-fined. As C is not available for most of the countries, an average crop yield ratio of 1.5 suggested by the United States 1998 agricultural census (USDA, 2003) is used for all the net food exporting countries. The use of this ratio is reasonable because most
HESSD
3, 1–26, 2006
Virtual water highway
H. Yang et al. Title Page Abstract Introduction Conclusions References Tables Figures J I J I Back Close
Full Screen / Esc
Print Version Interactive Discussion
EGU net food exporting countries are located in the temperate climate zones where
irriga-tion is often supplementary rather than essential. Meanwhile, an average percentage of irrigated areas in individual countries is used for all the crops considered. In real-ity, the percentage of irrigated areas for cereal crops, except for rice, is usually lower than that for vegetables and fruits. Using the average percentage of irrigated areas in
5
the partitioning tends to overestimate the contribution of blue water in the virtual water trade.
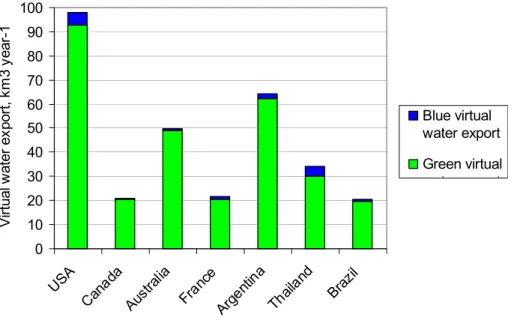
Figure 5 shows the result of the virtual water partitioning for the seven largest food exporting countries. These countries account for about 80% of the total virtual water export. It can be seen that the proportion of blue virtual water export in these countries
10
is considerably low. In Canada, it is negligible. The result shows clearly that the global virtual water export is overwhelmingly “green”.
It should be pointed out that during the past four decades; irrigated areas for the world as a whole have nearly doubled. Most of the increase has taken place in food importing countries (FAO, 2003). Some food exporting countries, however, have also
15
seen significant increases. As a result, overexploitation of water resources has oc-curred in many regions of the world, including those in the exporting countries. In the central and western United States, for example, many rivers and aquifers have been over-exploited causing serious regional water resources depletion and environmental degradation (Postel, 1996). Today, irrigated land accounts for about 17% of the total
20
cropland of the world while producing over 40% of the total food (Rosegrant et al., 2002; Rijsberman, 2002). It is estimated that under the business-as-usual scenario, about 17% increase in irrigation water supply would be needed worldwide to meet the demand for food in the coming 25 years (Rijsberman, 2002). Although most of the increase would be in food importing countries, an expansion in irrigated areas in food
25
exporting countries could also be expected as a result of the increasing demand for their virtual water. This could aggravate the regional resource depletion and environ-mental degradation in food exporting countries on the one hand and reduce the water use efficiency embodied in the global virtual water trade on the other.
HESSD
3, 1–26, 2006
Virtual water highway
H. Yang et al. Title Page Abstract Introduction Conclusions References Tables Figures J I J I Back Close
Full Screen / Esc
Print Version Interactive Discussion
EGU
6. Concluding remarks and policy implications
This study investigated the efficiency gains embodied in the global virtual water trade. The perspectives of exporting and importing countries are specified. The characteris-tics of green and blue water and their contributions in the global virtual water trade are elaborated.
5
The examination shows that water productivity in food exporting countries is gen-erally higher than that in food importing countries. A global water saving, therefore, results from food trade. The contribution from the trading of wheat and maize to the global water saving is particularly large.
Major food exporting countries overall have a low irrigation intensity. The proportion
10
of food production from irrigated areas is considerably small. The global virtual water trade is dominated by green water. Such a trade is efficient in terms of opportunity costs of water use and environmental impacts.
Virtual water import has effectively reduced the water use for food production in the importing countries. For many of these countries, it is often cheaper and less
ecolog-15
ically destructive to import food, especially the water intensive cereal crops, than to transport water to produce the same commodity locally. This strategy is particularly efficient when the world prices of food commodities are lower than the cost of produc-tion in the food importing countries (Wichelns, 2001). Over the last 30 years, the world prices for major cereal crops have declined by about 50% (Rosegrant et al., 2002).
20
Water deficit countries have been able to access the virtual water at the advantageous price. However, it has been projected that in the coming years the decline in food price will be at a slower rate (Rosegrant et al., 2002), posing disincentive to food import. For water rich exporting countries, exporting green water is in line with their comparative advantage in water endowments while the environmental impacts are relatively small.
25
Finally, it must be pointed out that the current global virtual water trade is primarily among the countries above the low-income level in the World Bank country classifi-cation. The efficiency gains from the global virtual water trade are attained mainly by
HESSD
3, 1–26, 2006
Virtual water highway
H. Yang et al. Title Page Abstract Introduction Conclusions References Tables Figures J I J I Back Close
Full Screen / Esc
Print Version Interactive Discussion
EGU these countries. The low income countries have a much less participation in global
virtual water trade. Among many reasons, the low income and consequently the low ability to exploit natural resources and invest in agriculture are largely responsible. The lack of financial resources also deprives these countries’ choice of purchasing food from the international market when the domestic food supply is in shortage. Therefore,
5
one should be cautious to expect miracles from the virtual water concept in addressing the food security problems in poor countries. From the viewpoint of efficient use of global water resources and considering the lack of financial ability in poor countries to develop irrigated agriculture, greater efforts, particularly agricultural technologies and investment, should be devoted to the development of rainfed agriculture. Given the
in-10
creasing scarcity of global blue water resources, more effectively utilizing green water may have to be a direction to which the world agriculture will pursue in the future.
References
Allan, J. A.: Fortunately there are substitutes for water otherwise our hydro-political futures would be impossible, ODA, Priorities for water resources allocation and management, ODA, 15
London, 13–26, 1993.
Allan, J. A.: Virtual water – the water, food, and trade nexus useful concept or misleading metaphor?, Water International, 28, 106–113, 2003.
Cosgrove W. J. and Rijsberman F. R.: Making Water Everybody’s Business, Earthscan Publi-cations Led, London, 2000.
20
Falkenmark, M.: Land-water linkages – A synopsis. Land and Water Integration and river Basin Management, FAO Land and Water Bulletin, No. 1, 15–16, FAO, Rome, Italy, 1995.
FAO: Crop Water Requirements, Irrigation and Drainage Papers No. 24. FAO, Rome, 1986a. FAO: Yield response to water, Irrigation and Drainage Paper No. 33, FAO, Rome, 1986b.
FAO: Database of Land and Water Division of FAO,http://www.fao.org/ag/agl/aglw/aquastat/
25
main/index.stm, 2003.
Hoekstra, A. Y. and Hung, P. Q.: Virtual water trade: a quantification of virtual water flows between nations in relation to international crop trade, in: Virtual water trade, Proceedings
HESSD
3, 1–26, 2006
Virtual water highway
H. Yang et al. Title Page Abstract Introduction Conclusions References Tables Figures J I J I Back Close
Full Screen / Esc
Print Version Interactive Discussion
EGU
of the international expert meeting on virtual water trade, Delft, The Netherlands, edited by: Hoekstra, A. Y., Research Report Series No. 12, 2002.
Merrett, S.: Virtual water – A discussion – Virtual water and Occam’s razor, Water International, 28, 103–105, 2003.
Oki, T., Sato, M., Kawamura, A., Miyake, M., Kanae, S., and Musiake, K.: Virtual water trade 5
to Japan and in the world, in: Virtual water trade, Proceedings of the international expert meeting on virtual water trade, Delft, The Netherlands, edited by: Hoekstra A. Y., Research Report Series No. 12, 2002.
Postel, S.: Dividing the Waters: Food Security, Ecosystem Health, and the New Politics of Scarcity, World Watch Institute, Washington, DC, USA, 1996.
10
Rijsberman, F.: Troubled water, water troubles: overcoming an important constraint to food se-curity, in: Sustainable food security for all by 2020, Proceedings of an International
Confer-ence, 4—6 Sept., Bonn, Germany,http://www.ifpri.org/pubs/books/2020conpro.htm, 2002.
Rockstr ¨om, J.: On-farm green water estimates as a tool for increased food production in water scarce regions, Phys. Chem. Earth (B), 24, 375–383, 1999.
15
Rosegrant, M., Cai, X., and Cline, S.: World water and food to 2025, International Food Policy Research Institute (IFPRI), Washington D. C., 2002.
Seckler, D., Amarasinghe, U., Molden, D., Rhadika, deS., and Barker, R.: World water demand and supply, 1990 to 2025: Scenarios and issues, Research Report No. 19, Colombo, Sri Lanka: International Water Management Institute, 1998.
20
Savenije, H.: Water scarcity indicators: the deception of the numbers, Phys. Chem. Earth (B), 25, 199–204, 2000.
United Nations Statistic Division (UN): Commodity trade statistics data base (COMTRADE), CD-Rom, 2003.
United States Agricultural Department (USDA): Census of Agriculture,http://www.nass.usda.
25
gov/Census of Agriculture/index.asp, 2003.
Wichelns, D.: The role of “virtual water” in efforts to achieve food security and other national goals, with an example from Egypt, Agricultural Water Management, 49, 131–151, 2001. Yang, H., Reichert, P., Abbaspour, K. C., and Zehnder, A. J. B.: A water resources threshold
and its implications for food security, Environmental Science and Technology, 37, 3048–3054, 30
2003.
Yang, H. and Zehnder, A. J. B.: Water scarcity and food import – a case study for southern Mediterranean countries, World Development, 30, 1413–1430, 2002.
HESSD
3, 1–26, 2006
Virtual water highway
H. Yang et al. Title Page Abstract Introduction Conclusions References Tables Figures J I J I Back Close
Full Screen / Esc
Print Version Interactive Discussion
EGU
Zehnder, A. J. B., Yang, H., and Schertenleib, R.: Water issues: the need for actions at different levels, Aquatic Sciences, 65, 1–20, 2003.
Zimmer, D. and Renault, D.: Virtual water in food production and global trade: review of method-ological issues and preliminary results, in: Virtual water trade, Proceedings of the interna-tional expert meeting on virtual water trade, Delft, The Netherlands, edited by: Hoekstra A. 5
HESSD
3, 1–26, 2006
Virtual water highway
H. Yang et al. Title Page Abstract Introduction Conclusions References Tables Figures J I J I Back Close
Full Screen / Esc
Print Version Interactive Discussion
EGU
Table 1. Major food crops included in the virtual water accounting.
Commodity groups Specific commodities
Cereals Wheat, rice, maize, barley, sorghum, millet, others
Starchy roots Cassava, potatoes, sweet potatoes, other roots
Sugar crops and sugar Sugar cane, sugar beat, sugar (raw equivalent)
Oil crops and oil Soybeans, groundnuts, sunflower seeds, soybean oil,
HESSD
3, 1–26, 2006
Virtual water highway
H. Yang et al. Title Page Abstract Introduction Conclusions References Tables Figures J I J I Back Close
Full Screen / Esc
Print Version Interactive Discussion
EGU
Table 2. Global Virtual Water Import and Export and the Scale of Water Saving, average over
* 1997–2001.
Crops Global gross Global gross Global water saving
virtual water virtual water Volume Ratio of virtual
import export (km3year−1) water saving to total
(km3year−1) (km3year−1) virtual water import
Wheat 318.8 188.4 130.3 40.9 Rice 53.5 63.2 −10.1 −18.8 Maize 97.3 39.5 57.4 59.0 Barley 55.1 31.7 20.1 36.4 Soybean 104.9 67.3 37.1 35.3 Others** 351.1 249.2 101.9 29.0 Total 980.7 644.0 336.8 34.3
* An average of 15% sugar content is used to convert sugar (raw equivalent) to sugar crop weight equivalent. An average of 30% oil content is used to convert oil to oil crop weight equivalent.
HESSD
3, 1–26, 2006
Virtual water highway
H. Yang et al. Title Page Abstract Introduction Conclusions References Tables Figures J I J I Back Close
Full Screen / Esc
Print Version Interactive Discussion
EGU
Table 3. Characteristics of the blue and green water.
Type of water Blue Green
Sources rivers, lakes, reservoirs,
ponds, aquifers
water that is stored in the unsaturated soil and can be used for evapotranspi-ration
Mobility highly mobile highly immobile
Substitution of sources Possible impossible
Competitive uses Many few
Conveyance facilities Required not required
Cost of use High low
Impact on hydrological system Significant less significant
Adverse effects on soil significant (e.g.
saliniza-tion and water logging)
HESSD
3, 1–26, 2006
Virtual water highway
H. Yang et al. Title Page Abstract Introduction Conclusions References Tables Figures J I J I Back Close
Full Screen / Esc
Print Version Interactive Discussion EGU
1
Fig. 1.
Crop evapotranspiration , ETc Crop coefficient, KcRef. crop evapotranpiration, ET0
Climatic parameters
Crop water requiretment, CWRc
Crop yield, CYc
Virtual water content Water productivity
Fig. 1. Steps of the estimation of virtual water contents.
HESSD
3, 1–26, 2006
Virtual water highway
H. Yang et al. Title Page Abstract Introduction Conclusions References Tables Figures J I J I Back Close
Full Screen / Esc
Print Version Interactive Discussion EGU Fig. 2. Barley Maize Rice Wheat 7 0 0 0 0 7 0 0 0 1 4 0 0 0M i l e s Legend
unit: g/cubic meter
unit: g/cubic meter no data 0 - 150 150 - 300 300 - 450 450 - 600 600 - 1000 1000 - 2700 7 0 0 0 0 7 0 0 0 1 4 0 0 0M i l e s Legend
unit: g/cubic meter
unit: g/cubic meter no data 0- 300 300 - 600 600 - 900 900 - 1200 1200 - 1500 1500 - 4500 7 0 0 0 0 7 0 0 0 1 4 0 0 0M i l e s Legend
unit: g/cubic meter
unit: g/cubic meter
no data 0 - 150 150 - 300 300 - 450 450 - 600 600 - 900 900 - 2400 7 0 0 0 0 7 0 0 0 1 4 0 0 0M i l e s Legend
unit: g/cubic meter
unit: g/cubic meter no data 0- 150 150 - 300 300 - 450 450 - 600 600 - 750 750 - 1200 Barley Maize Rice Wheat 7 0 0 0 0 7 0 0 0 1 4 0 0 0M i l e s Legend
unit: g/cubic meter
unit: g/cubic meter no data 0 - 150 150 - 300 300 - 450 450 - 600 600 - 1000 1000 - 2700 7 0 0 0 0 7 0 0 0 1 4 0 0 0M i l e s Legend
unit: g/cubic meter
unit: g/cubic meter no data 0- 300 300 - 600 600 - 900 900 - 1200 1200 - 1500 1500 - 4500 7 0 0 0 0 7 0 0 0 1 4 0 0 0M i l e s Legend
unit: g/cubic meter
unit: g/cubic meter
no data 0 - 150 150 - 300 300 - 450 450 - 600 600 - 900 900 - 2400 7 0 0 0 0 7 0 0 0 1 4 0 0 0M i l e s Legend
unit: g/cubic meter
unit: g/cubic meter no data 0- 150 150 - 300 300 - 450 450 - 600 600 - 750 750 - 1200
Fig. 2. Water productivity of major food crops by country, average over 1997–2001.
HESSD
3, 1–26, 2006
Virtual water highway
H. Yang et al. Title Page Abstract Introduction Conclusions References Tables Figures J I J I Back Close
Full Screen / Esc
Print Version Interactive Discussion
EGU
3
Fig. 3.
Fig. 3. Virtual water flows by regions, average over 1997–2001.
HESSD
3, 1–26, 2006
Virtual water highway
H. Yang et al. Title Page Abstract Introduction Conclusions References Tables Figures J I J I Back Close
Full Screen / Esc
Print Version Interactive Discussion
EGU
4
Fig. 4.
Fig. 4. Ratio of irrigated areas to total cultivated areas, average over 1997–2001.
HESSD
3, 1–26, 2006
Virtual water highway
H. Yang et al. Title Page Abstract Introduction Conclusions References Tables Figures J I J I Back Close
Full Screen / Esc
Print Version Interactive Discussion EGU
5
Fig. 5.
0 10 20 30 40 50 60 70 80 90 100 USA Cana da Aust ralia Fran ce Argent ina Thaila nd Brazil V irt ual w at er ex por t, k m 3 year -1 Blue virtual water export Green virtual t tFig. 5. Blue and green virtual water in major exporting countries, average over 1997–2001.