HAL Id: insu-01590198
https://hal-insu.archives-ouvertes.fr/insu-01590198
Submitted on 19 Sep 2017
HAL is a multi-disciplinary open access
archive for the deposit and dissemination of sci-entific research documents, whether they are pub-lished or not. The documents may come from teaching and research institutions in France or abroad, or from public or private research centers.
L’archive ouverte pluridisciplinaire HAL, est destinée au dépôt et à la diffusion de documents scientifiques de niveau recherche, publiés ou non, émanant des établissements d’enseignement et de recherche français ou étrangers, des laboratoires publics ou privés.
dispersion in shallow fractured crystalline rock
Nicolas Guihéneuf, Olivier Bour, Alexandre Boisson, Tanguy Le Borgne, M.W.
Becker, B. Nigon, M Wajiduddin, Shakeel Ahmed, Jean-Christophe Maréchal
To cite this version:
Nicolas Guihéneuf, Olivier Bour, Alexandre Boisson, Tanguy Le Borgne, M.W. Becker, et al.. Insights about transport mechanisms and fracture flow channeling from multi-scale observations of tracer dispersion in shallow fractured crystalline rock. Journal of Contaminant Hydrology, Elsevier, 2017, 206, pp.18-33. �10.1016/j.jconhyd.2017.09.003�. �insu-01590198�
ACCEPTED MANUSCRIPT
Insights about transport mechanisms and fracture flow channeling from multi-scale observations of tracer dispersion in shallow fractured crystalline rock
N. Guihéneuf a, b, 1, ∗, O. Bour b, A. Boisson a,2, T. Le Borgne b, M. W. Becker c, B. Nigon a,3, M. Wajiduddin d, S. Ahmed e, J.-C. Maréchal f
a
BRGM, D3E, NRE, Indo-French Center for Groundwater Research, Uppal Road, 500007 Hyderabad, India
b
OSUR, Géosciences Rennes, UMR6118 CNRS – Université de Rennes 1, Campus de Beaulieu, 35042 Rennes cedex, France
c
Department of Geological Sciences, California State University Long Beach, Long Beach, California, 90840, United States
d
Indo-French Center for Groundwater Research, Uppal Road, 500007 Hyderabad, India e
National Geophysical Research Institute, Indo-French Center for Groundwater Research, Uppal Road, 500007 Hyderabad, India
f
BRGM, D3E, NRE, 1039 rue de Pinville, 34000 Montpellier, France
Corresponding author: N. Guihéneuf ([email protected]) 1
Present address: G360 Institute for Groundwater Research, University of Guelph, N1G 2W1, Ontario, Canada
2
Present address: BRGM, DAT, Direction régionale Bretagne, 2 rue Claude Jouanet, 35700 Rennes, France
3
Present address: International Geothermal Center Bochum, Bochum, Germany
Keywords: cross-hole tracer tests; single-well injection-withdrawal tracer test; solute transport;
ACCEPTED MANUSCRIPT
1 Introduction
Groundwater flow in fractured bedrock occurs in preferential flow paths that occupy a small fraction of the rock volume (National Research Council, 1996) and may transport contaminant very quickly from point to point (Tsang and Neretnieks, 1998). The complexity of fracture geometry and fracture network connectivity lead to the interaction of high-permeability domains dominated by advection with low-permeability domains characterized by diffusion (National Research Council, 1996). Excluding chemical reactions and sorption, mass-exchange processes in fractured formations can be conceptualized as (1) hydrodynamic dispersion that describes mass spreading related to local mixing, (2) heterogeneous advection that describes mass spreading related to separation of advective pathways, and (3) matrix diffusion related to mass exchange between mobile and immobile zones (Becker and Shapiro, 2003, Bodin et al., 2003). Identifying the respective roles of these different processes is challenging since they may have similar signatures in tracer breakthrough curves. This identification is nevertheless critical as it may lead to different conceptual models of transport.
Tracer experiments conducted in fractured media often display behavior that cannot be properly interpreted with classical solutions of the advection dispersion equation (ADE) (Bodin et al., 2003). The apparent scale-dependent dispersion (Gelhar et al., 1992; Berkowitz, 2002; Zhou et al., 2007; Zech et al., 2015) and the long tailings of breakthrough curves are signatures of anomalous transport, also called non-Fickian transport (e.g., Carrera, 1993; Haggerty et al., 2000; Berkowitz, 2002; Willmann et al., 2008; Kang et al., 2015). While the asymmetric shape of breakthrough curves clearly indicates transport that does not follow the ADE, many processes have been proposed to explain this anomalous behavior (e.g., Haggerty et al., 2000, 2001; Becker
ACCEPTED MANUSCRIPT
and Shapiro, 2000, 2003; Reimus et al., 2003; Willmann et al., 2008; Pedretti et al., 2013; Babey et al., 2015; Kang et al., 2015).
Several authors have explained the long breakthrough curve tailing in fractured formations with the matrix diffusion process (e.g., Neretnieks et al., 1982; Maloszewski and Zuber, 1990, 1993; Moench, 1995; Haggerty et al., 2000; Meigs and Beauheim, 2001; Reimus et al., 2003; Zhou et al., 2007). Matrix diffusion occurs due to mass exchange between mobile zones where water flows in the fractures or channels and immobile zones in which water is stagnant in the porous rock matrix or in the fracture (Rasmuson and Neretnieks, 1986). For instance, Hadermann and Heer (1996) carried out forced-gradient tracer experiments with various conservative tracers in the Grimsel granite and have highlighted the impact of matrix diffusion. In particular, most of tracer tests displayed a breakthrough curve with a power law slope of -1.5, which is characteristic of matrix diffusion (e.g., Haderman and Heer, 1996; Haggerty at al., 2000; Shapiro et al., 2008). Using numerous conservative tracers with different diffusion coefficients during the same experiment (i.e. under forced or natural gradient experiments) is one of the approaches to highlight the evidence of matrix diffusion (e.g., Garnier et al., 1985; Jardine et al., 1999; Callahan et al., 2000; Shapiro, 2001; Meigs and Beauheim, 2001; Cvetkovic and Cheng, 2011) or alternatively to exclude its impact (Becker and Shapiro, 2000).
Channeling of fluid flow is also known to strongly impact solute transport in fractured formations as it produces heterogeneous pathways of different velocities, called hereafter “heterogeneous advection” (Tsang and Neretnieks, 1998; Becker and Shapiro, 2003). At the fracture scale, because of rough wall surfaces and tight fractures, paths of least resistance can be formed that conduct water preferentially (Neretnieks, 1982; Bourke, 1987; Pyrak-Nolte et al.,
ACCEPTED MANUSCRIPT
1987; Hakami and Larsson, 1996). In some cases, it has been shown that less than half of the fracture plane may participate in the overall flow (Bourke, 1987; Abelin et al., 1994, Becker and Tsoflias, 2010). Channeling effects may also have an important impact on solute transport at the network scale and for large distances (Abelin et al., 1991; Tsang et al., 1991, de Dreuzy et al., 2012). Heterogeneous advection induced by fluid flow channeling was found to be the main solute transport process under forced-gradient tracer experiments in fractured crystalline rocks in New Hampshire (Becker and Shapiro, 2000, 2003). In particular, convergent (i.e. cross-borehole tracer test) and weak dipole experiments were performed at the Mirror Lake site using different conservative tracers. All breakthrough curves displayed similar late time behavior characterized by a tailing with a power law slope of -2 (Becker and Shapiro, 2000, 2003).
The joint use of different flow configurations, such as push-pull and convergent tracer tests, is a way to reduce both the conceptual model and parameter uncertainty (Tsang, 1995; Meigs and Beauheim, 2001; Becker and Shapiro, 2003; Nordqvist et al., 2012). In particular, push-pull tracer experiments, also called single-well injection-withdrawal tracer tests, have been used to characterize non-reversible dispersion processes induced by the interaction between diffusion and flow heterogeneity (Kang et al., 2015), mass transfer into rock matrix (Haggerty et al. 2001), sorption processes (Cvetkovic and Cheng, 2011) or reactivity (Istok, 2013; Boisson et al., 2013). Because tracer is injected and withdrawn in the same borehole, mass is expected to travel out and back along approximately the same streamlines in the absence of reactions, sorption, or diffusion (Becker and Shapiro, 2003, Hansen et al., 2016). For a conservative tracer, the breakthrough curve is therefore mainly sensitive to matrix diffusion (Tsang, 1995; Haggerty et al., 2001; Hansen et al., 2016). Indeed, in the absence of heterogeneity and drift, which may be induced by a natural hydraulic gradient, Haggerty et al. (2001) found that the late time behavior
ACCEPTED MANUSCRIPT
of the push-pull test is very sensitive to matrix diffusion. In order to enhance tracer diffusion into immobile zones, a resting phase can be introduced between injection and pumping phases (Istok, 2013). Push-pull experiments can also be used to investigate multiscale heterogeneity if several volumes are investigated (Gouze et al., 2008; Le Borgne and Gouze, 2008; Kang et al., 2015; Shakas et al., 2016). Kang et al. (2015) suggest that flow reversibility in push-pull experiments conducted in fractured bedrock depends not only on velocity distribution but also on velocity correlation (i.e. connectedness in the flow paths through fractures), which can lead to a possible scale dependence of transport processes.
The objective of this study is to investigate the scale dependency of transport phenomena from experiments performed in different flow configurations with varying distances from the injection point. A set of convergent and push-pull tracer experiments was performed at different characteristic distances of investigation ranging from about 4 m to 41 m and for durations ranging from a few hours to more than ten days. Although matrix diffusion is unlikely to be a dominant transport process since crystalline rocks generally display limited matrix porosity (Ohlsson and Neretnieks, 1995), we present push-pull experiments designed to examine this assumption in the present fracture rock setting. All experiments were conducted in a shallow single fracture zone at the Experimental Hydrogeological Park of Choutuppal (Telangana, Southern India) (Guihéneuf et al., 2014; Boisson et al., 2015).
ACCEPTED MANUSCRIPT
2 Experimental setup and modeling
2.1 Site description
The Experimental Hydrogeological Park (EHP) is located in Telangana state of Southern India, at about 60 km from Hyderabad (Figure 1). The EHP has been developed in weathered and fractured Archean granite and consists in twenty-eight boreholes drilled at different depths (max. 70 m deep below ground surface) in a small area. More details about borehole configuration are given in Guihéneuf et al. (2014) and Boisson et al. (2015). Numerous hydraulic tests performed at the site allowed us to propose the hydrogeological conceptual model of the EHP illustrated in Figure 2. This crystalline rock is poorly fractured with few permeable fractures at depth (Guihéneuf et al., 2014; Boisson et al., 2015). The shallowest fracture zone is localized at the top of the fractured granite, in general at 15 to 20 m deep below ground surface.
Figure 1. Location of the Experimental Hydrogeological Park (EHP) in the Telangana state
of Southern India (Latitude: 17°17’47”N; Longitude: 78°55’12”E). Zoom on the borehole location is provided with, in red, the boreholes used for tracer experiments (i.e. convergent and push-pull tracer experiments).
At the whole site, a few additional permeable fracture zones were identified at greater depth in the boreholes, but most of the boreholes located around CH3 present only one deeper fracture zone. Due to overexploitation of the groundwater resource and insufficient recharge, the water level is often below the top of the fractured granite. Under these low water level conditions, the compartmentalization of the aquifer has been highlighted due to limited
ACCEPTED MANUSCRIPT
connectivity of the deeper flowing fracture zones (Guihéneuf et al., 2014). Especially, the deeper fracture zone around CH3 is not connected to the surrounding compartments under these conditions. This characteristic is particularly interesting for conducting tracer tests because it isolates the site from ambient regional flow or farming pumping boreholes during the experiments limiting potential tracer drift. Consequently, solute transport has been investigated under forced-gradient tracer experiments into the deeper permeable fracture zone. We applied both convergent and push-pull tracer experiments under low water level conditions (Figure 3). We chose to perform the tracer experiments around the CH3 borehole where the deepest fracture zone is located between 25.5 and 27 m and has been characterized through multiple hydraulic tests (Guihéneuf et al., 2014; Boisson et al., 2015).
ACCEPTED MANUSCRIPT
Figure 2. Conceptual hydrogeological model of the Experimental Hydrogeological Park
(modified from Guihéneuf et al., 2014).
2.2 Convergent tracer experiments
Three convergent tracer experiments were performed during the low water level condition period into the same fracture zone (i.e. the deeper permeable fractures) for different flow configurations and at different distances between injection and pumping boreholes (Figure 3 (a)). The experiments were performed with low pumping rates due to the low transmissivity of the fracture zone ranging from about 5×10⁻⁵ to 5×10⁻⁴ m2 s-1 (Guihéneuf et al., 2014; Boisson et al., 2015). The experiments lasted between a few days to about two weeks. The first convergent tracer experiment was conducted between CH3 (injection borehole) and CH12 (pumping borehole) at a distance of 5.5 m for a pumping rate of 1.1 m3 h-1 (Table 1). The second convergent tracer experiment was achieved between CH3 (injection borehole) and CH11 (pumping borehole) at a distance of 30 m for a pumping rate of 0.5 m3 h-1 (Table 1). The last convergent tracer experiment was achieved between CH10 (injection borehole) and CH11 (pumping borehole) at a distance of 41 m for a pumping rate of 0.5 m3 h-1 (Table 1). Tracer solution was injected within the fracture zone, at least two hours after start of the pumping, under quasi-steady-state hydraulic conditions. A single-packer was positioned in the injection borehole just below the flowing fracture zone to force the tracer to flow within the fracture zone (Figure 3). A second single-packer was positioned between the shallow and deeper flowing fracture zones in the pumping borehole for two tracer experiments (i.e. CH3 to CH11 and CH10 to CH11) to pump only from the deeper fracture zone. Note that except at the CH11 borehole, the
ACCEPTED MANUSCRIPT
water level was sufficiently low at the time of the experiments so that only the deeper permeable fracture zone was tested.
Figure 3. Schematic illustrations of forced-gradient tracer experiments performed at the
Experimental Hydrogeological Park: (a) convergent tracer test between two boreholes, (b) push and pull phase during push-pull tracer experiments.
The tracer used was fluorescein (also called uranine), a fluorescent dye with low chemical interactions with the host rock. Measurements were performed with a borehole fluorometer GGUN-FL24, which has a typical detection limit of 0.02 ppb for fluorescein (Schnegg, 2002). The fluorescein presents a pH dependency that may affect the detection limit (Leibundgut et al., 2009; Gerke et al., 2013). Below a pH of 9, fluorescein loses a bit of intensity due to degradation of the compound (Leibundgut et al., 2009). The measured pH values in the
ACCEPTED MANUSCRIPT
experimental site were relatively constant with a mean value of about 6.8. To take into account the pH dependency, calibration of the borehole fluorometer was done with water from the site. Based on this calibration, the measured concentration of fluorescein has been found to be valid within the range of 1 and 400 ppb. Note also that fluorescein, which has an anionic carboxylic group, presents negligible sorption onto negatively charged sandstone or silica for neutral pH (Kasnavia et al., 1999; Sabatini, 2000). Consequently, feldspars or quartz surfaces should not react with fluorescein. Regarding biotite, another important mineral in granitic rock, Bray et al. (2014) have shown that under a pH value less than 9, due to removal of K, Mg, Al and Fe which are not charge conservative, biotite has a negative surface charge. Thus, sorption processes should not significantly impact tracer experiments performed with fluorescein in the considered fractured granite.
Table 1. Characteristics of convergent tracer experiments. Vinj is the injected volume of the tracer solution, Vchaser is the injected volume of the chaser (i.e. without tracer) and C0 is the initial concentration of the tracer solution.
Name of experiment Injection borehole Pumping borehole Distance Pumping rate Injection rate Mass
injected Vinj Vchaser C0 (m) (m3 h-1) (m3 h-1) (g) (l) (l) (ppb) CH3 - CH12 CH3 CH12 5.5 1.1 0.47 1.0 62 20 16229 CH3 - CH11 CH3 CH11 30.2 0.5 0.33 5.5 80 4 68750 CH10 - CH11 CH10 CH11 41 0.5 0.43 3.0 80 4 37534
ACCEPTED MANUSCRIPT
2.3 Push-pull tracer experiments
Seven push-pull tracer experiments were performed at different scales in the deeper fracture zone between straddle packers (Figure 3 (b)) in order to investigate potential scale dependence of transport processes. Except for one push-pull tracer experiment, which will be detailed below, all push-pull tracer experiments were done with fluorescein. Injections were achieved by injecting the tracer solution chased by fresh water extracted previously from the formation. The tracer solution and chaser were injected at the same flowrate. All tracer solutions were injected for 5 min and then were followed by a chaser for the rest of the push time. Two push times were chosen to evaluate the impact of the volume of investigation. Push times were either 14 min or 55 min, and push-pull tracer experiments were achieved with or without resting phase. A resting phase of about 1 h was introduced in some cases in order to measure a potential drift of tracer induced by the natural hydraulic head gradient. Such a resting phase should also allow more tracer to diffuse into the immobile zones and consequently provide information on matrix diffusion (Tsang, 1995). Technical details, including injection and pumping rates or mass injected of push-pull experiments conducted in CH3 and CH10, are provided in Table 2.
To further investigate the potential effect of matrix diffusion, a long duration push-pull tracer experiment was performed between straddle packers in the same deeper fracture zone in the CH10 borehole with a cocktail of two conservative tracers. This long duration push-pull tracer experiment was achieved with a continuous injection of 187 min (equivalent injected volume of 1289 L) of both fluorescein and sodium chloride. Sodium chloride and fluorescein have different diffusion coefficients so that a comparison of the late time behaviors in the breakthrough curves should provide more information about diffusion processes (e.g., Garnier et
ACCEPTED MANUSCRIPT
al., 1985; Jardine et al., 1999; Becker and Shapiro, 2000). The diffusion coefficient for fluorescein is estimated to be 4.5×10⁻¹⁰ m2 s-1 (Skagius and Neretnieks, 1986) in free water at 25°C while it is about 1.6×10⁻⁹ m2 s-1 for sodium chloride (Flury and Gimmi, 2002). According to Stokes-Einstein equation for Brownian diffusion (summarized in Kessler and Hunt (1994)), these coefficients once recalculated at 30°C, which corresponds to groundwater site temperature (Guihéneuf et al., 2014), correspond to 5.6×10⁻¹⁰ m2 s-1 for fluorescein and 2.0×10⁻⁹ m2 s-1 for sodium chloride. Conductivity monitoring was achieved with a CTD Diver with an accuracy of 10 µS cm-1. The probe was previously calibrated to convert conductivity data into sodium chloride concentrations. Conductivity background of groundwater from the site was taken into account in the breakthrough curve. Since this long-duration test was performed using a continuous tracer injection, as opposed to a pulse injection, it cannot be directly compared to the other push-pull tests. However, taking the derivative of the breakthrough curve provides an equivalent of a pulse injection. Thus we compare the derivative of the long term push-pull experiment to the short term push-pull experiments.
ACCEPTED MANUSCRIPT
Table 2. Characteristic of push-pull tracer experiments performed in boreholes CH3 and
CH10. Note that all tracer solutions were injected during 5 min and then followed by a chaser for the rest of the push time. Vinj is the injected volume of the tracer solution, Vchaser is the injected volume of the chaser (i.e. without tracer) and C0 is the initial concentration of the tracer solution. Tested borehole tpush Resting phase Injection rate Pumping rate Mass injected Vinj_total C0 (min) (min) (m3 h-1) (m3 h-1) (g) (l) (ppb) CH3 14 - 0.60 0.53 6.0 × 10 -2 139 1303 CH3 14 66 0.60 0.59 6.0 × 10 -2 139 1305 CH3 55 69 0.59 0.59 2.1 × 10 -1 544 4520 CH10 14 - 0.52 0.53 1.4 × 10 -2 121 361 CH10 14 66 0.52 0.53 1.3 × 10 -2 121 368 CH10 55 - 0.52 0.53 1.6 × 10 -2 477 379 CH10fluorescein 187 60 0.41 0.43 4.7 × 10 -1 1289 368 CH10NaCl 187 60 0.41 0.43 1483 1289 1150504
It has been previously shown that a density contrast of 1.15×10⁻³ between groundwater and the tracer solution may impact breakthrough curves in horizontal fractures (Tenchine and Gouze, 2005; Bouquain et al., 2011). By contrast, Becker (2003) has shown that under the considered forced hydraulic conditions, a density contrast of 1.31×10⁻² between two tracer experiments conducted in fractured crystalline bedrock did not affect the breakthrough curves. Indeed, such effect is expected to depend on the flow velocities. In Becker’s (2003) study, the injection and withdrawal wells were separated by a distance of 36 m, the pumping rate was about 0.6 m3 h-1 and the peak arrival time was at 155 min approximately, which corresponds to a mean
ACCEPTED MANUSCRIPT
velocity of 13.9 m h-1. Thus, these conditions are comparable to our configuration (see Table 2 and 3 for both push-pull and convergent experiments) and because the density contrast is smaller than one order of magnitude in our case, we expect that density effects are negligible.
An impact of sodium chloride might also be expected on fluorescence measurements. Magal et al. (2008) have investigated this effect of highly saline groundwater on the use of fluorescent dyes, as fluorescein. They found that fluorescence intensity of fluorescein was unaffected by the solution salinity. They also investigated the sorption of dyes on natural sediments and pure minerals for high salinities. They found that fluorescein has a moderate sorption affinity and can be used at salinities up to 110 g Cl l-1. In our case, chloride concentration was about 0.7 g l-1, which was relatively low, so sorption of fluorescein should not be significant for this experiment.
2.4 The multipath model of Becker and Shapiro (2003)
An analytical model is used to simulate tracer transport and test some hypotheses about transport processes. The multipath model developed by Becker and Shapiro (2003) was proposed for convergent, weak dipole and push-pull tracer experiments but we consider here only the convergent and push-pull configurations. The reader is referred to the original article for a full description but the concepts are summarized as follows. By neglecting matrix diffusion, it is assumed that dispersion of tracer is produced by hydrodynamic dispersion (local mixing phenomenon) and heterogeneous advection induced by separation of mass in discrete flow pathways of different velocities. Transport through each channel is represented by the first-passage-time (FPT) transfer function (Becker and Charbeneau, 2000) corresponding to a flux-averaged solution of the advection-dispersion equation. This solution allows for proper summation of transport in channels at the extraction well.
ACCEPTED MANUSCRIPT
For radially convergent tracer experiments, the conceptual model implies that injected tracer mass entering each path is proportional to the cube of the mean aperture along each path (according to the cubic law). Travel time along each path is dictated by the mean velocity, which is proportional to the square of the mean aperture along the path (also according to the cubic law). Consequently, individual breakthrough curves scale as a power of 3 in total mass and a power of 2 in mean arrival time. Summing these individual breakthrough curves at the withdrawal well turns out to produce a characteristic -2 power law tail in the composite breakthrough curve. It is convenient to express the mean aperture along each pathway with respect to the maximum mean aperture in all channels (R= H/Hm ax).
For the push-pull configuration, tracer is injected and then withdrawn from the same well. The model is appropriately modified to consider a period of radially divergent transport of tracer followed immediately by a convergent transport of tracer. Mathematically, this is the convolution of a probability density function (divergent/push phase) and a first-passage-time function (convergent/pull phase). The unique quality of push-pull tests is that apparent dispersion due to heterogeneous advection along varying pathways during the push is reversed during the pull, leaving only the influence of true hydrodynamic dispersion. Hydrodynamic dispersivity is assumed to be identical and constant for each channel. Variation in breakthrough during the pull phase is a function only of the velocity (or mean residence time) in the channels. Channels with larger mean velocity exhibit greater hydrodynamic dispersion than those with smaller mean velocity. A drawback of the push-pull tests, however, is that there is no characteristic length scale. One cannot know how far the tracer travelled outward during the push phase. Consequently, the modeled parameter is the mean residence time of the push phase, push, which is defined as:
ACCEPTED MANUSCRIPT
𝜏𝑝𝑢𝑠ℎ =𝑡𝑝𝑢𝑠ℎ 𝛼2
𝑄
2𝜋𝐻, (1)
where, tpush is the duration of tracer injection, Q is the injection/pumping rate, H, is the mean fracture aperture in the channel, and α, is the longitudinal hydrodynamic dispersivity. If the mean fracture aperture is evaluated from a convergent experiment, the dispersivity can be deduced a
posteriori from (1).
To illustrate the relation between the shape of the total breakthrough curve and the investigated distances, Figure 4 displays synthetic simulations of the push-pull experiment for values of τpush ranging from 10 to 10000. Power law slopes for the late time behavior ranging from -2 to -6.8. For a larger investigated distance, or a higher τpush value, the mean velocity sampled by the tracer is lower and results in a less dispersed breakthrough curve.
ACCEPTED MANUSCRIPT
Figure 4. Simulations of push-pull breakthrough curves for different values of τpush.
3 Results
3.1 Analysis of late time breakthrough curves
3.1.1 Convergent experiments
Figure 5 presents, in a log-log plot, the breakthrough curves for the three convergent tracer experiments performed with fluorescein in the same fracture zone. All convergent experiments displayed a mass recovery of more than 80% (Table 3). Note however that the breakthrough curve obtained for the tracer experiment performed between boreholes CH3 and CH12 was not fully recorded because of the saturation of the borehole fluorometer for the higher concentrations (> 400 ppb). Consequently, mass recovery calculated for this tracer experiment is about 76% but, should be in reality more than 80%. Table 3 also provides the first and peak arrival times for all tracer experiments performed. The short transfer times observed imply high velocities in the fractures, which can be related to the low fracture equivalent apertures.
Table 3. Primary results of convergent tracer experiments.
Name of experiment First arrival time Peak arrival time Mass recovery Breakthrough duration Mean velocity (min) (min) (%) (h) (m h-1) CH3 - CH12 2 - > 75.7 20 26.4 CH3 - CH11 75 142 92.4 124 12.8 CH10 - CH11 246 831 80.2 249 3.0
ACCEPTED MANUSCRIPT
Figure 5. Normalized breakthrough curves obtained for convergent tracer experiments
performed at different distances between boreholes.
Two convergent experiments (i.e. CH3 to CH12 with 5.5 m between boreholes and CH10 to CH11 with 41 m between boreholes) present an inflexion in the breakthrough curves potentially suggesting the existence of, at least, two main independent flow pathways and thus highly channelized transport.
The late time breakthrough curves for the convergent tracer experiments performed from CH3 to CH12 and CH3 to CH11 are characterized by a similar power law slope of -2 (Figure 5). Power law tailing is observed in the log-log plot for at least two orders of magnitude in concentration and one order of magnitude in time. Moreover, this power law slope is observed for tracer experiments performed at different distances between injection and pumping boreholes and for different pumping rates. Note that the late time behavior of the tracer experiment CH10 to CH11, which spanned the largest distance between wells and, hence, the largest volume of investigation, does not present a clear power law slope. This particular point will be investigated in the modeling section.
3.1.2 Push-pull experiments
3.1.2.1 Pulse push-pull experiments
All push-pull tracer experiments performed with fluorescein achieved a mass recovery of more than or close to 80% (Table 4). All mass recoveries, which are relatively low for push-pull experiments, were determined from concentrations within the range of measurement capabilities of the fluorometer, 1 and 400 ppb. Thus measurements below 1 ppb were omitted from
ACCEPTED MANUSCRIPT
calculations. About one or two percent of the missing mass might be attributed to the limitation of the fluorometer and few others percent to the cumulative errors of measurements (i.e. flow rate, injected mass or measured concentrations). Figure 6 (a and b) presents, in a log-log plot, the breakthrough curves obtained for push-pull experiments performed in boreholes CH3 and CH10 with a push time of 14 min (or injected volumes of, respectively, 139 and 121 L, Table 2). These push-pull tracer experiments were achieved with and without a resting phase of about 1 h. The late time behaviors in the breakthrough curves, with and without resting phase, present similar power law slopes close to -3. Consequently, the resting phase did not seem to significantly affect the late time behaviors in the breakthrough curves, and no significant drift or decline of tracer concentrations are observed for these experiments.
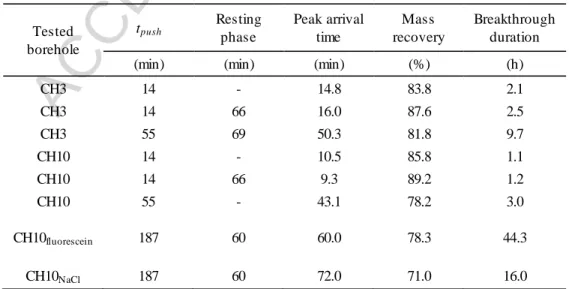
Table 4. Primary results of push-pull tracer experiments.
Tested borehole tpush Resting phase Peak arrival time Mass recovery Breakthrough duration (min) (min) (min) (%) (h) CH3 14 - 14.8 83.8 2.1 CH3 14 66 16.0 87.6 2.5 CH3 55 69 50.3 81.8 9.7 CH10 14 - 10.5 85.8 1.1 CH10 14 66 9.3 89.2 1.2 CH10 55 - 43.1 78.2 3.0 CH10fluorescein 187 60 60.0 78.3 44.3 CH10NaCl 187 60 72.0 71.0 16.0
ACCEPTED MANUSCRIPT
Figure 6. Normalized breakthrough curves obtained for push-pull tracer experiments
performed for push time of 14 min with and without resting phase of about 1 h (a) in CH3 and (b) in CH10.
To examine the effect of the volume of investigation, Figure 7 presents the breakthrough curves obtained for push-pull experiments carried out in boreholes CH3 and CH10 for two different push times (or injected volume at constant injection rate). We present the push-pull tracer experiments achieved in CH3 with a resting phase (Figure 7 (a)) and in CH10 without resting phase (Figure 7 (b)). These tracer tests were performed first with a push time of 14 min (showed previously in Figure 6) and subsequently with a push time of 55 min. For the push-pull tracer experiments performed in CH3, the equivalent injected volumes for these push times were respectively 139 L and 544 L (Table 2). For the push-pull tracer experiments performed in CH10, the equivalent injected volumes were 121 L and 477 L for these push times (Table 2). The late time behaviors for these push-pull experiments follow a power law slope close to -3 for a push time of 14 min (with or without resting time) and a power law slope close to -2.5 for a push time of 55 min (with or without resting time). Regarding the time passed before starting the withdrawal phase, which is expected to increase the impact of matrix diffusion and thus would
ACCEPTED MANUSCRIPT
decrease the power law exponent of the tailing (Haggerty et al., 2001), the push-pull experiments performed in CH3 with a push time of 14 min and a resting phase of 66 min may be comparable to the push-pull experiments performed in CH10 with a push time of 55 min and without resting phase. However, they display different late time behaviors as mentioned above. Consequently, the power law exponent decreases as push time increases and seems to be more dependent on the volume of investigation than on the time passed before starting the withdrawal phase.
Figure 7. Normalized breakthrough curves obtained for push-pull tracer experiments
performed for (a) push time of 14 min and 55 min with resting phase of about 1 h in CH3 and (b) push time of 14 min and 55 min without resting phase in CH10.
3.1.2.2 Long duration push-pull experiment with two tracers
To estimate the impact of diffusion, we also performed one long duration push-pull experiment with two conservative tracers of different diffusion coefficients, injected at the same time. The experiment was carried out with a cocktail of fluorescein and sodium chloride. The continuous injection of tracers was achieved during 187 min (equivalent of 1289 L) between straddle packers. The mass recoveries were respectively, 78.3% for fluorescein and 71% for the sodium chloride, comparable to other push-pull experiments performed with only fluorescein
ACCEPTED MANUSCRIPT
(Table 4). The Figure 8 presents the equivalent pulse injection of both tracers obtained from the derivative of the continuous injection breakthrough curves. The late time behaviors in the breakthrough curves were both similar and close to a power law slope of -2.3. Thus, because tracers with different diffusion coefficients had similar tailing, diffusion into the immobile zones cannot explain this behavior. In addition, this late time behavior confirms that, for a sufficiently large injection volume, the power law exponent of the late time behavior decreases as push time increases.
Figure 8. Normalized derivative breakthrough curves obtained for long duration push-pull
tracer experiment performed in CH10 with fluorescein and sodium chloride tracers for push time of 187 min.
ACCEPTED MANUSCRIPT
3.1.3 Synthesis of observations and assumptions for modeling
The breakthrough curves for two convergent experiments performed under different flow configurations and at different distances between injection and pumping points exhibited late time behaviors following a -2 power law slope, which differs from the characteristic slope of -1.5 for matrix diffusion (e.g., Haderman and Heer, 1996; Haggerty at al., 2000). The -2 power law slope may suggest the predominance of heterogeneous advection, as shown previously by Becker and Shapiro (2000, 2003). Moreover, the convergent experiment with a tracer breakthrough duration of 249 hours did not display a lower power law exponent than shorter term experiments. As a consequence, a longer residence time of the tracer in the formation did not impact the tailing, in contrast to the expected impact of matrix diffusion that would decrease the power law exponent of the tailing.
The single long term push-pull experiment performed with two different tracers injected simultaneously displays a similar late time behavior for both tracers, even though these have different diffusion coefficients. Consequently, this behavior suggests that both breakthrough curves were affected by the same processes and were not dominated by matrix diffusion.
All pulse push-pull experiments performed with fluorescein were more sensitive to the investigated volume than to the residence time of the tracer in the formation. Indeed, with or without a resting phase, the power law exponents are similar, but the power law exponents are different when the investigated volumes are different, even for comparable times passed before the withdrawal phase. This behavior shows that matrix diffusion is not a dominant process since
ACCEPTED MANUSCRIPT
a greater tracer residence time should allow the tracer to diffuse more into the immobile zones (e.g. Haggerty et al., 2001).
As a consequence, our data set seems to reveal an apparent scale effect related to heterogeneity in both configuration, especially in push-pull configuration where the power law exponent decreases as push time increases. In addition, matrix diffusion appears to have no significant impact on the breakthrough curves in our experiments. Hence, we will consider focusing our modeling on heterogeneous advection rather than matrix diffusion. The purpose of the modeling is to discuss our observations with a relatively simple conceptual model in a consistent framework rather than providing a model or a set of models that can explain the entire data set. In particular, our objective is to evaluate first if information about a possible correlation length characterizing the fracture geometry or the velocity field can be extracted from the multi-scale data set by testing the hypothesis of independent flow pathways. Secondly, we want to verify if matrix diffusion can be effectively neglected in our experiments. Hence, we have chosen the multipath model developed by Becker and Shapiro (2003) which does not take into account the matrix diffusion and considers independent flow pathways (see description of the model in 2.4).
3.2 Modeling of the experiments
3.2.1 Convergent transport model
Figure 9 presents the modeling of the tracer experiment performed between CH3 and CH11 through the multipath model developed by Becker and Shapiro (2003). We compare it to the first-passage-time (FPT) transfer function (Becker and Charbeneau, 2000) with the same
ACCEPTED MANUSCRIPT
dispersivity and effective volume of the formation. As expected, the prediction of the flux-averaged solution based on Fickian transport fails to represent the late time behavior while the multipath model matches very well the whole dataset.
Figure 9. Normalized breakthrough curves obtained for convergent tracer experiment
performed between CH3 (injection borehole) and CH11 (pumping borehole), interpretation with the multipath model (Becker and Shapiro, 2003) and prediction with the first-passage-time (FPT) model for the same dispersivity (Becker and Charbeneau, 2000).
The inflexion in the breakthrough curves observed for the two other convergent experiments (i.e. CH3 to CH12 and CH10 to CH11) suggests at least two discrete flow pathways. To represent this behavior, we used a superposition of two distinct pathways. For the CH3-CH12 experiment, which displays a -2 power law slope, transport was represented by the multipath model for each distinct pathway. In contrast, for the CH10-CH11 experiment which does not display a clear power law slope, transport was represented by the first-passage-time (FPT) model. Figure 10 presents the simulated breakthrough curves obtained for the tracer experiments performed between CH3 and CH12 (5.5 m separation) and between CH10 and CH11 (41 m separation). In the former case, four parameters are used (mass ratio between paths, dispersivity and effective volume for each path) while five parameters are used in the latter case (in this case, a distinct value of dispersitivity was used for each path). All estimated parameters are presented in Table 5 and estimated dispersivities were quite low (< 1 m) except for the CH10 to CH11 tracer experiments. The largest dispersivity values estimated for this experiment, which was conducted
ACCEPTED MANUSCRIPT
at larger distance between boreholes, may correspond to the values at the fracture scale, while the smaller values of dispersivity for the other experiments are likely related to the channel scale. Thus, an increase of dispersivity and a decrease of number of pathways may suggest a transition from independent to connected flow pathways with increasing scale of investigation. Note that the estimated equivalent aperture is about 1 to 2 mm in most cases (calculated from the effective volume of the formation), which seems very reasonable for this type of permeable media.
In order to relate our observations to field heterogeneities, we also calculated the Taylor dispersion coefficient for each tracer experiment, which depends only on fracture aperture (smooth fracture of constant aperture), the mean fluid velocity and the diffusion coefficient of tracer in free water (Kessler and Hunt, 1994; Zhou et al., 2007). Using the dispersivity values previously estimated and the volume equivalent aperture, the Taylor dispersion coefficient is negligible, lower than a percent compared to the field-scale dispersion, except for one test. Indeed, the tracer test experiment between CH3 and CH12 provides a higher Taylor dispersion coefficient of 88% compared to field-scale dispersion, which is linked to the higher velocity because of the short distance between wells and higher pumping rate.
ACCEPTED MANUSCRIPT
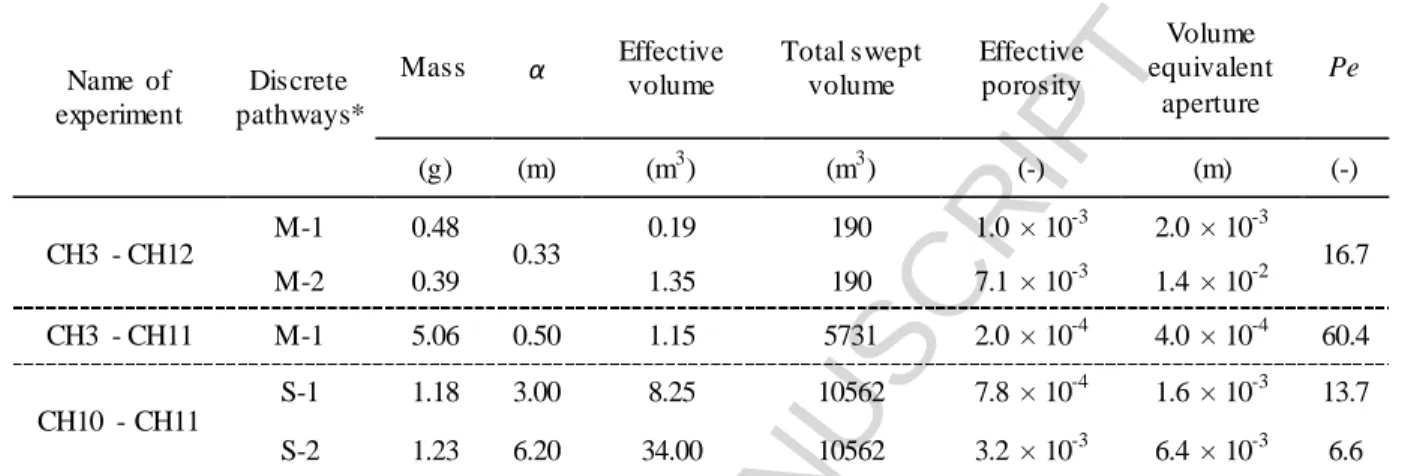
Table 5. Parameters used for transport models in convergent tracer experiments. Total
swept volume is assumed to be π d2 e with d corresponds to the distance between borehole and e
the thickness of injection zone equivalent to 2 m here. Peclet number, Pe, is estimated from the distance between injection and withdrawal wells, divided by the dispersivity, α.
Name of experiment
Discrete pathways*
Mass α Effective volume Total swept volume Effective porosity
Volume equivalent aperture Pe (g) (m) (m3) (m3) (-) (m) (-) CH3 - CH12 M-1 0.48 0.33 0.19 190 1.0 × 10⁻³ 2.0 × 10⁻³ 16.7 M-2 0.39 1.35 190 7.1 × 10⁻³ 1.4 × 10⁻² CH3 - CH11 M-1 5.06 0.50 1.15 5731 2.0 × 10⁻⁴ 4.0 × 10⁻⁴ 60.4 CH10 - CH11 S-1 1.18 3.00 8.25 10562 7.8 × 10⁻⁴ 1.6 × 10⁻³ 13.7 S-2 1.23 6.20 34.00 10562 3.2 × 10⁻³ 6.4 × 10⁻³ 6.6 * “M” for Multipath model and “S” for “Single” discrete path model. The number signifies the first and the second separate fractures.
Figure 10. Normalized breakthrough curves obtained for convergent tracer experiments
performed (a) between CH3 (injection borehole) and CH12 (pumping borehole) and (b) between CH10 (injection borehole) and CH11 (pumping borehole). The models correspond
ACCEPTED MANUSCRIPT
respectively to two discrete flow pathways from (a) the multipath model (Becker and
Shapiro, 2003) and (b) the first-passage-time (FPT)model (Becker and Charbeneau, 2000).
3.2.2 Push-pull transport model
A comparison between simulated and observed breakthrough curves obtained for push-pull tests shows less agreement with the reference model. Figure 11 presents the interpretation with the model and the breakthrough curves for the push-pull tracer experiments carried out in CH10 for push times of 14 min (Figure 11 (a)) and 55 min (Figure 11 (b)). Note that the model is calibrated by varying only the normalized push time, τpush (see section 2). For the experimental push time of 14 min, the best match obtained by adjusting τpush parameter corresponds to a tailing breakthrough with a power law slope close to -3.7 while the power law slope shown by the data set is about -3. The discrepancy between the data and the model is even greater for the push-pull tracer experiment performed with a push time of 55 min. The model predicts a power law slope close to -4.8 while the data set provides a power law slope of -2.5. Figure 12 presents the simulated and observed breakthrough curves obtained for the push-pull tracer experiments carried out in CH3 for a push time of 14 min (Figure 11 (a)) and 55 min where a resting phase was introduced (Figure 11 (b)). The same discrepancy between model predictions and the data set is highlighted. Table 6 provides all results for all push-pull tracer experiments performed in boreholes CH3 and CH10. According to the equivalent aperture of a single fracture obtained by convergent tracer experiments, the estimated dispersivities for the push-pull tracer experiments were about 0.12 m for CH3 and 0.15 m for CH10 (Table 6). The dispersivity value obtained for the long duration push-pull tracer experiment in CH10 has been estimated at 0.22 m. Note that these dispersivities are smaller than those for the cross borehole tracer tests because of the reversibility of a significant part of the dispersion. Indeed, the resulting hydrodynamic
ACCEPTED MANUSCRIPT
dispersion, proportional to transport velocity, is lower in push-pull configuration because tracer mass diverges and converges theoretically along the same streamlines from the same well.
Figure 11. Normalized breakthrough curves obtained for push-pull tracer experiments
performed in CH10 without resting phase for (a) push time of 14 min and (b) push time of 55 min and the interpretation with the multipath model of Becker and Shapiro (2003).
Figure 12. Normalized breakthrough curves obtained for push-pull tracer experiments
performed in CH3 with resting phase of about 1 h for (a) push time of 14 min and (b) push time of 55 min and the interpretation with the multipath model of Becker and Shapiro (2003).
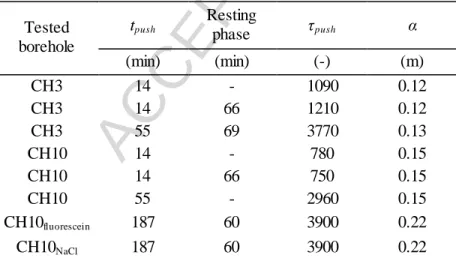
Table 6. Parameters obtained with the multipath model of Becker and Shapiro (2003) for
push-pull tracer experiments performed in boreholes CH3 and CH10.
Tested borehole tpush Resting phase τpush α (min) (min) (-) (m) CH3 14 - 1090 0.12 CH3 14 66 1210 0.12 CH3 55 69 3770 0.13 CH10 14 - 780 0.15 CH10 14 66 750 0.15 CH10 55 - 2960 0.15 CH10fluorescein 187 60 3900 0.22 CH10NaCl 187 60 3900 0.22
A clear discrepancy is observed between the model and the data set for the push-pull tracer tests. The model predicts an increase of the slope of the late time breakthrough curves
ACCEPTED MANUSCRIPT
(Figure 4) while the data set shows the opposite. Note that previous results from Becker and Shapiro (2003) also showed a discrepancy between the model and the data set for a large injection volume push-pull test. In the following section, we discuss the possible dominant transport processes and present suggestions to explain both the good agreement between the model and the data for the convergent tracer tests and the discrepancy between the data and the model for the large volume push-pull tracer tests.
4 Discussion
4.1 The role of channeling and matrix diffusion
The breakthrough curves of two convergent tracer experiments carried out with the same injection location but different observation boreholes (located at distances equal to 5.5 m and 30 m from the injection borehole) show a consistent -2 power law slope for late time behavior. This asymmetric shape on the breakthrough curves is successfully interpreted through the multipath model developed by Becker and Shapiro (2003). This multipath model assumes independent flow pathways of different mean velocities that lead to more dispersed breakthrough curves. This -2 power law slope, also observed from numerical simulations considering advection in heterogeneous systems (Di Donato et al., 2003; Willmann et al., 2008), suggests that advection seems to prevail on transport processes rather than matrix diffusion in our experiments. This statement is consistent with the push-pull experiments showing higher sensitivity to the volume of investigation rather than the residence time of the tracer into the formation (i.e. duration of experiments). In addition, Peclet numbers near or superior to 20 (Table 5) also confirm that advection dominates solute transport in our experiments (Pedretti et al., 2013).
ACCEPTED MANUSCRIPT
Channelized transport has been often reported in fractured crystalline rocks both at the fracture scale and the facture network scale (e.g. Abelin et al., 1994; Tsang and Neretnieks, 1998; de Dreuzy et al., 2012). Since plutonic rocks display very low porosity values with a drastic decrease with depth (Ohlsson and Neretnieks, 1995), it is not surprising that heterogeneous advection may be a dominant solute transport process in our system. Nevertheless, in shallow weathered crystalline rock, weathering of fracture walls may have led to an increase in porosity in the vicinity of the fracture and thus an increase in the effect of matrix diffusion (Ohlsson and Neretnieks, 1995). Sausse (2002) has suggested that an increasing degree of rock alteration is expected to smooth surface asperities of fracture and thus limit channeling effects. In the present case, it seems that the role of weathering is limited, at least in terms of fracture transport properties as the data set suggests highly channelized transport with no significant impact of matrix diffusion. Note however that the effect of heterogeneous advection might be greater under forced gradient conditions as hypothesized by Becker and Shapiro (2003).
4.2 Scale dependence of transport processes
In the convergent configuration, the dispersivities estimated with the multipath model are found to increase with volume of investigation. This observation is consistent with previous observations of the general increase of dispersivity with distance from data compilation of different sites (e.g. Gelhar et al., 1992; Zhou et al., 2007; Zech et al., 2015). However, the dispersivity estimate here may be related to values at the channel scale for small volumes of investigation and at the fracture scale for the largest volume. Indeed, the interpretation of the larger experiment (i.e. a better match of the model) was achieved by reducing the number of pathways (two discrete paths) and increasing their dispersivity. Consequently, our results suggest
ACCEPTED MANUSCRIPT
a transition from independent to connected pathways with scale, that suppose the existence of a correlation length of the velocity field at fracture scale. In addition, this observation also suggests a transition from non-Fickian to Fickian transport when distance of investigation increases, consistent with a less dispersed breakthrough curve for the large experiment.
Interestingly, an inverse phenomenon is observed in push-pull configuration where an increasing volume of investigation leads to more dispersed breakthrough curves. This observation is opposite to the behavior of the multipath model of Becker and Shapiro (2003) which predicts an increase of the power law exponent as push time increases (Figure 4). Indeed, the experimental data show a larger increase of the variance of time arrivals with volume than the model prediction. Thus, the multipath model provides a relatively good solution for a small volume of investigation, which confirms the role of hydrodynamic dispersion on tailing in push-pull configuration. However, the discrepancy between model prediction and data becomes apparent for larger volume of investigation, which has been also observed by Becker and Shapiro (2003) for their largest push volume. We hypothesize here that this behavior is due to non-reversible advective process which becomes apparent when the volume of investigation increases.
The non-reversibility of advective process in push-pull configuration could be linked to the activation of cross channel mass transfer at greater volume of investigation (Kang et al. 2015). Indeed, a ratio of tracer mass traveling along a particular streamline may have the opportunity to diffuse to another streamline of different velocity once the streamlines converge. Cross-channel mass transfer can be thus conceptualized as local transverse diffusion between flow lines which tends to spread out the tracer mass. This phenomenon is activated once the
ACCEPTED MANUSCRIPT
characteristic length of heterogeneity is reached (Kang et al. 2015). Hence, for largest volume of investigation, the number of interconnections among channels may become more important. The assumption of independent pathways by Becker and Shapiro (2003), as well as path reversibility, become erroneous at larger distances to the well.
To summarize the multi-scale observations in both push-pull and convergent experiments, Figure 13 presents conceptual flow lines where pathways are no longer independent at a volume greater than a characteristic length. In particular, this figure illustrates the possibility of mass exchanges by diffusion or local dispersion at intersections between channels that could lead to non-reversible heterogeneous advection in push-pull configuration. We hypothesize that the fracture scale heterogeneity may be represented as a set of finite size channels that become increasingly interconnected at greater distances from the tested borehole. At the first order, the characteristic length might be roughly estimated in push-pull configuration by considering the distance where the multipath model diverges from the data, which has been estimated to be about 4 - 5 m here (i.e. maximum distance of push for the small experiment). However, this estimate appears more difficult in convergent configuration and requires a specific model, but in any case this length seems to be below 30 m. Note that the CTRW model of Kang et al. (2015), which explicitly considers such kinds of processes, might be used to estimate the characteristic length of heterogeneity. By suggesting a transition from independent pathways at small volumes of investigation to connected pathways at larger volumes, our results also suggest that conducting experiments at several scales of investigation is a useful approach to constrain conceptual model uncertainty.
ACCEPTED MANUSCRIPT
Figure 13. Conceptual flow lines in both convergent and push-pull configurations for small
and large volume of investigation. Activation of cross channel mass transfer is illustrated at larger volumes to explain non-reversible heterogeneous advection in push-pull experiment.
5 Conclusions
We report a multi-scale observation of tracer dispersion from different flow configurations in a single fracture zone located at shallow depth in weathered granite. Convergent and push-pull tracer experiments were performed for characteristic distances of investigation ranging from 4 m to 41 m and for durations ranging from a few hours to more than ten days. Heterogeneous advection was found to be the dominant transport process here, thus the weathering processes do not seem to significantly impact transport properties, without any significant effect of matrix diffusion. In addition, the multipath model developed by Becker and Shapiro (2003), which has been found to be conceptually relevant for the convergent case by reducing the number of pathways, is not able to predict transport for a larger volume of investigation in push-pull configuration. This discrepancy might be explained by a non-reversible advective process, caused by cross channel mass transfer with increasing volume of investigation, which results in a transition from independent to connected pathways with scale. These observations suggests the existence of a correlation length at fracture scale and are consistent with a transition from non-Fickian to Fickian transport observed in convergent configuration when distance of investigation increases. Thus, our results confirm the importance
ACCEPTED MANUSCRIPT
of conducting tracer experiments in different flow configurations and scales of investigation to reduce uncertainty in conceptual model and transport parameters.
Acknowledgments
This study has been carried out at the Indo-French Centre for Groundwater Research (BRGM-NGRI). This work has mainly benefited from CARNOT Institute BRGM funding. The Choutuppal Experimental Hydrogeological Park has also benefited from INSU support within the H+ observatory. Site description and data may be available from the web site of the H+ observatory (http://hplus.ore.fr/en/). The authors are very grateful to Mathieu Viossanges, David Villesseche, Irshad Hussain, Yata Muthyalu and Yata Ramesh for their help during field work. The authors thank also the anonymous reviewers for their thoughtful comments and Charles Werth for his editorial work.
References
Abelin, H., Birgersson, L., Widen, H., Agren, T., Moreno, L., Neretnieks, I., 1994. Channeling experiments in crystalline fractured rocks. Journal of Contaminant Hydrology 15, 129–158.
ACCEPTED MANUSCRIPT
Babey, T., de Dreuzy, J.-R., Casenave, C., 2015. Multi-Rate Mass Transfer (MRMT) models for general diffusive porosity structures. Advances in Water Resources 76, 146–156.
Becker, M., 2003. Effect of tracer buoyancy on tracer experiments conducted in fractured crystalline bedrock. Geophysical Research Letters 30(3), 1116.
Becker, M., Charbeneau, R., 2000. First-passage-time transfer functions for groundwater tracer tests conducted in radially convergent flow. Journal of Contaminant Hydrology 40, 299– 310.
Becker, M., Shapiro, A., 2000. Tracer transport in fractured crystalline rock: Evidence of nondiffusive breakthrough tailing. Water Resources Research 36, 1677–1686.
Becker, M., Shapiro, A., 2003. Interpreting tracer breakthrough tailing from different forced-gradient tracer experiment configurations in fractured bedrock. Water Resources Research 39(1), 1024.
Becker, M. W., Tsoflias, G. P., 2010. Comparing flux-averaged and resident concentration in a fractured bedrock using GPR. Water Resources Research 46, W09518.
Berkowitz, B., 2002. Characterizing flow and transport in fractured geological media: A review. Advances in Water Resources 25, 861–884.
Bodin, J., Delay, F., de Marsily, G., 2003. Solute transport in a single fracture with negligible matrix permeability: 1. fundamental mechanisms. Hydrogeology Journal 11, 418–433.
Boisson, A., de Anna, P., Bour, O., Borgne, T. L., Labasque, T., Aquilina, L., 2013. Reaction chain modeling of denitrification reactions during a push-pull test. Journal of Contaminant Hydrology 148, 1–11.
Boisson, A., Guihéneuf, N., Perrin, J., Bour, O., Dewandel, B., Dausse, A., Viossanges, M., Ahmed, S., Maréchal, J., 2015. Determining the vertical evolution of hydrodynamic
ACCEPTED MANUSCRIPT
parameters in weathered and fractured south Indian crystalline-rock aquifers: insights from a study on an instrumented site. Hydrogeology Journal Springer Berlin Heidelberg, 1–17. Bouquain, J., Meheust, Y., Davy, P., 2011. Horizontal pre-asymptotic solute transport in a plane
fracture with significant density contrasts. Journal of Contaminant Hydrology 120–121, 184–197.
Bourke, P. J., 1987. Channeling of flow through fractures in rock. In GEOVAL-87 International Symposium Swed. Nucl. Power Insp. (SKI), Stockholm.
Bray, A. W., Benning, L. G., Bonneville, S., Oelkers, E. H., 2014. Biotite surface chemistry as a function of aqueous fluid composition. Geochimica et Cosmochimica Acta 128, 58–70. Callahan, T., Reimus, P., Bowman, R., Haga, M., 2000. Using multiple experimental methods to
determine fracture/matrix interactions and dispersion of nonreactive solutes in saturated volcanic tuff. Water Resources Research 36, 3547–3558.
Carrera, J., 1993. An overview of uncertainties in modeling groundwater solute transport. Journal of Contaminant Hydrology 13, 23–48.
Cvetkovic, V., Cheng, H., 2011. Evaluation of single-well injection-withdrawal tests in Swedish crystalline rock using the Lagrangian travel time approach. Water Resources Research 47, W02527.
de Dreuzy, J.-R., Méheust, Y., Pichot, G., 2012. Influence of fracture scale heterogeneity on the flow properties of three-dimensional discrete fracture networks (DFN). Journal of Geophysical Research 117, B11207.
Di Donato, G., Obi, E., Blunt, M., 2003. Anomalous transport in heterogeneous media demonstrated by streamline-based simulation. Geophysical Research Letters 30(12), 1608.
ACCEPTED MANUSCRIPT
Flury, M., Gimmi, T., 2002. Solute diffusion, in Methods of soil analysis, Part 4, Physical methods, edited by J. H. Dane, and G. C. Topp. Soil Science Society of America, Madison, Wi, pp. 1323–1351.
Garnier, J., Crampon, N., Preaux, C., Porel, G., Vreulx, M., 1985. Tracing C-13, H-2, I- and Uranine through the Senonian chalk aquifer (Bethune, France) using a two-well method. Journal of Hydrology 78, 379–392.
Gelhar, L. W., Welty, C. W., Rehfeldt, K. R., 1992. A critical review of data on field-scale dispersion in aquifers. Water Resources Research 28 (7), 1955–1974.
Gerke, K. M., Sidle, R. C., Mallants, D., 2013. Criteria for selecting fluorescent dye tracers for soil hydrological applications using Uranine as an example. Journal of Hydrology and Hydromechanics 61, 313–325.
Gouze, P., Le Borgne, T., Leprovost, R., Lods, G., Poidras, T., Pezard, P., 2008. Non-Fickian dispersion in porous media: 1. Multiscale measurements using single-well injection withdrawal tracer tests. Water Resources Research 44, W06426.
Guihéneuf, N., Boisson, A., Bour, O., Dewandel, B., Perrin, J., Dausse, A., Viossanges, M., Chandra, S., Ahmed, S., Maréchal, J., 2014. Groundwater flows in weathered crystalline rocks: Impact of piezometric variations and depth-dependent fracture connectivity. Journal of Hydrology 511, 320–334.
Hadermann, J., Heer, W., 1996. The Grimsel (Switzerland) migration experiment: Integrating field experiments, laboratory investigations and modelling. Journal of Contaminant Hydrology 21, 87–100.
ACCEPTED MANUSCRIPT
Haggerty, R., Fleming, S. W., Meigs, L. C., McKenna, S. A., 2001. Tracer tests in a fractured dolomite: 2. Analysis of mass transfer in single-well injection-withdrawal tests. Water Resources Research 37 (5), 1129–1142.
Haggerty, R., McKenna, S., Meigs, L., 2000. On the late-time behavior of tracer test breakthrough curves. Water Resources Research 36, 3467–3479.
Hakami, E., Larsson, E., 1996. Aperture measurements and flow experiments on a single natural fracture. International Journal of Rock Mechanics and Mining Sciences & Geomechanics Abstracts 33, 395–404.
Hansen, S. K., Berkowitz, B., Vesselinov, V. V., O’Malley, D., Karra, S., 2016. Push-pull tracer tests: Their information content and use for characterizing non-Fickian, mobile-immobile behavior. Water Resources Research 52 (12), 9565–9585.
Istok, J., 2013. Push-Pull Tests for Site Characterization. Lecture Notes in Earth System Sciences 144, Springer-Verlag Berlin Heidelberg.
Jardine, P., Sanford, W., Gwo, J., Reedy, O., Hicks, D., Riggs, J., Bailey, W., 1999. Quantifying diffusive mass transfer in fractured shale bedrock. Water Resources Research 35, 2015– 2030.
Kang, P. K., Le Borgne, T., Dentz, M., Bour, O., Juanes, R., 2015. Impact of velocity correlation and distribution on transport in fractured media: Field evidence and theoretical model. Water Resources Research 51 (2), 940–959.
Kasnavia, T., Vu, D., Sabatini, D., 1999. Fluorescent dye and media properties affecting sorption and tracer selection. Ground Water 37, 376–381.
Kessler, J. H., Hunt, J. R., 1994. Dissolved and colloidal contaminant transport in a partially clogged fracture. Water Resources Research 30 (4), 1195–1206.