HAL Id: insu-03209838
https://hal-insu.archives-ouvertes.fr/insu-03209838
Submitted on 27 Apr 2021
HAL is a multi-disciplinary open access
archive for the deposit and dissemination of
sci-entific research documents, whether they are
pub-lished or not. The documents may come from
teaching and research institutions in France or
abroad, or from public or private research centers.
L’archive ouverte pluridisciplinaire HAL, est
destinée au dépôt et à la diffusion de documents
scientifiques de niveau recherche, publiés ou non,
émanant des établissements d’enseignement et de
recherche français ou étrangers, des laboratoires
publics ou privés.
Direction finding of ELF hiss emissions in a detached
plasma region of the magnetosphere
M. Hayakawa, N. Ohmi, Michel Parrot, François Lefeuvre
To cite this version:
M. Hayakawa, N. Ohmi, Michel Parrot, François Lefeuvre. Direction finding of ELF hiss emissions in a
detached plasma region of the magnetosphere. Journal of Geophysical Research, American Geophysical
Union, 1986, 91 (A1), pp.135. �10.1029/JA091iA01p00135�. �insu-03209838�
JOURNAL OF GEOPHYSICAL RESEARCH, VOL. 91, NO. A1, PAGES 135-141, JANUARY 1, 1986
Direction Finding of ELF Hiss Emissions in a Detached Plasma Region
of the Magnetosphere
M. HAYAKAWA 1 AND N. OHMI
Research Institute of Atmospherics, Na•Ioya University, Toyokawa, Japan
M. PARROT AND F. LEFEUVRE
Laboratorie de Physique et Chimie de l'Environnement, Orleans, France
Wave normal directions and wave distribution functions of ELF hiss emissions in a detached plasma region of the magnetosphere have been determined, using data from the geostationary satellite GEOS 2 located in the equatorial plane at L = 6.6. Three different methods of direction finding have been utilized: (1) Means's method based on the hypothesis of a single plane wave, (2) the maximum likelihood method, assuming a few plane waves, and (3) the maximum entropy method of determining the wave
distribution function. An intercomparison of the results from those methods has proven that they
provide very reliable and definite information on the wave normals. From analyses of two equatorial ELF hiss events it is found that the wave distribution function is composed of a single peak (i.e., the waves have a single propagation direction) and that the wave normals of the ELF hiss originating in the detached plasma region make very small angles with the Earth's magnetic field; also, we were able to make an experimental estimate of the angular width of the unstable cone of the emissions. Both our initial direction finding results in the equatorial plane and the corresponding previous results at higher geomagnetic latitudes are compared with theoretical predictions, assuming that the waves are generated by the electron cyclotron instability due to medium-energy (3-30 keV) electrons. It is concluded that all of the characteristics (morphology and direction-finding results) are consistent with the electron cyclo- tron instability.
1. INTRODUCTION
ELF hiss is known to be most commonly observed within the plasmasphere; this is the so-called "plasmaspheric ELF hiss" [Russell et al., 1969; Thorne et al., 1973; Hayakawa and Tanaka, 1977]. However, there is another distinct zone for ELF emissions, namely, the detached plasma regions of the magnetosphere. Detached plasma regions are defined as re- gions outside the plasmapause where the cold plasma density is considerably enhanced compared with the ambient density [Chappell, 1972]. They are believed to originate in the plasma- sphere and to be torn off either by the convection electric field [Chappell, 1974; Barfield et al., 1975] or as a consequence of the interchange instability [Lernaire, 1975]. Several investi- gators [Chan, 1974; Chan et al., 1974; Chan and Holzer, 1976; Kivelson, 1976; Cornilleau-Wehrlin et al., 1978] have reported that ELF hiss emissions occur in such detached plasma re-
gions,
and we refer
hereinafter
to these
emissions
as "DP hiss."
Based on OGO 5 measurements, Chan [1974], Chan et al. [1974], and Chan and Holzer [1976] have made detailed in- vestigations of the high correlation between ELF hiss ampli- tude and plasma density enhancement. They have determined the wave normal directions of many DP hiss events observed at high geomagnetic latitudes (20ø-50 ø ) and have shown that the wave normals make angles less than 40 ø with the earth's magnetic field. Chan [1974] and Kivelson [1976] have tried to test the theoretical model of wave generation of DP hiss by the electron cyclotron instability, using observations such as direction finding results in the off-equatorial region and simul- taneous measurements of energetic electron flux.
• Also at Laboratoire de Physique et Chimie de l'Environnement, Orleans, France.
Copyright 1986 by the American Geophysical Union.
Paper number 5A8742. 0148-0227/86/005A-8742505.00
135
The information concerning the distribution of wave nor- mals in the off-equatorial region as studied by Chan [1974] and Chan and Holzer [1976] is, of course, important. How- ever, they were unable to distinguish between the effects of generation and propagation, since they used only off- equatorial results. Hence, information on the wave normals of DP hiss exactly at the magnetic equator is considered to be essential for clarifying the distinction between the generation and propagation effects and also for acquiring evidence on the mechanism of DP hiss because the equatorial plane is thought to be the most likely source region where the wave growth is expected to be largest [Helliwell, 1967; Russell et al., 1969;
Tsurutani and Smith, i977].
The purpose of the present paper is to report the first direc- tion finding studies for a few DP hiss events observed exactly at the magnetic equator, based on data from the geostation,ary
satellite GEOS 2 located at L = 6.6. Furthermore, three differ-
ent methods of analysis are applied to the observed events in order to obtain very reliable information on the wave normal directions and wave distribution functions, whereas Chan [1974] and Chan and Holzer [1976] used Means's [1972] method, based on the simple hypothesis of a single plane wave, which was the only possibility at that time. Then the present direction finding results at the equator are compared with those obtained in the off-equatorial region by Chan [1974] and Chan and Holzer [1976], thus allowing us to dis- tinguish between the generation and propagation effects.
The plan of the paper is as follows. In section 2 we give a brief description of the three direction-finding techniques used in the paper, while section 3 is concerned with the character-
istics
of the DP hiss
events
studied.
The corresponding
results
on their wave normals are presented in section 4. Finally, we study the generation and propagation mechanisms of the DP hiss in the light of the present direction-finding results at the equator, together with the corresponding direction-finding data acquired off the equator and in the ionosphere.
136 HAYAKAWA ET AL.: WAVE NORMALS OF DP VLF HISS
2. DIRECTION-FINDING TECHNIQUES
For the detailed study of electromagnetic waves below the electron gyrofrequency fn, several sensor combinations and different modes of on-board data processing have been used on the geostationary satellite GEOS 2, which is located in the geographic equatorial plane at L- 6.6 [Jones, 1978; S-300 Experimenters, 1979]. Here the data that we are treating were collected in the so-called S-300 "survey mode," and we only
use those
from three magnetic
sensors.
The sign•als
are pro-
cessed by the step frequency analyzer (SFA), which may be connected to any sensor combination, have a bandwidth of 300 Hz, and sweep in frequency over the range 0-77 kHz. Before being telemetered to ground, the signals are transposed in frequency, passed through identical low-pass filters cutting off at 450 Hz, and sampled at 1.488 kHz [S-300 Experi- menters, 1979].The wave normal directions are estimated from the SEA data. First, the signals associated with the magnetic compo- nents are Fourier-transformed. Then at each frequency that we are concerned with we can estimate a 3 x 3 spectral matrix consisting of the mean autopower spectrum of each of the three components taken separately, together with the mean cross-power spectrum of each pair of components [-Lefeuvre et al., 1981, 1982]. Three different methods of analysis have been used: (1) Means's [1972] method, (2) the maximum likelihood method of determining the propagation directions of a few plane waves [Buchalet and Lefeuvre, 1981; Hayakawa et al., 1984], and (3) the maximum entropy method of determining the wave distribution function (WDF) [Lefeuvre et al., 1981, 1982]. In the studies by Chan [1974] and Chan and Holzer [-1976], they used only Mean's method assuming a single plane wave. The eigenvalues of the observed spectral matrix contain information on the type of wave field or on the propa- gation model. If there is just a single nonzero eigenvalue, the electromagnetic field is that of a single plane wave. If there are two nonzero eigenvalues, the field consists of two plane waves propagated with two different wave normal vectors. Finally, if the three eigenvalues are of the same order, the field is the sum of three or more plane waves. In the first case, Means's method and the maximum likelihood method assuming one direction of propagation must obviously be chosen. In the third case, one cannot avoid using an approach of the WDF type. In between, i.e., in the second case, one could apply either the maximum likelihood method assuming two direc- tions, or the WDF technique. The simultaneous use of the different methods will yield trustworthy direction-finding re-
sults.
In what follows, we adopt a Cartesian coordinate system
O•,y:
where
the z axis
is parallel
to the earth's
magnetic
field
B0, the axis O,, is in the magnetic meridian plane and is direc-
ted away from the earth, while Oy completes
the orthogonal
set and is directed
eastward.
The wave
normal
direction
(•) is
characterized
by the polar angle
0 between
fc and/•0 and by
the azimuthal angle •b, the origin of which is O,, [Lefeuvre et al., 1982; Hayakawa et al., 1984]. We should also mention that the estimated propagation direction is ambiguous because we use only the magnetic field components for the direction find- ing.3. CHARACTERISTICS OF THE DP Hiss
The specific day of December 19, 1979, was chosen by Haya- kawa et al. [-1984] for the detailed analyses of magnetospheric chorus emissions. The chorus emissions on this day are found to be associated with successive substorms and to take place
in the morning and premidnight hours (i.e., LT = 0100-1400, and 2200-2400). During the LT sector between two intervals, i.e., LT = 1500-2300 there were no emissions, except at UT = 1800-1900 (or LT = 2000-2100) when ELF hiss emis- sions were detected. The electron density is measured by the mutual impedance experiment [Decrenu et al., 1978], and the temporal variation of the measured plasma frequency on that day is presented in Figure 1. As compared with Figure 1, ELF hiss emissions are observed, in association with the enhanced cold plasma density; this has already been discussed in detail by Chan et al. [1974], Kivelson [1976], and Cornilleau- Wehrlin et al. [1978]. The density enhancement at UT = 18-
19 hours is obviously
a detached
plasma region because
•'
it
appears at LT • 20 hours and in the recovery phase of geo- magnetic disturbances, which agrees well with the morphology
of detached
plasma regions established
by Chappell
[-1972,
1974]; furthermore, it is correlated with ELF hiss. The corre- lation of the fluctuations in the wave field with those in the density as studied by ½han [1974] is not discussed in the present paper.
Figure 2 is a typical spectrogram of ELF emissions ob- served inside the detached plasma region; it indicaies that they are of the hiss type. The SFA data at the times 1800:46.013 UT and 1801:08.030 UT have been selected for the subsequent direction-finding studies, and the power spec- tra of the DP hiss at those two times are shown in Figures 3a and 4a, respectively. The wave intensity in Figure 3a is peaked at -• 160 Hz and thereafter decreases sharply with increasing
frequency.
The peak power spectral density is -•10 -5
72/Hz(• 3m7/[Hz-1•/2),
and the half-power
bandwidth
is about
150 Hz. Similar characteristics are also recognizable in Figure 4a, except for the smaller peak power spectral density of •4
x 10 -6 •/2/Hz and the shift of the peak to a lower frequency.
These spectral characteristics of the DP hiss in our case seem to be very typical of DP hiss as studied in detail by Chan [-1974]. The center frequency of the DP hiss is significantly lower than that of the plasmaspheric ELF hiss discussed by Thorne et al. [1973]
4. WAVE
NORMAL
DIREC•ONS
.A•ND
WAVE DISTRIBUTION FUNCTIONS
In the work of Chan
[1974] and of Chan
and •Iolzer [1967]
these authors selected the events with sufficient si•gnal-to-noise ratio and sufficiently high coherence to valiqlate the fundamen- tal supposition of a single plane wave in Means's method. Forcomparison,
the frequency
dependence
of •the
c6herence
is also
shown
in Figures
3b
and
4b.
For
th
e first
even.
t, in Figure
3b,
the coherence
is greater
than 0.8 over a.•
r'•lat.
ively wide fre-
quency
range
from -• 100 to • 330 Hz, while
the second
event
(Figure 4b) we observe coherence larger than 0.8 in a narrow band from -,, 100 to -• 250 Hz. In the frequency range where coherence exceeds 0.8 the power spectral density of the DPhiss is greater than 5 x 10 -7 72/Hz, and we have performed
the direction finding at those frequencies so as to have definiteanswers.
Before carrying out the direction finding based on the maxi- mum likelihood method, we have to determine the propaga- tion model (one- or two-direction model) by means of the eigenvalues 2•, 2•_, and 23 (ranked in decreasing magnitude) of the spectral matrix observed at each frequency. The criterion for distinguishing between the one- and two-direction models is somewhat arbitrary: We use, on some occasions, a combi- nation of the two ratios, • = •2/•x and/1 = •3/•2, the thresh- olds for which are chosen according to the degree of confi- dence required [Buchalet and Lefeuvre, 1981; Hayakawa et al.,
HAYAKAWA ET AL..' WAVE NORMALS OF DP VLF HISS 137 lO 5 o 2 '4 I •. I I I I t I I I t I I ! I I I 8 10 12 14 16 18 20 22 24 UT(hr) Cq C• U• r • 0% 0% o0 r• • u• • 00 00 0. 00 00 .. 0. 00 00 .. .. o o o o o r• r• r• • r• c• LT (hr)
Fig. 1. Temporal variation of the electron plasma frequency fv, indicating the equatorial electron density at L = 6.6, on December 19, 1979. The value off v at the beginning of each UT hour is plotted. ELF hiss is recorded at UT = 1800-
1900 when the satellite is located in a detached plasma region.
1984],
while
in other
cases,
the degr'ee
of polarization
p =
2•/(2• + 22 + 23) is used [Lefeuvre et al., 1982; Hayakawa et al., 1985].
First, we will determine the wave normal directions for the
first event, illustrated in Figure 3a. Analyses of the observed eigenvalues have yielded that the ratio • = 22/2• is smaller than 0.1 at all frequencies in the range where the power spec-
tral density
exceeds
5 x 10⁻⁷ y2/Hz, and hence,
following
the
criterion adopted by Hayakawa et al. [1984], the wave fields at those frequencies are doubtless compos. ed of a single plane
&ave. Hence Means's
[1972] method
is applicable,
and also
the maximum likelihood estimation procedure assuming a
one-direction model can be used; the results obtained by both methods are summarized in Table 1. Even though the lowest frequency of 186 Hz is well above the lower hybrid resonance frequency (45 Hz), the effects of the protons are included in the kernels (see Storey and Lefeuvre [1980] for detail of the ker- nels) for the maximum likelihood estimation. It may be seen from the table that the two methods have yielded wave normal directions in good agreement with each other, which
are hence consideied
to be very trustworthy.
Moreover, the
wave normals make small angles, less than 26 ø, with the mag- netic field over the frequency range up to A • 0.2 (A is the frequency normalized with respect to the electron gy-
ß GEOS-S300 S,,urvey Mode
ß19/Dec/1979 18h 0m 7 sec UT Positioq Geographic Geomagnetic Lat -0.1 ø -0.9 ø Long 24.0 ø 93.7 ø DIST 6.60 R e L=6.60 f =57.60 kHz pe f = 2.03 kHz He MLT= 19.54h 2.5 1.5 . 5 10 15
Fig. 2. Frequency spectrum of ELF emissions in the detached plasma region, as measured by a magnetic sensor.
138 HAYAKAWA ET AL.' WAVE NORMALS OF DP VLF HISS -5 10 • 10 -6
• 10
-7
0 8 m 10- 10 100 200 300 ! I 400 500(a)
-5 10 1.0 0 I I 100 200 300 400 500 600 700 8001016
10 '7 10-8 I • I - -9 10 600 700 800(b)
FREQUENCY ( Hz )Fig. 3. (a) Frequency dependence of the power spectral density of the DP hiss at 1800:46 UT. At the frequencies indicated by small circles, we have done the direction finding. The power spectral density
of 5 x 10⁻⁷ •2/H z is indicated by a horizontal dotted line as a refer-
ence level. (b) Corresponding frequency dependence of the coherence.
rofrequency), and there seems to exist an additional tendency for the angle 0 to increase with increasing frequency, from
• 8 ø at A = 0.09 to • 26 ø at A • 0.20.
Next we discuss the wave normals for the second DP hiss event, illustrated in Figure 4a. At the lower frequencies of 186 and 233 Hz, the • value is estimated to be less than 0.1, so it is
certain,
according
to the criterion
of Hayakawa
et al. [1984],
that the wave fields at those frequencies are composed of a single plane wave. Table 2 summarizes the wave normal direc- tions estimated by the two methods, namely Means's method and the maximum likelihood method assuming a single plane wave, as for the previous event. Again we see that the two wave normal directions at each frequency are in excellent agreement with each other and that the 0 angles have quite small values such as 11ø-12 ø . The corresponding wave distri- bution function at 233 Hz, estimated by the WDF techniqueI I I I I I I • 0 100 200 300 400 500 600 700 800 1.0 • o 5 (D ß o
(b)
100 200 300 •00 500 600 700 800 FREQUENCY ( Hz )Fig. 4. Same asin Figure 3 butat 1B01:08 UT.
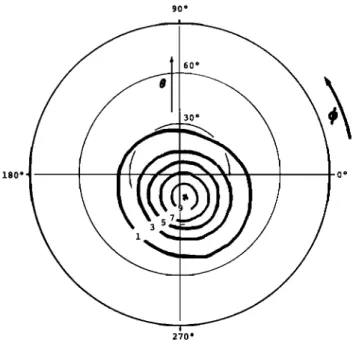
[Lefeuvre et al., 1981], is depicted in Figure 5 and is to be compared with the corresponding results at 279 Hz shown in Figure 6. However, the eigenvalues of the spectral matrix at the higher frequency of 279 Hz reveal that the 0• value is 0.131, not quite satisfying the criterion for a one-direction model formulated by Hayakawa et al. [1984], so we are obliged to rely primarily on the WDF method. The WDF is illustrated in Figure 6, and it does indeed consist of a single narrow peak. Thus, since the resemblance to a single plane wave is con-
TABLE 1. Wave Normal Directions for the DP Hiss in Figure 3a
Maximum Likelihood
Means's Method Method
Frequency, Normalized Hz Frequency 186 0.096 7.7 ø 31.1 ø 9.3 ø 36.0 ø 233 0.120 10.8 ø 17.6 ø 12.5 ø 20.9 ø 279 0.143 17.7 ø 155.6 ø 18.8 ø 161.2 ø 326 0.168 19.5 ø 148.9 ø 20.2 ø 153.2 ø 372 0.190 26.7 ø 143.3 ø 26.3 ø 146.0 ø
HAYAKAWA ET AL.' WAVE NORMALS OF DP VLF HISS 139
TABLE 2. Wave Normal Directions for the DP Hiss in Figure 4a
Maximum Likelihood Maximum Entropy
Means's Method Method Method
Frequency, Normalized
Hz Frequency
186 0.096 10.7 ø 301.9 ø 10.9 ø 292.4 ...
233 0.120 11.8 ø 271.2 ø 11.9 ø 271.7 ø 13.8 ø 261.6 ø 279 0.143 17.1 ø 73.5 ø 14.7 ø 82.6 ø 21.0 ø 83.5 ø
firmed by the WDF method, it is interesting to compare the WDF result with those obtained by the previous two methods, and Table 2 does this. Means's method and the maximum likelihood method have yielded very similar answers at the two lowest frequencies, but they have yielded wave normals slightly different from each other at 279 Hz. The direction of the peak of the WDF is indicated in the table, and again the results from the WDF method are consistent with those ob- tained by other methods. The WDF's in Figure 5 and 6 are found to be very circular, but the angular width of the distri- bution increases with increasing frequency.
5. SUMMARY OF THE EXPERIMENTAL RESULTS AND
DISCUSSION OF TIlE GENERATION MECHANISM
Based on the present analyses of the DP hiss events ob- served at the equator (the geomagnetic latitudes for the two analyzed events are -0.1 ø) on the GEOS 2 satellite, we can summarize with the following experimental facts for the DP hiss:
1. The detached plasma region detected in the equatorial region at L = 6.6 by GEOS 2 is found to have occurred during the recovery phase of a substorm and in the LT sector of • 2000, and it is highly correlated with ELF emissions.
2. The frequency of maximum intensity for the DP hiss ranges between 100 and 200 Hz, which is considerably lower than the corresponding frequency for plasmaspheric ELF hiss. 3. The simultaneous use of three different methods has proved to be a way of obtaining reliable information on the wave normal directions and wave distribution functions.
90 ø
4. The direction-finding results have shown that the wave distributions consist of a single peak (or that the waves have a single propagation direction) and that the wave normal direc- tions make small angles (less than 25 ø ) with the Earth's mag- netic field.
5. The wave distribution functions may provide infor- mation about the angular width of the unstable cone. The WDF is approximately circular, and the "half-width of the unstable cone" (defined as the range in 0 angle from the peak to the edge labeled 1 in the WDF's) increases with increasing frequency, for instance from •35 ø at A = 0.12 to •50 ø at A • 0.15.
The morphological properties, items 1 and 2, confirm the results of previous detailed studies by Chan [1974], Chan and Holzer [1976], and Cornilleau-Wehrlin et al. [1978].
The information obtained on the wave normal directions of the DP hiss is of great importance in studying its generation mechanism because the observations were made exactly in the equatorial plane, which is considered to be the most likely source region for the emissions [Helliwell, 1967; Russell et al., 1969; Tsurutani and Smith, 1977]. The hypothesis of local generation at the equator seems to be supported by the experi- mental fact (item 5) that the WDF's are almost circular, even though the peak is shifted slightly away from the origin. If the relevant waves had propagated over some distance from the source in the nonducted mode, the 4• distribution would be concentrated into the magnetic meridian plane [Thorne, 1969; F. Lefeuvre and L. Cairo, private communication, 1985]. Fur- thermore, even if we assume ducted propagation from the source and if the detached plasma region were rather elongat- ed in longitude (i.e., if it had a sheetlike structure) [Taylor et
90 ø 60 ø
30
ø
•
1.80 ø o :1.80 •, o oFig. 5. Wave distribution function as a contour map, for DP hiss
at 233 Hz, with its peak
indicated
by a cross.
(The
stability
parameter
270 ø•
Q is 0.54, and the prediction parameter Pr is 1.68' see Lefeuvre et al.
[1981, 1982] for the definitions of Pr and Q.) The half-width of the Fig. 6. Wave distribution function at 279 Hz (Q = 0.69 and P•-
140 HAYAKAWA ET AL..' WAVE NORMALS OF DP VLF HISS
al., 1970, 1971], we would again expect a tendency for the azimuthal direction to be in the meridian plane. These expec- tations seem to be in contradiction with the nearly circular shapes of the WDF's. Now, the •b values of the energy peak at •b • 90 ø (Figure 6) and •b • 280 ø (Figure 5) can be explained by the relative position of the satellite with respect to the source. The small shift in 0 from the origin (14 ø in Figure 5 and 21 ø in Figure 6) might have resulted from the effects of propagation over a short distance, and it is reasonable to consider that circular shapes of the WDF's reflect the proper- ties of the source, that is, they are consistent with isotropic emission generation at the source in the sense that the emis- sion is independent of the azimuthal angle around the mag- netic field and depends only on the polar angle.
The direction-finding results given in the present paper (item 4 indicate that wave normals make small angles (less than 25 ø) with the magnetic field. In the study of Chan [1974], if we select the two events observed near the equator (1.4 ø and 6.0 ø geomagnetic latitude), the wave normals are again found to make small angles (less than 20 ø ) which obviously are sig- nificantly smaller than those observed at high geomagnetic latitudes. Hence we can conclude that the wave growth at the equator is strongest for the quasi-longitudinal propagation di- rection (0 • 0ø). Burton and Holzer [1974], Hayakawa et al., [1984], and Goldstein and Tsurutani [1984] have reported, similarly, very small 0 (less than 20 ø) for chorus in the vicinity of the equator, in the same range of normalized frequency. The present finding of maximum growth rate for quasi- longitudinal propagation is in good agreement with the theo- retical prediction by Kennel [1966]. He assumed an E -n energy spectrum for the electrons and found that the wave growth is most rapid at 0 = 0 ø at the lowest frequencies (A •< 0.3) and furthermore that a 20 ø (50 ø) half-width for the unsta-
ble cone corresponds
approximately
to an E -3 (E -2) spec-
trum for the hot electron distribution function, with the ad- ditional finding that the unstable cone widens with increasing frequency. In our experimental item 5, the unstable cone half-
width estimated from the WDF is • 35 ø at A = 0.12, increas-
ing with increasing frequency, again in agreement with the theory. The half-width of the experimental unstable cone can be satisfactorily interpreted in terms of the average slope of E-2 for the hot electron distribution function. However, in the calculations of Kennel [1966], he did not include the effect of cold electrons. Since the half-width of the unstable cone de- pends on the relative numbers of cyclotron and Landau reso- nant electrons, addition of cold electrons to the hot electrons makes the unstable cone narrower, and hence the detailed quantitative comparison between the present experiment and theory is a difficult subject at the moment. We have to com- ment here that there exists, of course, a lower limit to the particle flux for energetic electron distributions that can be unstable to whistler growth, as studied experimentally by Ki- velson [1976].
The small wave normal angles at the equator are consistent with both wave generation as mentioned above and ducted propagation down to the ionosphere. Chan [1974] has deter- mined the wave normal directions for DP hiss at high geo- magnetic latitudes (mainly 30ø-50 ø) and has found that the 0 show a considerable scatter over an angular range from 2 ø to 40 ø and that there is not latitudinal dependence. Hence, it is likely that the wave normals at higher latitudes are larger than those at the equator, which may lead us to consider the possi- bility of scattering of the wave normals in the course of ducted propagation away from the source region [Helliwell, 1965]. The enhancement factor of the detached plasma region in the
present paper is extremely high (more than 10 times higher than the ambient density) compared with the values for normal whistler ducts as given by Angerami [1970], so we can expect wave trapping at large 0 angles, which agrees with
Chan's observations.
These DP hiss emissions may reasonably be thought to remain trapped by the density enhancement of the detached plasma region right down to the ionosphere. Data from iono- spheric satellites enabled Tulunay and Hughes [1973], Taylor et al. [1970, 1971], and Maynard and Chen [1975] to identify the detached plasma density enhancement in the ionospheric trough region. Probably in association with these detached plasma regions, Chan [1974] detected DP hiss on OGO 5, but simultaneous ion density data were not available to him. Based on the simultaneous high-resolution density measure- ment and the direction finding for ELF hiss made on the AUREOL 3 satellite, Beghin et al. [1985] have recently found a close association between enhancements in local electron density and the appearance of impulsive ELF emissions, ex- actly as was found on OGO 5 by Chan [1974]; furthermore, those ELF waves are shown to be trapped within the field- aligned plasma density enhancements, by means of the direc- tion finding results.
For more quantitative studies, the quasi-linear theory has been proposed, extending the theory of the linear electron cyclotron instability. Following Kennel [1966-], papers by Roux and Solomon [1971], by Etcheto et al. [1973] and by $azhin [1984] presented self-consistent calculations, leading to estimates of the frequency and power spectral density at the peak in the whistler spectrum. A dynamic equilibrium is es- tablished in which the waves are being continuously generated and particles are continuously injected and are lost by pitch- angle diffusion into the loss cone. The stationarity of the pro- cess of wave generation is achieved by the balance of total wave amplification along the field line and wave loss accom- panying the partial reflection of the waves from the iono- sphere. In these theories, quasi-longitudinal (0 • 0 ø) or ducted propagation is assumed, which is experimentally validated by our direction-finding results at the equator and also by the observations of Beghin et al. [1985] at ionospheric heights. The frequency fmax at which the wave energy is maximal is
given by [Sazhin, 1984].
c2flt
3
fmax=w21.2f•,
2
(1)
where c is the velocity of light and w is the characteristic velocity of the incoming electrons at the L shell of the wave generation. The corresponding maximum power spectral den-
sity (Bf2)max
at fmax
can be approximated
by [Sazhin,
1984]
(Bf2)max
oC
neqLS'sW
o
•'5Lo4'5
dni
(2)
where neq
is the equatorial
electron
density on the L shell
where
the waves
are generated,
Wo is the electron
energy
at
L- Lo, Lo can be chosen
arbitrarily,
and dni/dt is the rate of
influx
of the electrons.
The observed
peak
frequency
is used
in
(1) to estimate
the value of the characteristic
energy
of the
incoming
electrons,
corresponding
to w, as 3-20 keV, taking
into
account
the
measured
f, and
the
measured
range
off•,
of
the detached
plasma
region
as seen
from Figure 1. Equation
(2) implies
that the peak power •Bf2)max
is directly
pro-
portional
to neqL
5'5 for a given
incoming
particle
distribution
and influx rate dni/dt. In our case, L is fixed at 6.6, so
HAYAKAWA ET AL.: WAVE NORMALS OF DP VLF HISS 141
neq within the detached plasma region is about 10 times larger than that in the ambient plasma, resulting in the observed
enhancement of DP hiss.
Finally, we can conclude that all of the observed character- istics and the direction-finding results can be interpreted satis- factorily in terms of the electron cyclotron instability.
Acknowledgments. The authors would like to express their sincere thanks to P. Robert of CRPE (Issy-les-Moulineaux) for supplying the Earth's magnetic field data and to J. Etcheto and B. Higel of CRPE (Issy-les-Moulineaux) and P. Decreau of LPCE (Orleans) for supply- ing the data-of-plasma frequency measurements from the S-301 and S-304 experiments, respectively. Thanks are also due to CNES (Tou- louse) for making the survey mode microriches, some of which have been reproduced in the present paper. Useful discussion with J. Ohtsu and Y. Tanaka of Nagoya University and C. Beghin of LPCE (Or- leans) are appreciated. The present work is partly supported by the International Joint Project of Japan Society of Promotion of Science and also partly by Takeda Science Foundation, to which we are grateful. Finally, the authors are indebted to the referee for his careful reading of the paper and useful comments.
The Editor thanks L. R. O. Storey for his assistance in evaluating
this paper.
REFERENCES
Angerami, J. J., Whistler duct properties deduced from VLF observa- tions made with the OGO 3 satellite near the magnetic equator, J. Geophys. Res., 75, 6115, 1970.
Barfield, J. N., J. L. Burch, and D. J. Williams, Substorm-associated
reconfigurations of the duskside equatorial magnetosphere, A source mechanism for detached plasma regions, J. Geophys. Res.,
80, 47, 1975.
Beghin, C., J. L. Rauch, F. Lefeuvre, R. Debrie, J. C. Cerisier, J. J. Berthelier, O. A. Maltseva, and N. I. Massevitch, Experimental evidence of field-aligned ELF plasma ducts in ionospheric trough
and in the auroral zone, in R•sultats du PRO JET ARCAD 3 et des
Programmes Rgcents en Physique de la Magngtosphdre et de l'Ionosphdre, p. 517, Cepadues Editions, Toulouse, France, 1985.
Buchalet, L. J., and F. Lefeuvre, One and two direction models for VLF electromagnetic waves observed on board GEOS 1, J. Geo-
phys. Res., 86, 2377, 1981.
Burton, R. K., and R. E. Holzer, The origin and propagation of chorus in the outer magnetosphere, J. Geophys. Res., 79, 1014, 1974. Chan, K. W., Extremely low frequency hiss emissions in the mag-
netosphere, Ph.D. thesis, Univ. of Calif., Los Angeles, 1974. Chan, K. W., and R. E. Holzer, ELF hiss associated with plasma
density enhancements in outer magnetosphere, J. Geophys. Res., 81, 2267, 1976.
Chan, K. W., R. E. Holzer, and E. J. Smith, A relation between ELF hiss amplitude and plasma density in the outer plasmasphere, J. Geophys. Res., 79, 1989, 1974.
Chappell, C. R., Recent satellite measurements of the morphology and dynamics of the plasmasphere, Rev. Geophys., 10, 951, 1972. Chappell, C. R., The convergence of fact and theory on mag-
netospheric convection, in Correlated Interplanetary and Mag- netospheric Observations, p. 277, D. Reidel, Hingham, 1974. Cornilleau-Wehrlin, N., R. Gendrin, F. Lefeuvre, M. Parrot, R.
Grard, D. Jones, A. Bahnsen, E. Ungstrup, and W. Gibbons, VLF electromagnetic waves observed onboard GEOS-1, Space Sci. Rev.,
22, 371, 1978.
Decreau, P.M. E., C. Beghin, and M. Parrot, Electron density and temperature, as measured by the mutual impedance experiment on board GEOS-1, Space Sci. Rev., 22, 581, 1978.
Etcheto, J., R. Gendrin, J. Solomon, and A. Roux, A self-consistent
theory of magnetospheric ELF hiss, J. Geophys. Res., 78, 8150,
1973.
Goldstein, B. E., and B. T. Tsurutani, Wave normal directions of
chorus near the equatorial source region, J. Geophys. Res., 89, 2789,
1984.
Hayakawa, M., and Y. Tanaka, ELF emissions observed at Moshiri (L ,-- 1.6), Nature Phys. Sci., 270, 703, 1977.
Hayakawa, M., Y. Yamanaka, M. Parrot, and F. Lefeuvre, The wave
normals of magnetospheric chorus emissions observed on board GEOS 2, J. Geophys. Res., 89, 2811, 1984.
Hayakawa, M., F. Lefeuvre, and J. L. Rauch, The direction finding aboard Aureol-3 of elf waves at frequency above and below the proton gyrofrequency, in Rdsultats du PRO JET ARCAD 3 et des Programmes Rgcents en Physique de la Magndtosphdre et de l'Ionosphdre, p. 499, Cepadues Editions, Toulouse, France, 1985. Helliwell, R. A., Whistlers and Related Ionospheric Phenomena, Stan-
ford Univ. Press, Stanford, Calif., 1965.
Helliwell, R. A., A theory of discrete VLF emissions from the mag- netosphere, J. Geophys. Res., 72, 4773, 1967.
Jones, D., Introduction to the S-300 wave experiments aboard GEOS, Space Sci. Rev., 22, 327, 1978.
Kennel, C. F., Low frequency whistler mode, Phys. Fluids, 9, 2190,
1966.
Kivelson, M. G., Instability phenomena in detached plasma regions,
J. Atrnos. Terr. Phys., 38, 1115, 1976.
Lefeuvre, F., M. Parrot, and C. Delannoy, Wave distributions esti- mation of VLF electromagnetic waves observed on board GEOS 1, J. Geophys. Res., 86, 2359, 1981.
Lefeuvre, F., T. Neubert, and M. Parrot, Wave normal directions and
wave distribution functions for ground-based transmitter signals
observed on GEOS 1, J. Geophys. Res., 87, 6203, 1982.
Lemaire, J., The mechanisms of formation of the plasmapause, Ann. Geophys., 31, 175, 1975.
Maynard, N. C., and A. J. Chen, Isolated cold plasma regions: Obser- vations and their relation to possible production mechanisms, J. Geophys. Res., 80, 1009, 1975.
Means, J. D., Use of the three-dimensional covariance matrix in ana-
lyzing the properties of plane waves, J. Geophys. Res., 77, 5551, 1972.
Roux, A., and J. Solomon, Self-consistent solution of the quasi-linear theory: Application to the spectral shape and intensity of VLF waves in the magnetosphere, J. Atrnos. Terr. Phys., 33, 1457, 1971.
Russell, C. T., R. E. Holzer, and E. J. Smith, OGO 3 observations of
ELF noise in the magnetosphere, 1, Spatial extent and frequency of occurrence, J. Geophys. Res., 74, 755, 1969.
S-300 Experimenters, Measurements of electric and magnetic wave fields and of cold plasma parameters aboard GEOS-1, Preliminary
results, Planet. Space Sci., 27, 317, 1979.
Sazhin, S.S., A model for hiss-type mid-latitude VLF emissions,
Planet. Space Sci., 32, 1263, 1984.
Storey, L. R. O. and F. Lefeuvre, The analysis of 6-component measurements of a random electromagnetic wave field in a mag- netoplasma -II. The integration kernels, Geophys. J. R. Astron. Soc.,
62, 173, 1980.
Taylor, H. A., Jr., H. C. Brinton, and A. R. Deshmukh, Observations of irregular structure in thermal ion distribution in the duskside magnetosphere, J. Geophys. Res., 75, 2481, 1970.
Taylor, H. A., Jr., J. M. Grebowsky, and W. J. Walsh, Structured variations of the plasmasphere: Evidence of a corotating plasma tail, J. Geophys. Res., 76, 6806, 1971.
Thorne, R. M., Whistler mode propagation in the off-meridian plane, Internal Report, Dep. of Meteorology, Univ. of Calif., Los Angeles, 1969.
Thorne, R. M., E. J. Smith, R. K. Burton, and R. E. Holzer, Plasma-
spheric hiss, J. Geophys. Res., 78, 1581, 1973.
Tsurutani, B. T., and E. J. Smith, Two types of magnetospheric ELF chorus and their substorm dependences, J. Geophys. Res., 85, 5112,
1977.
Tulunay, Y., and A. R. W. Hughes, A satellite study of the midlatitude trough in electron density and VLF radio emissions during the magnetic storm of 25-27 May, 1967, J. Atrnos. Terr. Phys., 35, 153,
1973.
M. Hayakawa and N. Ohmi, Research Institute of Atmospherics, Nagoya University, Toyokawa, Aichi, 442, Japan.
F. Lefeuvre and M. Parrot, Laboratoire de Physique et Chimie de l'Environnement, 45045 Orleans Cedex, France.
(Received June 25, 1985; revised September 6, 1985; accepted September 6, 1985.)