HAL Id: hal-00316857
https://hal.archives-ouvertes.fr/hal-00316857
Submitted on 1 Jan 2001
HAL is a multi-disciplinary open access
archive for the deposit and dissemination of
sci-entific research documents, whether they are
pub-lished or not. The documents may come from
teaching and research institutions in France or
abroad, or from public or private research centers.
L’archive ouverte pluridisciplinaire HAL, est
destinée au dépôt et à la diffusion de documents
scientifiques de niveau recherche, publiés ou non,
émanant des établissements d’enseignement et de
recherche français ou étrangers, des laboratoires
publics ou privés.
A new, unique signature of the true cusp
W. R. Keith, J. D. Winningham, O. Norberg
To cite this version:
W. R. Keith, J. D. Winningham, O. Norberg. A new, unique signature of the true cusp. Annales
Geophysicae, European Geosciences Union, 2001, 19 (6), pp.611-619. �hal-00316857�
Annales
Geophysicae
A new, unique signature of the true cusp
W. R. Keith1, J. D. Winningham1, and O. Norberg2
1Southwest Research Institute, P. O. Drawer 28510, San Antonio, Texas 78228-0510, USA
2Swedish Institute of Space Physics, Box 812, SE-981 28 Kiruna, Sweden
Received: 3 July 2000 – Revised: 13 April 2001 – Accepted: 18 April 2001
Abstract. The “cusp proper” is generally understood to be
the region enclosed by the outermost magnetospheric field lines as they map to low altitudes. It is therefore a weak-field region with continuous contact with magnetosheath plasma. Data from the recent Astrid-2 Swedish microsatellite are pre-sented which show a new, unique signature (dubbed the “true cusp”) during cusp crossings that can now be shown to be consistently present and with which one can redefine the phys-ical meaning and topology of the cusp. Similar crossings made by the DE-2, UARS and DMSP-F10 satellites also show this same, unique signature although in most cases the spatial resolution was much less than that of the Astrid-2 MEDUSA spectrometer. The presence of concurrent features of the same scale size as the plasma in the energetic particle, field and wave power data shows that this is a real structural fea-ture and not a coincidental strucfea-ture among plasma instru-ments. The persistence of this feature may lend new insight into the dynamics of the cusp and magnetospheric particle entry.
Key words. Magnetospheric physics (magnetopause, cusp,
arid boundary layers; magnetospheric configuration and dy-namics)
Abbreviations
DE, Dynamics Explorer;
DMSP, Defense Meteorlogical Satellite Program;
EMMA, Electric and Magnetic Monitoring of the Aurora; HEPS, High Energy Plasma Spectrometer;
IGRF, International Geomagnetic Reference Field; IL, Invariant Latitude;
IMF, Interplanetary Magnetic Field; IRF, Swedish Institute for Space Physics;
IRFU, Swedish Institute for Space Physics – Uppsala Division;
KTH, Swedish Royal Institute of Technology; LAPI, Low Altitude Plasma Instrument;
Correspondence to: W. R. Keith (waynek@swri.edu)
LLBL, Low Latitude Boundary Layer;
MEDUSA, Miniaturized Electrostatic DUal-top-hat Spherical Analyzer;
MEPS, Medium Energy Plasma Spectrometer; MLT, Magnetic Local Time;
PEM, Particle Environment Monitor; SwRI, Southwest Research Institute;
UARS, Upper Atmospheric Research Satellite.
1 Introduction
The 2-D and 3-D topology of the Earth’s magnetosphere has long indicated the existence of a cusp, or weak magnetic field region, near magnetic local noon at the latitude where mag-netic field lines switch from closing on the dayside to be-ing swept back into the tail, allowbe-ing for more or less di-rect penetration of magnetosheath particle fluxes to low alti-tudes. Early observations (Heikkila and Winningham, 1971) showed a high-latitude band of low-energy particle precip-itation with magnetosheath-like properties on the dayside at low-altitudes. They interpreted this feature as the long-sought-for evidence of direct solar wind entry via a mag-netic cusp. This general region of particle penetration was later separated into a “cusp proper” and a “Cleft/Boundary Layer”, representing separate particle entry processes (i.e. direct and indirect) (Newell and Meng, 1988).
Newell and Meng (1988) defined the low-altitude cusp proper as the sub-region of plasma flux that more closely re-sembles magnetosheath plasma spectral characteristics, in-dicating “more direct” entry than that associated with the Low Latitude Boundary Layer (LLBL). This definition re-sults in a cusp of much narrower extent in Magnetic Local Time (MLT) and Invariant Latitude (IL), and is limited to fairly direct plasma entry processes (i.e., little or no acceler-ation of the magnetosheath populacceler-ation). This smaller, more directly connected region is continuously present with a den-sity that remains consistent with solar wind denden-sity variations (Aparicio et al., 1991).
612 W. R. Keith et al.: A new, unique signature of the true cusp The true cusp can be defined in terms of the magnetopause
current layer, which contains the outermost layer of magnetic field lines of the magnetosphere. This very thin layer is also the site of interconnection with interplanetary field lines and many other interesting processes, some of which are not well understood. The low-altitude regions to which these outer-most field lines map are the magnetic cusps, which we be-lieve to be associated with a small sub-region of the particle-defined cusp mentioned above. Thus, this “true cusp” can represent a unique window into the large-scale workings of the magnetosphere and the magnetopause current layer. The primary difference between this definition and that of the cusp proper is that “true cusp” particles are expected to be more energetic, reflecting the accelerated populations seen in in situ measurements (Gosling et al., 1986; Song et al., 1990) and in simulations (Nakamura and Scholer, 2000) at the boundary.
Not long after the initial cusp observations, it was realized that the properties of the region were consistent with the the-ory of magnetic reconnection as proposed by Dungey (1968). The main property used to support this was the fact that the highest energy ions are seen at the most equatorward loca-tion, while lower energy particles tend to precipitate further poleward for southward IMF conditions (Shelley et al., 1976; Reiff et al., 1977). Magnetosheath plasma injected on the dayside at the reconnection point flows earthward along mag-netic field lines. As the now open field line is convected tail-ward, it’s footprint moves poleward. The higher energy par-ticles reach low altitudes more quickly and, therefore, should be seen farther equatorward. This “dispersion” is the key to identifying reconnection, and has been reproduced by such models as the one of Lockwood and Smith (1994). So far, though, these models have not been able to reproduce all of the characteristics seen in the particle data (Fuselier et al., 1999).
The cusp proper averages approximately 2 to 3 hours wide
in MLT and about 1 to 5◦ in IL (1◦ ∼ 100 km) (Newell
and Meng, 1988; Lundin 1988; Aparicio et al., 1991)
cen-tered at noon and about 78◦ IL. Its location and size vary
with changes in the IMF direction and solar wind velocities, but it is always present (Newell and Meng, 1988). The above size and location represent statistical averages and are quite large. At low altitude orbits (1000 km polar circular), a fea-ture of this size will be traversed on average in about 15 sec-onds to a minute. Trajectories not cutting through the center of the cusp would have even shorter traversal times, on the order of a few seconds. Orbits with more equatorward incli-nations may spend more time in the cusp, depending on how much local time is covered while inside the appropriate lat-itude range. A theoretical maximum for a cusp traversal (3
hours of local time at about 77◦latitude) would be on the
or-der of 8 minutes. It is important to note that, while the quick traversals of the cusp at low altitude may have limited the de-tail seen in the past, they have the advantage of being more of a “snapshot” with less blurring of the lines between spatial and temporal features. The faster sample times of recent in-struments (described below) allows the detail to be seen
with-out the need to rely on higher altitudes and slower traversals, with the concomitant intermixing of populations due to hor-izontal transport. That is, mid-altitude measurements, while showing many similar particle characteristics, may contain bounced and tailward convected populations that may not ac-curately reflect the incoming particle population.
Historically, particle measurements of the cusp have been limited by the spatial resolution they could achieve, which is directly linked to the energy sweep rates of the instruments. Most detectors to date have had sweep rates on the order of a second, which for many low-altitude cusp crossings may al-low for only a few energy spectrums to be taken if the struc-ture is small. The latest instruments, however, including the MEDUSA instrument aboard Astrid-2, can take a 32-step en-ergy sweep in 1/16 of a second for electrons and 1/8 of a sec-ond for ions, thus allowing unprecedented resolution (∼400 m) of possible fine-scale structures.
2 Instrument description
The Miniaturized Electrostatic DUal-top-hat Spherical An-alyzer (MEDUSA) was flown aboard the Swedish Astrid-2 microsatellite (Marklund, 2001). The instrument is com-posed of two spherical top-hat analyzers placed top-to-top
with a common 360◦field of view. Each detector is divided
into 16 azimuthal sectors of 22.5◦, with an elevation
accep-tance of about 5◦. It has an energy per charge range of about
1 eV to 20 keV for electrons and positive ions. The sensor and associated electronics box have a total mass of 1.7 kg and consume 3 W of power when in operation. More infor-mation on the MEDUSA instrument can be found in a paper by Norberg et al. (2001).
The MEDUSA analyzer can operate in two modes. In the first, data from all 16 sectors of both electrons and ions are relayed to the ground. In the second, however, only the three sectors from each side that are closest to the paral-lel, perpendicular and antiparallel magnetic field directions are recorded. The data presented below are of this second type. The spatial/temporal resolution is the same for these two modes and has been defined in the previous section. Gi-ven Astrid-2’s circular orbit of 1000km, this gives a spatial resolution of 460 m/sweep for electrons and 920 m/sweep for the ions.
Data are also presented from three other satellites which show similar cusp signatures. The first observation of this feature is from the LAPI instrument on the DE-2 satellite. From the UARS satellite, data are given for the HEPS/MEPS instruments. The US Air Force’s SSJ/4 particle instrument on the DMSP-F10 satellite is the final source of data. In contrast to MEDUSA, these other instruments have sweep speeds ranging from 1 to 8 seconds.
3 Observations
The first example of this new cusp feature comes from a cusp pass of the DE-2 satellite on 6 September 1982 (Fig. 1).
Integral cnts (>35 keV) #/cm sr s 2 TA002642
Fig. 1. DE-2 data from 6 September 1982 showing a cusp dispersion signa-ture in the ions with a small V at the equatorward end. Top panel is elec-tron energy flux, second is ion energy flux. The line plots in the third panel are counts of >35 keV electrons in the parallel (black) and perpendicular (red) directions. The bottom spectrogram is electric field wave power up to 1 kHz.
The data were taken by the Low Altitude Plasma Instrument (LAPI); this consists of 15 parabolic electrostatic analyzers
covering 180◦ for ions and electrons from 5 eV to 32 keV
and two Geiger-Mueller counters which measure >35 keV
electrons at 0◦and 90◦pitch angles. One 32-step spectrum is
taken each second from each sensor. Detailed information on this instrument is available from Winningham et al. (1981). The data were taken on an equatorward pass, the cusp being
located at an Invariant Latitude of 63◦and an MLT pre-noon
(10:13). A “typical looking” dispersion signature can be seen in the ion data (second panel), moving from lower (poleward) energies to higher (equatorward) energies, although the spec-trogram appears to be flat to first order at about 1 keV from 8:37:00 to 8:37:30 (all times given in UT). The feature we are interested in, however, is less than a third of the “typical” dispersion pattern, at the equatorward edge from 8:37:30 to 8:37:40. This 10-second interval clearly has a V shaped ion structure with higher energies on the edges and lower ener-gies towards the center. This V is at unusually high enerener-gies, with peaks at around 20 keV down to 2 keV at the center. The electrons (Fig. 1, top panel) clearly show enhancement
during this same time period, from 30 kilovolts down to the lowest energies. Above 1 keV, the fluxes vary spatially the same as the GM data in panel 3. Below 1 keV there is a different morphology. The third panel of Fig. 1 is Geiger-Mueller data and the parallel (black) and perpendicular (red) lines both indicate clear enhancements over their already ele-vated levels at the two edges of the feature and are collocated with the ion V edges. The bottom panel of Fig. 1 is AC elec-tric wave power from the VEFI instrument displayed from 4 to 1000 Hz. This spectrogram shows strong waves at 400
Hz and lower during the V. The ion feature covers about 0.4◦
in IL and about 18 minutes of MLT, which corresponds to a very narrow feature of approximately 50 km.
Data from the MEDUSA and EMMA instruments aboard Astrid-2 are shown in Fig. 2. The data were taken on 13 January 1999, during a pass over the southern auroral zone. The spacecraft was traveling equatorward at an altitude of 1029 km. In the antiparallel (downward moving) ion spec-trogram (Fig. 2, bottom panel), another typical dispersion signature can be seen, although it appears to be nearly flat as well at about 300 eV from 20:12:49 to 20:13:13. The V
614 W. R. Keith et al.: A new, unique signature of the true cusp
TA002641
power
power
power
Fig. 2. Astrid-2 data from 13 January 1999 with a dispersion signature and equatorward V similar to DE-2. Top spectrogram is electric field wave power up to 8 Hz. The second and third panels are delta magnetic field wave power. The middle three spectrograms are electrons in the parallel, perpendicular, and antiparallel directions, respectively. The bottom three spectrograms are for the same three look directions for the ions. The line plots in the fourth and fifth panels are electric field calculated for the eastward and equatorward directions, assuming E is zero along the magnetic field. The two panels below it contain delta magnetic field data for the same two directions. The bottom two panels contain the IMF in the y and z directions as measured by IMP-8.
feature is less than a third of this “typical” dispersion pat-tern, at the equatorward edge from 20:13:16.5 to 20:13:28. The onset of the feature stands out as a sudden increase of about 1.5 keV (from ∼500 eV to ∼2 keV) in the peak en-ergy of the ions. The peak enen-ergy of the feature then dips to about 1 keV at 20:13:21.5 and becomes weaker in intensity. From this point until 20:13:28 the energy steadily increases back to 2 keV. The ions cut off abruptly on the equatorward edge of the cusp at 20:13:30. The same feature is present in the mirroring perpendicular pitch-angle ions, and the 2 keV “wings” appear in the parallel (upwards) ions, however, the lower energy central portion is not present.. In these latter two spectrograms (second and third from the bottom), low-energy enhancements (∼3 eV to 100 eV) can also be seen at the beginning (20:13:18) and end (20:13:25) of the feature moving up the field line. The antiparallel (downwards) elec-trons (and to a lesser extent the other pitch-angle elecelec-trons) also show <300 eV enhancements at 20:13:18 and 20:13:25 (middle three panels).
The EMMA electric and magnetic field experiment mea-sures two spin-plane components of the electric field and three dimensions of magnetic field. For the data presented here, the electric field along the direction of the magnetic field has been assumed to be zero and the two perpendicu-lar components in the eastward and equatorward directions have been calculated. The magnetic field direction makes an
angle of −23◦with the spacecraft spin-plane at the time of
this cusp crossing. The electric field in the fourth (eastward) panel fluctuates about −10 mV/m outside of the cusp but be-gins to gain amplitude going into the low-energy end of the dispersion feature at about 20:13:00. The field peaks to −225 mV/m at the poleward edge of the ion feature at 20:13:16.5. After this, it increases steadily to 200 mV/m at the equator-ward end of the feature (20:13:28), and afterequator-wards settles to 0. The equatorward (north, in this case) pointing perpendic-ular electric field in the fifth panel begins at a potential of 100 mV/m before dropping by 250 mV/m at the poleward edge of the V. It then returns to its original value of 100 mV/m in the center before plunging to −300 mV/m at the far edge of the feature. It then settles to approximately zero as well. The delta magnetic field, calculated by subtracting the standard IGRF 95 geomagnetic model field from the full field measurements, is shown on the fourth and third from the bottom panels of Fig. 2 in the same two directions as were displayed for the electric field. The upper (eastward) component goes from 600 nT before the V, down to −150 nT at the end, revealing a significant current system in that one limited region. Northward data in the lower panel also shows a net drop of about 200 nT over the feature, although the trend is much less obvious in this case. The bottom two panels contain the GSM y and z components of the Interplan-etary Magnetic Field, as measured by IMP-8 outside of the bowshock. These values have not been time-shifted; how-ever they are representative of the delayed values for this pass (weakly southward and strongly duskward). The pos-sible significance of this will be explored in the discussion section. The magnetic wave power (Fig. 2, second and third
panels) is calculated by a FFT from the detrended magne-tometer data (lower two panels) perpendicular to the main field in the eastward (second spectrogram) and equatorward (third spectrogram) directions. The electric field wave power is calculated in the same manner and is shown at the top. The spectrograms show frequencies up to 8 Hz, calculated with a four second sliding window. The time period of the ion fea-ture, from 20:13:16 to 20:13:28, coincides with a dramatic increase of over two orders of magnitude in the wave power at all displayed frequencies.
The Magnetic Local Time of the ion V event was about
10:52, and the Invariant Latitude range covered only 0.57◦,
from −69.54◦to −68.97◦. The north/south component of the
satellite track as it crossed this feature is only ∼74 km (only about 10 of the old one-second sweeps) which makes this a very small feature indeed, even in terms of the cusp proper. Examples of this type of feature are by no means unique, but can be hard to spot due to their small size and the fact that they are very localized in IL and MLT, being found within about an hour of noon in MLT at cusp latitudes.
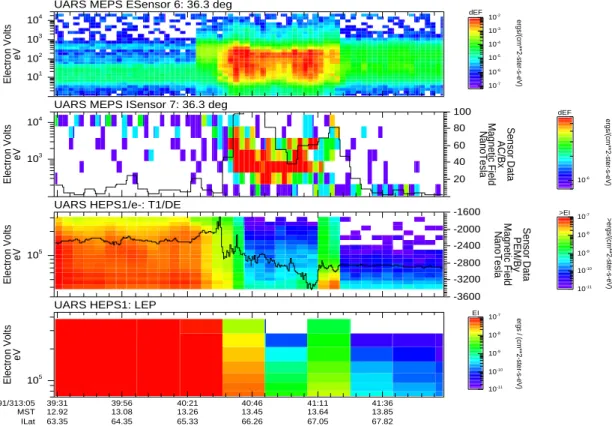
Other instruments have seen similar structures, despite the fact that they typically have much lower time resolutions. The HEPS instrument on the UARS satellite studies high-energy electrons and ions (from 30 keV to 5 MeV and 150 MeV, respectively) and consists of four electron/proton de-tectors, two electron detectors and two Low Energy Proton (LEP) detectors (Winningham et al., 1993). HEPS data pre-sented here (Fig. 3) are electrons from one of the near-zenith pointing detectors and from one of the LEP detectors. The MEPS spectrometer is made up of eight divergent plate elec-trostatic analyzers and looks at electrons and ions in the 1 eV to 32 keV range. Each detector is situated on the spacecraft to have a different look direction angle with respect to the spacecraft. The MEPS data here are electrons and ions from
the detector with a look direction of 36.6◦ with respect to
the spacecraft zenith (Winningham et al., 1993). Data from a 1991 cusp pass are presented in Fig. 3. The data were taken on 9 November, while UARS was heading poleward at an altitude of about 600 km. The feature of interest is
lo-cated in the afternoon (13:30) sector in MLT and about 67◦
IL (about 2◦ lower in IL than the previous Astrid-2 data).
The time resolution is 2 seconds for MEPS and 4 and 8 for HEPS electrons and protons, respectively. A V shaped fea-ture can be distinguished which lasts about 40 seconds in the MEPS ion data (second panel); this begins at 05:40:40 at about 2 keV, decreases to ∼500 eV in the center (05:40:56) and increases back to 2 keV at 05:41:17. The MEPS elec-tron data over this same time period shows enhancements centered at about 40 eV at the beginning and end, with a strong flux of 100 eV electrons throughout the event. Notice the softening of the electrons at the ends, where the density is the highest. HEPS high-energy particle data also shows significant enhancements at the edges of the feature at all energies up to the max plotted of about 300 keV. Equator-ward of the feature, both electrons and ions show very large fluxes. From 05:40:26 to 05:40:43, the HEPS electrons fall off steadily, corresponding to the beginning of the MEPS ion
616 W. R. Keith et al.: A new, unique signature of the true cusp
UARS MEPS ESensor 6: 36.3 deg
10-7 10-6 10-5 10-4 10-3 10-2 ergs/(cm**2-ster-s-eV) dEF
UARS MEPS ISensor 7: 36.3 deg
10-6
ergs/(cm**2-ster-s-eV)
dEF
UARS HEPS1/e-: T1/DE
10-11 10-10 10-9 10-8 10-7 >ergs/(cm**2-ster-s-eV) >EI
UARS HEPS1: LEP
10-11 10-10 10-9 10-8 10-7 ergs / (cm**2-ster-s-eV) EI 101 102 103 104 Electron Volts eV 103 104 Electron Volts eV 20 40 60 80 100
NanoTesla Magnetic Field
AC/Bx Sensor Data 105 Electron Volts eV -3600 -3200 -2800 -2400 -2000 -1600
NanoTesla Magnetic Field PEM/By Sensor Data
1991/313:05 MST ILat 105 Electron Volts eV 39:31 12.92 63.35 39:56 13.08 64.35 40:21 13.26 65.33 40:46 13.45 66.26 41:11 13.64 67.05 41:36 13.85 67.82
Fig. 3. UARS data from 9 November 1991, showing a V signature without the dispersion tail. Top panel is electrons 36◦from zenith and the second panel is ions from the same direction. The third spectrogram is electrons from 35 keV up to 300 keV. The bottom panel contains ions from 70 keV to 400 keV. The line plot in the second panel is integrated magnetic field wave power from 0 to 100 Hz and the third panel has a line plot of the Bymagnetic field.
feature. There is also a significant increase of electrons at the poleward edge of the feature at 05:41:16, which peaks at 40 keV. The LEP protons decrease at the onset of the feature similarly to the HEPS electrons and also show an increase at all energies at the opposite end (05:41:16).
The Bymagnetic field (line plot in third from top panel),
which is fairly constant before and after the feature, is very disturbed during the period from 05:40:40 to 05:41:17, in-creasing sharply and then dein-creasing steadily during this time period. The magnetic wave power data is integrated from 0 to 100 Hz and labeled AC/Bx (on the right of the second panel). The integrated power increases by over an order of magni-tude to 100 nT at the onset of the ion feature, dips down to about 40 near the center at 05:41:01 and then peaks again at 80 nT at the end of the structure before returning to low (un-der 10 nT) values. The Invariant Latitude covered during this
time, however, is only 1.2◦which is about 143 km, a factor of
2 larger than the Astrid-2 feature but still at the very bottom of the range of cusp sizes.
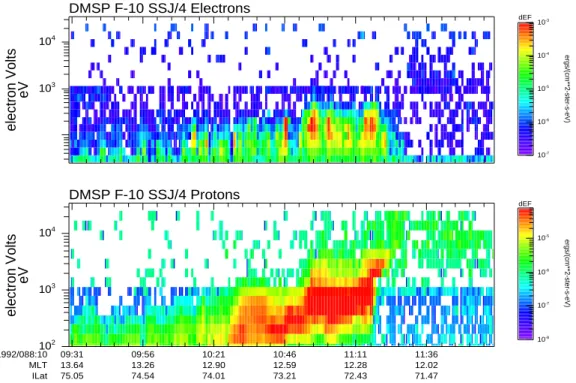
Particle data from the SSJ/4 instrument of the DMSP-F10 satellite can be seen in Fig. 4. SSJ/4 is a set of four cylin-drical electrostatic analyzers, two sensors (high and low en-ergies) for electrons and ions. Together they cover an energy range from 30 eV to 30 keV, completing a spectrum once per second. Further information about the DMSP program and the SSJ/4 instruments can be found in Hardy et al. (1984).
The data presented are from 28 March 1992, when the satel-lite was passing equatorward over the cusp at an Invariant
Latitude of 73◦and a MLT just post noon (12:20). The ion
data again exhibits the energy-latitude dispersion as it passes from higher to lower latitudes and also clearly shows a “V” structure, beginning at 10:10:55 UT, which lasted just under 25 seconds. The peak energy of the poleward edge of the structure is slightly less in this case, about 1 keV, however the middle and equatorward edges are peaked at 500 eV and 2 keV as in the previous two cases. The corresponding elec-tron enhancements at the edges are also similar to the pre-vious cases, being mostly in the 100 to 200 eV range. The satellite altitude at the time of the pass was 770 km and the
feature spanned 0.77◦of invariant latitude, giving it a length
of about 96 km which, like the other cases, is very small; on the order of a proton gryroradius at the magnetopause.
4 Discussion
We have presented data from several different satellites and instruments, representing various sensor types and
technolo-gies. The fact that the narrow “V” feature is consistent
throughout all of the data sets from different satellites and plasma analyzer types indicates that it is not a characteris-tic of the instruments taking the data, and must be
consid-DMSP F-10 SSJ/4 Protons 10-8 10-7 10-6 10-5 ergs/(cm**2-ster-s-eV) dEF DMSP F-10 SSJ/4 Electrons 10-7 10-6 10-5 10-4 10-3 ergs/(cm**2-ster-s-eV) dEF 1992/088:10 MLT ILat 102 103 104 electron Volts eV 09:31 13.64 75.05 09:56 13.26 74.54 10:21 12.90 74.01 10:46 12.59 73.21 11:11 12.28 72.43 11:36 12.02 71.47 103 104 electron Volts eV
Fig. 4. DMSP F-10 data from 28 March 1992; a dispersion signature can be seen along with a lopsided V. The upper spectrogram is electrons, while the lower is ions.
ered to be a real structure. Also, the fact that the energetic particle and field instruments see a feature at the same time with a comparable scale-size also points to this being some-thing physical. The feature is also persistent; the examples that have so far been found with this distinctive shape have prompted a more thorough statistical search of Astrid-2 and DMSP data. The search will be conducted among passes whose orbital track passes through a box containing Mag-netic Local Times between 10:30 and 13:30 and Invariant
Latitudes between 60◦and 80◦or −60◦and −80◦.
Reiff et al. (1977) discuss an injection model, called “dif-fusive injection”, which assumes an energy dependence on the rate of diffusion from a central “injection field line”. This results in an energy dispersion in which the highest energy particles are towards the edges of the cusp (since they can random-walk farther from their injection point than the lower energy particles). Later works (Reiff et al., 1980; Burch et al., 1980; Woch and Lundin 1992; Weiss et al., 1995) con-firmed that these features are seen, usually during northward IMF conditions, and offered other explanations for these “large scale V’s”. Possible explanations, such as tail
recon-nection, changes in the IMF Bzand lobe reconnection have
been offered. The features presented here, however, are of a much smaller scale size than the large V dispersion features studied by these authors and appear to be very localized to what has been defined above to be the “true cusp” region. While some characteristics and possible causes of these two structures may overlap, we believe that they are not equiva-lent.
If this feature is the “true cusp” as defined above, then it is simply the low-altitude mapping of the magnetopause
cur-rent layer. The curcur-rent layer is the boundary that separates the magnetosphere which is dominated by the Earth’s geo-magnetic field and the magnetosheath which is dominated by the IMF from the Sun. Higher energy particles penetrate more deeply into this boundary layer and so will be on the earthward side of the current layer while lower energy par-ticles are closer to the magnetosheath. Song et al. (1990) reported that the ion and electron distribution functions in-creased in average energy, moving inwards at the current layer. At low altitudes, the “inner” edge of the magnetopause is towards the edges of the true cusp while the lower energy outer parts map towards the center (Stasiewicz, 1991). The result is a low-altitude energy signature that is peaked at the edges of the cusp, or “V” shaped, reflective of ion energiza-tion in the current layer that is known to increase from outer to inner edge. The closer to the center of the cusp the satellite track is, the deeper and wider the V. The collocation of the energetic particles and increase in wave power are also clues to the origin of the feature, although a simple “cartoon” pic-ture of the magnetopause quickly becomes insufficient to ex-plain them. The observed low-frequency waves may be those that are seen in the magnetopause current layer (Gurnett et al., 1979), traveling down the field lines as a wave guide and further supporting the idea that this is a low-altitude mapping of the turbulent current layer. The high-energy particles seen at the poleward edge of the UARS event are more puzzling. If the field lines in this region do not remain high in the plasma mantle, as in the classical picture, but instead twist to lower latitudes in the tail (as can sometimes be seen in the Tsy-ganenko96 model) these high energy particles may be part of the drifting population that is lost on the flanks of the
magne-618 W. R. Keith et al.: A new, unique signature of the true cusp
Fig. 5. Screen dump from the Orbit Visualization Tool showing the Earth, the outermost set of magnetic field lines as calculated from the Tsyganenko96 model and the field line passing though Astrid-2 (bottom side of the Earth, not shown). Note the twisting of the field lines relative to the x − z plane shown.
topause. If this magnetopause mapping is indeed the source of the signature, then this opens up a new technique in the study of magnetopause dynamics.
A preliminary study of the January 1999, Astrid-2 pass has been conducted using a pre-release version of Orbit Vi-sualization Tool (OVT) being developed at the Swedish In-stitute of Space Physics in Uppsala (IRFU) by a team lead by Kristof Stasiewicz. This software includes 3-D visual-ization of T96 generated magnetospheric field lines (Tsyga-nenko, 1995) and satellite orbits. Magnetopause field lines (adjusted for IMF and plasma pressure) during this cusp pass in January 1999, are in good agreement with the satellite po-sition (Fig. 5) and cover a low-altitude area in IL and MLT that is consistent with the observations. The field line passing through the satellite location is the one that exits the figure on the lower right hand side. This time step is near the begin-ning of the pass. Subsequent time steps are closed and move inwards with the progression of time. This visualization, of course, cannot unambiguously determine the open/closed field line boundary during the pass; however, it serves to il-lustrate the relative positions of the field lines crossed. Note also the dawn/dusk warping of the cusp field lines relative to the (x − z plane) grid. One interesting characteristic of the field lines during the Astrid-2 pass is their obvious twisting in the GSM y direction. This is due to the fact that the IMF input into the Tsyganenko model for that time was strongly
dominated by By (see Fig. 2, bottom two panels). Further
investigation revealed that all of the V’s (for which IMF data
is available) took place when the IMF had a dominant By
component. This possible IMF dependence will need to be explored in greater detail but offers a further explanation for the double-sided nature of the V’s. Crooker (1988) models the cusp as a wedge whose base is fixed while the tip
ro-tates with changing IMF By. The edges of the wedge map
to the newest open field lines, or x-line, at the outer surface
of the magnetopause. During strong By, which has been the
case for all of the V’s studied so far, the cusp will be “wind socked” over so that the spacecraft in a polar orbit would cross it sideways giving a double signature, the second part being the mirror of the first. This is reflective of the two disconnected X-lines on the dawn/dusk sides in Crooker’s model. Available electric field data in the current set of ob-servations appears to support this interpretation. The electric field is V-shaped about the centerline and does not change direction. The integrated potential for the Astrid-2 pass is about 50 kV; this does not represent the maximum, as we do not cross the maximum contours. This is consistent with Crooker’s idea of a concentrated electric field in the throat.
5 Conclusions – future work
This paper presents a previously unreported small-scale fea-ture that appears to be unique to regions we call the true cusps of the northern and southern hemispheres. It is hoped that as more and more high-resolution low-altitude data, such as that from the MEDUSA instrument, becomes available, new information about the cusp and the associated particle en-try processes may be derived. The November 2000 launch of Munin, whose primary payload is MEDUSA-2, should add greatly to the dataset of MEDUSA-class instruments and yield many new cusp passes for study.
It is clear that more work needs to be done in studying these features and the connections between the true cusp, the magnetopause current layer and the Interplanetary Magnetic Field in general. Future work, which will comprise a PhD dissertation, will focus on understanding the connections be-tween the IMF, magnetopause current layer and the cusp as well as increasing the statistical significance of the feature by searching for more occurrences. In addition, the OVT 3-dimensional visualization tool being developed will be used to characterize the field line geometry at the satellite location at the time the data was taken. It is hoped that this work may lead to a consensus on particle entry methods and the rela-tionship of the magnetopause current layer to the true cusp.
In summary, the data presented are consistent with a mea-surable low altitude image of the magnetopause current layer. This set of field lines are those on which ions are acceler-ated above magnetosheath energies and which form the clas-sical magnetic cusp (i.e. not a plasma cusp). The mapping
topology at low altitudes appears to “swing” with By as
ex-pected from the Crooker model and has a concentrated elec-tric field as predicted. The wave data are also consistent with the observations of a turbulent, noisy magnetopause in the ELF/ULF region. Energetic particles could be dumped drift-ing particles which are on field lines that see a non-equatorial mirror force (Sheldon et al., 1998; Delcourt and Sauvaud, 1999) in the vicinity of the magnetopause and execute drift up and into the magnetic cusp where they circulate and can be lost.
Acknowledgements. The authors would like to acknowledge our MEDUSA and Astrid-2 partners in Sweden, without whom this in-strument would not have flown; especially the MEDUSA team at the Swedish Institute for Space Physics (IRF) in Kiruna and the Astrid-2/EMMA team at the Royal Institute of Technology (KTH) in Stockholm. This work was supported by ONR contract N00014-98-1-0175.
Topical Editor G. Chanteur thanks K. Stasiewicz and another ref-eree for their help in evaluating this paper.
References
Aparicio, B., Thelin, B., and Lundin, R., The polar cusp from a particle point of view: A statistical study based on Viking data, J. Geophys. Res., 96, 14023, 1991.
Burch, J. L., Reiff, P. H., Heelis, R. A., Spiro, R. W., and Fields, S. A., Cusp region particle precipitation and ion convection for northward interplanetary magnetic field, Geophys. Res. Lett., 7, 393, 1980.
Crooker, N. U., Mapping the merging potential from the magne-topause to the ionosphere through the dayside cusp, J. Geophys. Res., 93, 7338, 1988.
Delcourt, D. C. and Sauvaud, J.-A., Populating of the cusp and boundary layers by energetic (hundreds of keV) equatorial parti-cles, J. Geophys. Res., 104, 22635, 1999.
Dungey, J. W., Waves and particles in the magnetosphere, in The Physics of the Magnetosphere, Eds. R. L. Carovillano, J. F. Mc-Clay and H. R. Radoski, p. 246, D. Riedel, Norwell, Mass., 1968. Fuselier, S. A., Lockwood, M., Onsager, T. G., and Peterson, W. K., The source population for the Cusp and Cleft/LLBL for south-ward IMF, Geophys, Res. Lett., 26, 1665, 1999.
Gosling, J. T., Thomsen, M. F., Bame, S. J., and Russell, C. T., Accelerated plasma flows at the near-tail magnetopause, J. Geo-phys. Res., 91, 3029, 1986.
Gurnett, D. A., Anderson, R. R., Tsurutani, B. T., Smith, E. J., Paschmann, G., Haerendel, G., Bame, S. J., and Russell, C. T., Plasma wave turbulence at the magnetopause: Observations from ISEE 1 and 2, J. Geophys. Res., 84, 7043, 1979.
Hardy, D. A., Schmitt, L. K., Gussenhoven, M. S., Marshall, F. J., Yeh, H. C., Schumaker, T. L., Huber, A., and Pantazis, J., Precip-itating electron and ion detectors (SSJ/4) for the block 5D/flight 6–10 DMSP satellites: Calibration and data presentation, Rep. AFGL-TR-84-0314, Air Force Geophys. Lab., Hanscom Air Force Base, Mass., 1984.
Heikkila, W. J. and Winningham, J. D., Penetration of magne-tosheath plasma to low altitudes through the dayside magneto-spheric cusps, J. Geophys. Res., 76, 883, 1971.
Lockwood, M. and Smith, M. F., Low and middle altitude cusp par-ticle signatures for general magnetopause reconnection rate vari-ations: 1. Theory, J. Geophys. Res., 99, 8531, 1994.
Lundin, R., On the magnetospheric boundary layer and solar wind energy transfer into the magnetosphere, Space Sci. Rev., 48, 263, 1988.
Marklund, G. T., Blomberg, L. G., and Persson, S., Astrid-2, an
advanced microsatellite for auroral research, Ann. Geophysicae, 19, 589–592, 2001 (this issue).
Nakamura, M. and Scholer, M., Structure of the magnetopause re-connection layer and of flux transfer events: Ion kinetic effects, J. Geophys. Res., 105, 23179, 2000.
Newell, P. T., and Meng, C.-I., The cusp and cleft/boundary layer: Low altitude identification and statistical local time variation, J. Geophys. Res., 93, 14549, 1988.
Norberg, O., Winningham, J. D., Lauche, H., Keith, W., Puccio, W., Olsen, J., Lundin, K., and Scherrer, J., The MEDUSA electron and ion spectrometer and the PIA photometers on Astrid-2, Ann. Geophysicae, 19, 593–600, 2001 (this issue).
Reiff, P. H., Hill, T. W., and Burch, J. L., Solar wind plasma injec-tion at the dayside magnetospheric cusp, J. Geophys. Res., 82, 479, 1977.
Reiff, P. H., Burch, J. L., and Spiro, R. W., Cusp proton signatures and the interplanetary magnetic field, J. Geophys. Res., 85, 5997, 1980.
Sheldon, R. B., Spence, H. E., Sullivan, J. D., Fritz, T. A., and Chen, J., The discovery of trapped energetic electrons in the outer cusp, Geophys. Res. Lett., 25, 1825, 1998.
Shelley, E. G., Sharp, R. D., and Johnson, R. G., He++and H+ flux measurements in the dayside cusp: Estimates of convection electric field, J. Geophys. Res., 81, 2363, 1976.
Song, P., Elphic, R. C., Russell, C. T., Gosling, J. T., and Cattell, C. A., Structure and properties of the subsolar magnetopause for northward IMF: ISEE observations, J. Geophys. Res., 95, 6375, 1990.
Stasiewicz, K., Polar cusp topology and position as a function of interplanetary magnetic field and magnetic activity: Comparison of a model with viking and other observations, J. Geophys. Res., 96, 15789, 1991.
Tsyganenko, N. A., Modeling the Earth’s magnetospheric magnetic field confined within a realistic magnetopause, J. Geophys. Res., 100, 5599, 1995.
Weiss, L. A., Reiff, P. H., Webber, E. J., Carlson, H. C., Lockwood, M., and Peterson, W. K., Flow-aligned jest in the magnetospheric cusp: Results from the Geospace Environment Modeling Pilot program, J. Geophys. Res., 100, 7649, 1995.
Winningham, J. D., Burch, J. L., Eaker, N., Blevins, V. A., and Hoffman, R. A., The Low Altitude Plasma Instrument (LAPI), Space Sci. Inst., 5, 465, 1981.
Winningham, J. D., Sharber, J. R., Frahm, R. A., Burch, J. L., Eaker, N., Black, R. K., Blevins, V. A., Andrews, J. P., Rud-ski, J., Sablik, M. J., Chenette, L. D., Datlowe, D. W., Gaines, E. E., Imhof, W. I., Nightingale, R. W., Reagan, J. B., Robinson, R. M., Schumaker, T. L., Shelley, E. G., Vondrak, R. R., Voss, H. D., Bythrow, P. F., Anderson, B. J., Potemra, T. A., Zanetti, L. J., Holland, D. B., Rees, M. H., Lummerzheim, D., Reid, G. C., Roble, R. G., Clauer, C. R., and Banks, P. M., The UARS Particle Environment Monitor, J. Geophys. Res., 98, 10649, 1993. Woch, J. and Lundin, R., Magnetosheath plasma precipitation in the
polar cusp and its control by the interplanetary magnetic field, J. Geophys. Res., 97, 1421, 1992.