HAL Id: hal-00296875
https://hal.archives-ouvertes.fr/hal-00296875
Submitted on 7 Jun 2005
HAL is a multi-disciplinary open access
archive for the deposit and dissemination of
sci-entific research documents, whether they are
pub-lished or not. The documents may come from
teaching and research institutions in France or
abroad, or from public or private research centers.
L’archive ouverte pluridisciplinaire HAL, est
destinée au dépôt et à la diffusion de documents
scientifiques de niveau recherche, publiés ou non,
émanant des établissements d’enseignement et de
recherche français ou étrangers, des laboratoires
publics ou privés.
Observation and analysis of etesian wind storms in the
Saroniko Gulf
A. Pezzoli
To cite this version:
A. Pezzoli. Observation and analysis of etesian wind storms in the Saroniko Gulf. Advances in
Geosciences, European Geosciences Union, 2005, 2, pp.187-194. �hal-00296875�
SRef-ID: 1680-7359/adgeo/2005-2-187 European Geosciences Union
© 2005 Author(s). This work is licensed under a Creative Commons License.
Advances in
Geosciences
Observation and analysis of etesian wind storms
in the Saroniko Gulf
A. Pezzoli
DITIC, Politecnico di Torino, Corso Duca degli Abruzzi 24, 10129 Torino, Italy Received: 24 October 2004 – Accepted: 18 May 2005 – Published: 7 June 2005
Abstract. The purpose of this work is to study the
Ete-sian winds in the Saroniko Gulf to understand the complicate physical processes that generate the windstorms in the Sa-roniko Gulf. It is developed a study of the weather patterns characteristic of the Saroniko Gulf and a comparisons of the wind data measured on land by the station of Helliniko air-port (years: 1990–2000) and at sea by a buoy (years: 2000– 2002) during the month of August. It is presented a statis-tical model that shows, as a probability of occurrence, the variations of the wind speed in function of the variations of the wind direction. Finally the statistical model is compared with the RAMS limited area model during a test case in Au-gust 2004; the now-casting results obtained using these two different methods are compared to data measured by station of the automatic weather network of the HNMS.
1 Introduction
The Etesian winds, also called Meltemi, blow between NW and NE in the Aegean Sea in the summer season. This is a consequence of the low-pressure system that stretches from Anatolia to north-west India that is formed by intense heat-ing of the region (a “heat-low”). This peak in August when the mean wind speed is around 8 ms−1and the mean of the maximum values is included between 15 ms−1and 17 ms−1 in the southern Aegean. Although they produce choppy con-ditions for much of the time, their principal benefit is to mod-erate temperatures in coastal regions. Occasionally, they may produce sudden wind and squall however be associated with violent thunderstorm; this is the most dangerous situation for the Aegean Sea and Saroniko Gulf and occur when the cir-culation pattern combines with an influx of cold air at upper levels from more northerly latitudes while at the surface the hot air continues to be drawn round the heat low. This combi-nation makes the atmosphere highly unstable and hence ideal
Correspondence to: A. Pezzoli
(alessandro.pezzoli@polito.it)
for convective activity and the formation of vigorous thun-derstorms (Burroughs and Lynagh, 1999).
Besides the Saroniko Gulf that is between Attica penin-sula, Corinth and Peloponnesian regions as illustrated in Fig. 1, have in the summer period a most complicated at-mospheric circulation. This is caused by the formation of the sea breeze that affect the west coast of the Attica peninsula from the direction of southwest. These two winds, the Ete-sian and the sea breeze that blow in opposite directions, can converge in the coastal zone of the Attica peninsula thus the speed of the gradient wind can fluctuate in function of the speed of the thermal wind.
The purpose of this work is to study the Etesian winds in the Saroniko Gulf to understand the complicate physical pro-cesses that generate the windstorms in this zone. Therefore it is developed a detailed study of the weather patterns that characterize the Etesian winds and the sea breeze in the Sa-roniko Gulf and a comparisons of the wind data measured on land by the station of Helliniko airport (years: 1990–2000) and at sea by a buoy (years: 2000–2002) during the month of August. It is presented a statistical model that shows, as a probability of occurrence, the variations of the wind speed in function of the variations of the wind direction. This model can be used to make a now casting of the Etesian winds and to detect the chance to have windstorms in the Saroniko Gulf. Finally the statistical model is compared with the RAMS limited area model (Pielke, 2002) during a test case in the August 2004 (16/08/2004); the obtained results of the now-casting using these two different methods are compared to data measured by station of the automatic weather network of the HNMS.
2 The weather patterns in the Saroniko Gulf
Following the studies of Mayencon (2004) it should be ex-pected to face up with two weather patterns: the Etesian pat-tern (Meltemi wind) and the sea breeze patpat-tern.
188 A. Pezzoli: Etesian wind storms in the Saroniko Gulf
14
Figure 1.
Saroniko Gulf. The flags show the principal direction of the sea breeze from SW and
of the Etesian wind from NE (courtesy: Microsoft Encarta).
Fig. 1. Saroniko Gulf. The flags show the principal direction of the sea breeze from SW and of the Etesian wind from NE (courtesy: Microsoft Encarta).
2.1 The Etesian pattern
Between a trough located on the south and south west of Turkey, and high pressures on the north of the Aegean sea and on the Balkanize peninsula, a thermal flow can establish from N to NE. The thermal depression which goes through the Peloponnesian in the afternoon does not affect the Sa-roniko Gulf if the N–NE wind in upper atmosphere is higher than 6÷7 ms−1. The sounding of Hellenikon Airport, very closed to the site, show that, in the Etesian pattern, the wind in upper atmosphere at 800 m is higher than 7 ms−1and
al-ways blows from N or NE. This is a typical characteristic of an Etesian weather.
The Etesian wind blowing from N–NNE in the Aegean sea, often strong, turns NE and blows slowly in the region of Athens. In the surface, in the morning, the wind is gen-erally weak and blows N–NW. It becomes stronger, veering, reaching NNE or NE in sea, even ENE. Going down the hills, it is an irregular wind in intensity and in direction. In the late afternoon, this wind usually backing to north. On the coast closed to Athens, the Etesian who blows from land is often warm in summer, around 35◦C in the afternoon, reach-ing sometimes 40–43◦C, while the sea temperature is around 25◦C. This temperature gap creates just above the sea a thin air layer in which the temperature grows with the altitude
(thermal inversion). This thin layer very stable slows down strongly the Etesian on sea, even very closed to the coast. This phenomenon of thermal inversion explains the genera-tion of areas of calm on sea.
When the Etesian is weak (less than 5 ms−1in upper at-mosphere) and as it is warm, it cannot prevent that the sea breeze blow from SW and that the wavy breeze front reach the south-west coastal zone of Attica. This zone of conver-gence, where the Etesian wind and the sea breeze meet, may reach 1÷2 km. In the late afternoon, the decrease of the tem-perature leads to a strengthening of the Etesian, which pushes back the sea breeze front in the open sea.
2.2 The sea breeze pattern
When the gradient wind is absent or weak and when the onshore convection is sufficient, the wind in the morning blows feeble from NW or WNW, then it strength and back to W or WSW around 12:00 LT or 13:00 LT. It goes on pro-gressively backing until 15:00 LT, to reach SW or SSW. Be-tween 15:00 LT and 17:00 LT, when the pressure in Athens-Hellenikon becomes lower of 2 hPa than the pressure at the Sounion Cape, generally the wind turns quickly to the SE. This rotation is due to the important landscape of the penin-sula at the SE of Athens, which canalizes the marine breeze. When the breeze generated by the thermal trough centered
15
Figure 2. Position of the Helliniko Airport AWS and the buoys in the Saroniko Gulf.
Fig. 2. Position of the Helliniko Airport AWS and the buoys in the Saroniko Gulf.
on the Peloponnesian arrives, the wind turns S and become stronger.
2.3 Forecast of the weather pattern in the Saroniko Gulf The identification of the precursor and large-scale synoptic conditions in the Mediterranean sea have been the subject of specific interest in the last few years to analyze the ex-treme precipitations events (for a review of the studies see Rudari et al., 2002). In our case it is very important to de-tect the weather patterns to forecast the wind conditions in surface and to detect the position of the convergence zone between the Etesian wind and the sea breeze. To define the weather patterns in the Saroniko Gulf two precursors used. The first was the wind speed at 925 hPa (approximate alti-tude of 800 m). In effect, as shown by Mayenc¸on (2004):
– u925≤6.5 ms−1 from NNE-NE: the sea breeze was the
wind in the Saroniko Gulf near the coastal zone of At-tica.
– 6.5 ms−1<u
925<8.5 ms−1 from NNE-NE: in the
Sa-roniko Gulf near the coastal zone of Attica was the Sea Breeze Convergence Zone (SBCZ).
– u925≥8.5 ms−1from NNE-NE: the Etesian wind was in
the Saroniko Gulf.
The second precursor of the weather pattern was the “severe weather index” k (George, 1960)
k = (T850−T500) + Td850− (T700−Td700) (1)
in which T is the air temperature◦C and Tdis dew point◦C;
these temperatures are referring to particular pressure lev-els (850 hPa, 700 hPa and 500 hPa). Usually the k index is used to understand the stability of atmosphere (Hand et al., 2004) and the k≥20 is a signal of risk of thunderstorm. In the Saroniko Gulf is possible to use the k index to define the characteristic weather patterns of the race area. It is true that in August, in the Saroniko Gulf, the air is dry and so, also if the k index is higher (risk of thunderstorm), it is not possible to have clouds. For this reason it is suggested to use the k index, in the Saroniko Gulf, to define the weather patterns and not to define the atmospheric stability. In the forecast, issued during the Olympic Games (August, 2004), was used the k index to define the weather patterns and the “relative vorticity” [10−5s−1] (AA.VV., 2003) to decide the state of atmosphere.
In the Saroniko Gulf, were identified the following weather patterns:
– k≤15◦C: “light” sea breeze (wind speed 2–3.1 ms−1)or Etesian wind (see the wind speed in upper atmosphere at 925 hPa).
– 15◦C<k≤20◦C: “medium” sea breeze (wind speed 3.1– 4.2 ms−1).
– 20◦C<k≤27◦C: “medium” sea breeze (wind speed 3.1– 4.2 ms−1)and possible off-shore gradient wind (from SW).
190 A. Pezzoli: Etesian wind storms in the Saroniko Gulf
– 27◦C<k≤33◦C: Sea Breeze Convergence Zone
(SBCZ).
– k>33◦C: “strong” sea breeze (wind speed 4.2– 6.7 ms−1).
During the forecast issued in August 2004 for the Olympic Games the skill of this parameterization of the weather pat-terns was around 75%.
3 The now-casting in the Saroniko Gulf
In this section the methods to build the statistical model, also called “swing table” (Molyneux, 2003), used to prepare the forecast during the August 2004 will be analyzed. In other the same model, merged with a meso-scale non-hydrostatic model (RAMS), can used to issue the now-casting warning for the situation with high speed of the wind. The last part of this section will be dedicated to study the test case of the 16/08/2004 in the Saroniko Gulf.
3.1 The database
The first step to build the statistical model (“swing ta-ble”) is to research the reliable meteorological data measured by a significant weather station. The goal of this research is to make the statistical model for the August month. The Hellenic Meteorological Service (HNMS) in cooperation with the Hellenic Center for Marine Research have managed many Automatic Weather Stations (AWS) and three buoys located in the Attica Peninsula and in the Saroniko Gulf near the coastal zone (http://www.hnms.gr/hnms/english/index html). The an-alyzed database is represented by the meteorological data measured from the AWS of the Hellinikon Airport and the buoy deployed at 37.85 N–23.70 E (see Fig. 2). The buoy has measured in the months of August of the years 2000, 2001 and 2002 (http://www.sailing.org/menu. asp?MenuID=tev‘GBv,zBpOvIJ9SuH8NX6/T‘b3EVKHi, XNEnGMSgr7UTWdXfjhTg5Rtj10cizf) but the data are recorded only every three hours (average hourly of the speed and the direction of the wind), so the database of the buoy was absolutely not significant. Nevertheless the Hellinikon Airport AWS have recorded the weather data in the August’s months between the 1990 and the 2000 every hours (average hourly of the speed and the direction of the wind).
It is evident that the crucial year is the 2000 as there are the contemporary measures of the buoy and the Hellenikon Airport AWS. It is possible to transpose the onshore database to the sea if the equations that link the onshore wind speed and direction to the offshore wind speed and direction are known with an acceptable correlation coefficient. By this way, it can work on a virtual database for the Olympic Games period and achieve to release the swing tables.
3.2 Transposition of the wind speed
The first effort was to research the equations that correlate the land-based wind data with the off-shore database. Therefore, using the theory of transposition (Hsu, 1988) and fixed the condition r2>0.6, it was obtained for the wind speed (Pezzoli and Dublanc, 2004b):
Usea=0.225 + 0.771Uland (2)
where the Usea is the wind speed in the sea at buoy position
and the Ulandis the wind speed in the land at Hellinikon
Air-port AWS. Obviously, this equation is valid as well in m/s as in knots (kts) and the correlation’s coefficient was r2=0.652. 3.3 Transposition of the wind direction
To transpose the wind direction the first objective was to gen-erate a model valid in each wind conditions. It was decided to divide the problem in two parts, depending on the direc-tion of the wind recorded in the Hellenikon Airport AWS. Two great weather patterns are clearly identified:
– the Etesian pattern, with a wind blowing from North. – The sea breeze pattern, with a wind blowing from
South.
These typical situations are explained in detail in the Sects. 2.1 and 2.2. For the Etesian pattern the wind recorded at Hellenikon Airport AWS was between 320◦ and 140◦; on the contrary for a wind between 140◦ and 320◦, the see breeze pattern was prevalent.
Besides it was founded a relation between the wind direc-tion onshore and offshore. It can assume that the difference between onshore and offshore direction counted in the clock-wise angle is function of the temperature gap between air and water (Hsu, 1988). The form of this equation was:
1θ = ζ + η1T (3)
where ζ , η are constant values to determine, 1T is the air-water temperature difference (◦C) and 1θ is the clockwise angle between over-land and over-sea winds (degrees). How-ever, when the temperature gap is above 5◦C, it is bound to bring some corrections by including a dependence of the off-shore wind speed:
1θ/1T = χ (Usea) (4)
where χ is a function, which must be found empirically. 3.3.1 Correlation of wind directions for the Etesian pattern Also in this case r2 is fixed as r2>0.6 to have an accept-able model to transpose the wind direction from the land to the sea. Analyzing the meteorological database, it was sub-divided the case when the 1T <5◦C and the 1T >5◦C. For a temperature gap under 5◦C, the model follows the theory
Table 1. Example of “swing table”.
12 Table 1. Example of “swing table”
Table 2. Forecast of the average wind direction and speed for the 16/08/2004 and measures of the buoys A, B and C in the Saroniko Gulf. hour forecast (RAMS and “swing table”) Buoy A Buoy B Buoy C
[LT] [◦/ms-1] [◦/ms-1] [◦/ms-1] [◦/ms-1] 37.9 N–23.65 W 37.88 N–23.7 W 37.82 N–23.7 W 09:00 350◦/4.633 014◦/6.528 006◦/8.145 356◦/7.734 10:00 355◦/5.148 350◦/5.156 019◦/7.734 008◦/8.086 11:00 000◦/5.662 021◦/8.034 028◦/9.785 016◦/8.906 12:00 000◦/6.178 023◦/9.258 022◦/12.129 020◦/10.020 13:00 010◦/7.722 026◦/8.437 016◦/10.020 011◦/8.906 14:00 015◦/9.781 015◦/6.898 018◦/9.375 008◦/8.262 15:00 017◦/10.296 008◦/9.855 020◦/11.367 004◦/9.844 16:00 016◦/9.781 016◦/9.699 013◦/8.906 013◦/9.961 17:00 015◦/8.236 025◦/11.459 018◦/9.961 010◦/8.730 18:00 005◦/6.178 015◦/8.005 005◦/9.668 001◦/8.730
(see Eq. 3) as it is obtained a linear relation with a coefficient of correlation r2=0.642, in the range of acceptability:
1θ = −72.585 + 16.6621T (5)
For a 1T >5◦C, in order to have a more reliable model, it
is subdividing the ranges of temperature and it is searched a first equation for 5<1T <8◦C and a second equation for
1T >8◦C, because it is noticed that in the Etesian pattern
1T may reach 12÷13◦C. Considering this subdivision, it is arrived a following results:
– 5<1T <8◦C:
1θ/1T = −2.187Usea2 +20.931Usea−47.146 (6)
with r2=0.957.
– 1T >8◦C:
1θ/1T = −0.0295Usea4 +0.746Usea3 −7.140Usea2
+28.701Usea−42.023 (7)
with r2=0.684, always in the range of acceptability. 3.3.2 Correlation of the wind directions for the sea breeze
pattern
As it is said in the Sect. 3.3, for a 1T <5◦C, it is searched for a linear model. It is obtained:
1θ = −53.37 + 9.9621T (8)
with an r2=0.945 which is a great result.
For 1T >5◦C, it should look for a velocity correction. The first results obtained were bad and it should look for another
192 A. Pezzoli: Etesian wind storms in the Saroniko Gulf
16 Figure 3. Forecast of the surface wind from RAMS model for the 12:00UTC (15:00LT) of the 16/08/2004 (courtesy: University of Athens).
Fig. 3. Forecast of the surface wind from RAMS model for the 12:00 UTC (15:00 LT) of the 16/08/2004 (courtesy: University of Athens).
empirical model since the model with velocity correction was not valid. At this point of the study, it was forced to pass upon the theory and try to find out a model that respects the best the values recorded by the Hellinikon Airport AWS and the buoy. It was managed to find out a dependence of the square of the gap of temperature, so the model for this case was:
1θ = −19.766 + 73.3281T − 8.4221T2 (9) with an amazing r2=0.999.
After to have transposed in the sea the database of Hellinikon Airport AWS using the equations determined in the Sects. 3.3.1 and 3.3.2, it was checked the results obtained in order to erase those who are unrealistic. To have a bet-ter overall view, it was bound to create a table for every year (1990–2000) in which was reported the unrealistic situations. These tables have in input the days, the hours of the August months and the transposed meteorological data; the aim of these tables is to provide an average rate of reliability, that is to say with which percentage the model of transposition is valid. In according to the results found in these reliability ta-bles, the model of transposition, represented by the Eqs. (5)– (9), gives “realistic” results with an average rate of 80%. It may assume that the equations established in the Sects. 3.3.1 and 3.3.2 is reliable, considering the complexity of the mete-orological phenomena in the Saroniko Gulf, so it is possible to affirm that also the new database build for the sea is valid. It is important to remember that the transposition’s equations obtained are valid for the August months.
3.4 The statistical model (the “swing table”)
The first step to build the “swing table” is to collect all the reliable data, from 1990 to 2000 during the August’s month,
of the virtual buoy (wind speed and direction) at h and h+1. Then a MATLAB program calculates all the changes in wind direction and speed between h to h+1. The result is a matrix in which appears the variation of the wind speed in the first column and the change of the wind direction in the second column. The number of the rows is equivalent to examined number of data.
Afterwards the relative frequency is calculated as:
frc =
n
N (10)
where n is the number of the cases of the variations in each considered class of wind speed and wind direction and N is the number of the examined data coincident with the rows of the above-mentioned matrix. The final results is the “swing table” that is a matrix 13 by 3, which represents 39 conditions of wind speed and direction (see the Table 1 for an example). Three conditions for the wind speed are considered:
– increase: from h to h+1, wind speed has won more than
1 knot.
– Steady: changes from h to h+1 remain between −1 knot
and 1 knot.
– Decrease: from h to h+1, wind speed has lost more than
1 knot.
For the direction, (calculated on the Geographic North), changes of 10◦are considered. Changes above 50◦and un-der −50◦ are in the rows shift right and shift left in grey. The numbers in bold and italic in the cells are the percentage of occurrence of one of the 39 wind conditions (equivalent to
frc×100). In red is the percentage of backing, between −50
17
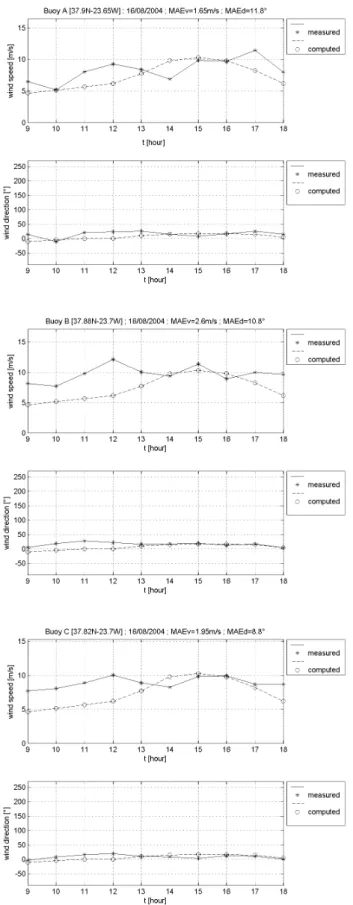
Figure 4. Comparison between forecasted (computed) and measured wind in the buoys.
Fig. 4. Comparison between forecasted (computed) and measured wind in the buoys.
and −10◦, and in green is the percentage of veering, between
10◦and 50◦; in yellow and orange, the situations which
hap-pen the most frequently. At last, the approximations have been made as follows: a change of 14.9◦ is counted like a change of 10◦. A change of 15.1◦is counted like a change of 20◦. The 15◦remain in the row change of 10◦.
This new concept of statistical model will help the fore-casters to issue the wind-warnings in the now-casting and short-term mode. Using the real-time measures of the shift of the wind direction, it will be possible with the “swing table” (see Table 1) to detect the probability to have of the variations of the wind speed.
3.5 The case studies: 16 August 2004
The 16 August 2004 the high pressure was positioned be-tween the Black Sea and the west zone of the Mediter-ranean Sea and a low pressure was located in the Turkey (http://www.wetterzentrale.de/topkarten/fsfaxsem.html). In the meso-scale analysis was possible to observe an high pres-sure in north of Aegean Sea and low prespres-sure in the south of Peloponnesian; this situation generated a strong flux from N in the Saroniko Gulf. In the same time with the passage in the morning of the instability line in Turkey and in the west of Peloponnesian were associated more Cumulus and Cumulonimbus clouds; the forecasted k index was equal to 30.8◦C and represented a convergence zone, this forecast was valid for the morning but not after 11:00 LT when the Ete-sian wind was fully developed in the Saroniko Gulf (see Ta-ble 2). The forecasted wind in upper atmosphere (925 hPa) was from 22◦ with a wind speed of 14.4 ms−1 that
con-firm the Mayenc¸on’s theory (see Sect. 2.3). Also the RAMS model (http://forecast.uoa.gr/) showed a day of Etesian wind with a forecast of the increasing of the wind speed between 13:00 LT and 14:00 LT (see Fig. 3); in effect the buoys have measured the strengthening of the wind after the 11:00 LT (see Table 2). Nevertheless the “swing table” model simu-lated well the increasing of the wind between 12:00 LT and 14:00 LT when, for an oscillating wind or for a veering, the probability to have an increasing of the wind was altogether equal to 24% (Pezzoli and Dublanc, 2004a). For the time interval included between 14:00 LT and 17:00 LT the same model showed us a good results: in effect the more higher values of the probability was for a steady wind in the direc-tion and in the speed. Finally between 17:00 LT and 18:00 LT the graphics, represented in the Fig. 4, showed us a backing and a decreasing of the wind; in this case the statistical model provided an 8% of probability to have the decreasing of the wind’s speed associated a the left shift as against the right shift that had the 5% of probability.
The good reliability of the forecast is demonstrated by the Mean Absolute Error, also called MAE (Wilks, 1995), which is included between 1.65 ms−1 and 2.6 ms−1 for the wind speed and between 8.8◦and 11.8◦for the wind direction. The maximum MAE of the wind speed is in the Buoy B, but this error is lower than 30% in comparison with the average of the measured wind speed.
194 A. Pezzoli: Etesian wind storms in the Saroniko Gulf
4 Conclusion
In conclusion it can affirm that the methodology proposed in this research to issue the forecast is reliable. It is im-portant to consider that all the three methods (weather pat-terns, “swing table” with the probability of occurrence and atmospheric models) have to be used contemporary to pre-pare a forecast with the best skill. Finally it can affirm that these three methods are statistical (weather patterns and “swing-table”) and deterministic (atmospheric models) and they merge in the unique model called “mixed statistical-deterministic”. Therefore the forecast is written with the “Reliability Index” that shows the probability of occurrence of the same forecast; this index is used as decision-maker to build the economic estimation of the weather forecast (Pez-zoli and Franza, 2003).
Acknowledgements. The author thanks the Hellenic National
Meteorological Service and the University of Athens (Atmospheric Modeling and Weather Forecasting Group) to have provided the measured data from the buoys and the results of RAMS model. Special acknowledgements to the Austrian Sailing Federation for its funding of this research.
Edited by: L. Ferraris
Reviewed by: R. Crapolicchio and another referee
References
AA.VV.: Handbook of Weather and Climate, Wiley Interscience, New Jersey, 2003.
Burroughs, W. J. and Lynagh, N.: Maritime weather and climate, Witherby, London, 1999.
George, J. J.: Weather forecasting for aeronautics, Academic Press, New York, 1960.
Hand, W. H., Neil, I. F., and Collier, C. G.: A study of twentieth-century extreme rainfall events in the United Kingdom with im-plications for forecasting, Met. Appl., 11, 15–31, 2004. Hsu, S. A.: Coastal meteorology, Academic Press, London, 1988. Mayenc¸on, R.: Jeux Olympiques – Ath`enes 2004, MetMar, 202,
6–9, 2004.
Molyneux, M.: Giving sailors the odds – probabilities in meteo-rological advice, Proceedings of the Conference “Weather and Sailing”, Abstract-No. 11, Southampton, 2003.
Pezzoli, A. and Dublanc, B.: Analysis of the swing table in the Saroniko Gulf for the Olympic Games, Athens 2004 – Technical Report n.3, Politecnico di Torino, Turin, 2004a.
Pezzoli, A. and Dublanc, B.: Building of an off-shore database of wind conditions for the Saroniko Gulf by transposition and mod-els of swing tables for the Austrian Sailing Federation, involved in Athens 2004 Olympic Games – Technical Report n.4, Politec-nico di Torino, Turin, 2004b.
Pezzoli, A. and Franza, M.: Rainfall forecasting intropical-equatorial environments: a case study of the Seychelles zone, Met. Appl., 10, 101–110, 2003.
Pielke, R. A.: Mesoscale meteorological modeling, Academic Press, San Diego, 2002.
Rudari, R., Entekabi, D., and Roth, G.: Synoptic control on regional intense rainfall events in the Mediterranean area, Proceedings of the 1st CNR-Princeton Workshop of “New Frontier in Hydrol-ogy”, 105–112, Princeton USA, 2002.
Wilks, S. D.: Statistical methods in the atmospheric sciences, Aca-demic Press, London, 1995.