HAL Id: hal-03234923
https://hal.archives-ouvertes.fr/hal-03234923
Submitted on 26 May 2021
HAL is a multi-disciplinary open access
archive for the deposit and dissemination of
sci-entific research documents, whether they are
pub-lished or not. The documents may come from
teaching and research institutions in France or
abroad, or from public or private research centers.
L’archive ouverte pluridisciplinaire HAL, est
destinée au dépôt et à la diffusion de documents
scientifiques de niveau recherche, publiés ou non,
émanant des établissements d’enseignement et de
recherche français ou étrangers, des laboratoires
publics ou privés.
Distributed under a Creative Commons Attribution - NonCommercial - NoDerivatives| 4.0
International License
Rainfall-discharge relationship and water balance over
the past 60 years within the Chari-Logone sub-basins,
Lake Chad basin
A. Mahamat Nour, C. Vallet-coulomb, J. Gonçalves, F. Sylvestre, P.
Deschamps
To cite this version:
A. Mahamat Nour, C. Vallet-coulomb, J. Gonçalves, F. Sylvestre, P. Deschamps.
Rainfall-discharge relationship and water balance over the past 60 years within the Chari-Logone
sub-basins, Lake Chad basin. Journal of Hydrology: Regional Studies, Elsevier, 2021, 35, pp.100824.
�10.1016/j.ejrh.2021.100824�. �hal-03234923�
Journal of Hydrology: Regional Studies 35 (2021) 100824
Available online 6 May 2021
2214-5818/© 2021 The Authors. Published by Elsevier B.V. This is an open access article under the CC BY-NC-ND license
(http://creativecommons.org/licenses/by-nc-nd/4.0/).
Rainfall-discharge relationship and water balance over the past 60
years within the Chari-Logone sub-basins, Lake Chad basin
A. Mahamat Nour
a,b,*
, C. Vallet-Coulomb
b, J. Gonçalves
b, F. Sylvestre
b,
P. Deschamps
baUniversity of N’Djamena- Laboratoire HydroGéosciences et Réservoirs, N’Djamena, Chad bAix Marseille Univ, CNRS, IRD, INRAE, Coll France, CEREGE, Aix-en-Provence, France
A R T I C L E I N F O
Keywords:
Lake Chad Chari-logone Hydrological Climate and variability
A B S T R A C T
Study Region: Chari-Logone River basin, Lake Chad basin.
Study Focus: The objective of this study was to better understand the hydrological functioning of
the Chari-Logone basin under the effect of the high variability of rainfall which has affected the Sahel during the last sixty years. The study is based on hydro-climatic data for the period between 1960 and 2015 obtained from the national and international institutions. This work based on the following steps: 1) Average hydrological balances were estimated for different geographical areas, to identify the most productive parts of the basin. 2) The rainfall-runoff relation was compared for the wettest and driest decades of the study period, to identify the areas that contribute most to the amplification of the hydrological response to variations in rainfall. 3) The long-term period sta-bility of the rainfall-runoff relation was evaluated for climatic conditions close to the average situation, in order to detect potential evidence of the anthropogenic impact.
New Hydrologic Insights for the Region: During the period 1960–2015, the average water flow in the
Chari-Logone basin (42 mm/year) represented only 5% of precipitation. Between the two climatically most contrasted wet (1960− 1971) and dry (1982− 1997) periods, the average flow differed by 75 % against a decrease of 15 % of precipitation. Our hydroclimatic data show no clearly detectable evidence of an anthropogenic impact responsible for a decrease in flows or a modification of the hydrological regime in the Chari-Logone basin.
1. Introduction
Since the middle of the last century, the Lake Chad basin has experienced a high variability in rainfall (Fourissala and Gormo, 2012;
Lavergne, 2017) with consequently a huge variability in the level and extent of Lake Chad (Olivry et al., 1996; Lemoalle et al., 2012). After a wet phase between the 1950s and the 1960s, Lake Chad experienced dramatic dry conditions which decreased the extent of the lake by over tenfold. Since the beginning of the 1990s, rainfall has slowly increased, affected by a strong interannual variability,
inducing a recovery of the lake (Pham-Duc et al., 2020). Whereas climate changes are thought to be one of the main factors explaining
the variability of the level of the lake, the impact of the increase in human activities is still debated (Coe and Foley, 2001; Gao et al.,
2011; Zhu et al., 2019a, 2019b).
While human activities have had an undeniable impact on the runoff and flow of rivers in the Sahelo-Sudanian region, it is rather
* Corresponding author at: University of N’Djamena- Laboratoire HydroGéosciences et Réservoirs, N’Djamena, Chad.
E-mail address: [email protected] (A. Mahamat Nour).
Contents lists available at ScienceDirect
Journal of Hydrology: Regional Studies
journal homepage: www.elsevier.com/locate/ejrh
https://doi.org/10.1016/j.ejrh.2021.100824
Journal of Hydrology: Regional Studies 35 (2021) 100824
2
through the change in land use linked to deforestation and land clearing (Leblanc et al., 2006; Descroix et al., 2009), most often
resulting in an increase in flows despite the overall decrease in precipitation in the Sahelian zone and a more contrasted response in the
Sudanian zone (Descroix et al., 2009; Gal et al., 2017). The decrease in precipitation observed throughout the Sahel region during the
1970s and the 1980s is undeniable, and it is important to provide quantitative information on the response of flows within the Lake Chad basin to these variations in precipitation in order to estimate the respective roles of human activities and climate change.
Based on the analysis of hydroclimatic data series, an initial quantification suggested that when the rainfall in the basin varies by 10
%, the flow of the Chari varies by around 30 % (Descroix et al., 2009; Lemoalle et al., 2012; Gal et al., 2017). Other studies have sought
to assess this relationship using rainfall-runoff modeling (Vuillaume, 1981; Ardoin-Bardin et al., 2009; Gonçalv`es et al., 2020). One of
the major difficulties encountered by this work remains the limited and incomplete nature of long-term hydro-climatic data in the region. In addition, the logistical and technical constraints and the Sahelian context make it difficult to establish or update robust gauging curves. Therefore, it is important to take into account the unavoidable uncertainties associated with river discharge data. A robust quantification of the relationship between climate variability and runoff within the Chari-Logone basin, as well as the associated uncertainties, remains necessary.
Zhu et al., 2019a, 2019b conducted a study to assess the relative contribution of human activities and climate variability on water
loss from the flow of the Chari-Logone River using a conceptual and statistical approach. Mahmood and Jia (2019) used a hydrological
approach to determine hydro-climatic changes in the active parts of the Lake Chad basin using an analysis of trends and causes of the decline in stream flow to Lake Chad due to human interventions and climate variability. Some of these studies point to the prepon-derant impact of human activities, and in particular an increase in abstraction mainly for irrigation purposes compared to that of climate variability, to explain the overall drop in lake level observed in recent decades. However, this work assumes more than the existence of a significant increase in water withdrawals in the Chari-Logone basin. A rainfall-runoff model calibrated in humid climatic
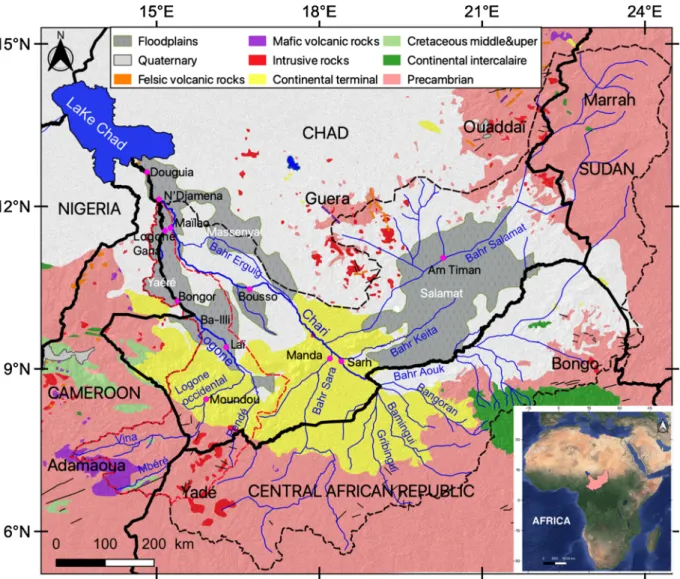
Fig. 1. Geological map of the Chari-Logone basin (Louis, 1970). The black dotted line represents the boundary of the Chari-Logone basin and the
red dotted line the boundary of the Logone basin.
conditions is difficult to transpose to different climatic conditions. Given the importance of climatic and hydrological variations in this system, a thorough analysis of the data is essential.
Central questions that we must adress here are: is the hydrological variability of Lake Chad and its Chari-Logone system attributable to climate change and / or human activities? Has this hydrological variability led to a change in the behavior and functioning of the Chari-le Logone system?
The objective of this work was to better understand the sensitivity of the hydrological functioning of the Chari-Logone basin to rainfall fluctuations and to identify the potential impact of anthropogenic factors. The analysis of the relationship between the rainfall drought observed since 1970 and the hydrological drought in recent decades is a key element in assessing the vulnerability of the water resource within the Chari-Logone basin, but also throughout the region and the sub-regions whose economy depends largely on Lake Chad and these variations.
Like most lakes located in a hydrologically closed drainage system, the fluctuation of Lake Chad is directly related to the influx of rivers which varies according to the hydrological water budget in the basin. The various studies carried out on the hydrological balance
of Lake Chad (Olivry et al., 1996; Bader et al., 2011; Bouchez et al., 2016) have shown that its water comes mainly from the
Chari-Logone system (more than 82 %, supplemented by direct precipitation (14 %) on the lake and less significant contributions from
El Beid (Ya´er´e outlet) and Komadougu Yobe (Lemoalle et al., 2012). Lake Chad is therefore highly dependent on water fluxes in the
Chari-Logone basin, located in the southern part of the Lake Chad basin, which constitutes the main hydrologically active area of the
basin (Bouchez et al., 2019; Gonçalv`es et al., 2020). A detailed understanding of the variability of Lake Chad requires understanding
the response of flows within the Chari-Logone basin to variations in precipitation. This is essential for estimating the respective roles of climate change and human activities in the recent and future evolution of Lake Chad.
The analysis of spatial and temporal variations of the water balance in the Chari-Logone basin presented herein followed different steps: 1) Average hydrological balances were estimated for different geographical areas, to identify the most productive parts of the basin in terms of surface runoff, and the potential groundwater recharge areas. The spatial analysis was based on different sub-basins, treated separately for upper catchment and downstream areas; 2) The rainfall-runoff relation was compared for the wettest and driest decades of the study period, to identify the areas that contribute most to the amplification of the hydrological response to variations in rainfall; 3) The long-term period stability of the rainfall-runoff relation was evaluated for climatic conditions close to the average situation, in order to detect potential evidence of the anthropogenic impact.
For this purpose, reference sub-basins were determined and associated spatial precipitation and runoff estimated. The reference periods were defined and the water balance parameters to be used for the analysis were identified.
2. Study area description 2.1. Geological context
The Chari-Logone basin (BCL) is the hydrologically active part of the Lake Chad basin. It covers an area of 613,000 km2, and its
borders are surrounded by a set of mountain ranges: Guera (North), Ouaddaï (East), Central African (South) and Adamaoua (South-
West) ranges. (Fig. 1). The geological formations consist mainly of the outcropping Precambrian basement (mainly represented by
granites and metamorphic rocks) and the sedimentary series of the Tertiary (sandstone formation of the Continental Terminal) and of
the Quaternary (fluvial or fluvio-lacustrine formations) (Louis, 1970). The Quaternary and the Continental Terminal are the main
sedimentary aquifer systems in the area (Schneider and Wolf, 1992). Groundwater also circulates in the hard rocks of the Precambrian
basement supporting the base flow in the upper part of the Chari-Logone (Bouchez et al., 2019, Gonçalves et al., 2020).
2.2. Climate and hydrology
The climate of the Chari-Logone basin is characterized by the confluence of two air masses: the dry northeastern harmattan of continental origin and the humid southwestern monsoon of oceanic origin. The basin is contrasted from the Sudanese climate in the south to the semi-arid climate in the north. The climate is tropical with two seasons a dry season and a wet season. The rainy season begins in May and ends in October and most of the precipitation falls in July and August. Annual precipitation was 970 mm and 550 mm respectively in Sarh and N’Djamena, between 1984 and 2014. Evaporation rates show a strong seasonal cycle following the air
temperature cycle (Mahamat Nour, 2019). The Chari and the Logone are the two main rivers in the Chari-Logone basin. The Chari
originates in the Central African Republic at an altitude of between 500 and 600 m. The Logone starts on the Adamawa plateau in
Cameroon, with an altitude ranging from 305 to 835 m (Cabot, 1965; Gac, 1980). The confluence of the Chari and Logone rivers is
located in N’Djamena, 110 km upstream from Lake Chad, (Fig. 1). The Chari-Logone receives groundwater from the upper basin of the
Precambrian basement (Gonçalv`es et al., 2020) while in the lower part, water from the Chari-Logone flows from the river to the
Quaternary aquifer (Bouchez et al., 2019).
Flood-prone areas give rise to rich ecosystems supporting biodiversity and key economic activities such as fishing, breeding and agriculture. In addition to regional importance, these flood zones are of international importance in ecology, botany, zoology,
hy-drology and are recognized as Ramsar sites (Vassolo et al., 2016).
At the height of the discharge, the Logone and the Chari flood the surrounding plains with their discharges (Olivry et al., 1996;
Nkiaka et al., 2018). The flood plains of the Chari-Logone basin are of particular importance in contributing to the renewal of
groundwater in the basin (Seeber et al., 2014). Recent studies by LCBC-BGR (Vassolo et al., 2016) showed that aquifer recharge comes
Journal of Hydrology: Regional Studies 35 (2021) 100824 4 Table 1
Selected flow measurement stations and coordinates (WGS 84 projection system) for the period 1960-2007.
N◦ Station River DRE reference code
Coordonates (projection: WGS
84) Area (km2) Inter annuel average (m3/s) Gap (1960− 2007) Gap (2000− 2016) Estimed uncertainty (%)
Lat Long Alt (m)
1 Moundou Logone 1,460,300,172 8.56 16.08 393 33,000 319 10 % – 10 % 2 Manda Chari 1,460,201,903 9.18 18.2 362 80,000 348 21% – 20 % 3 Sarh Chari 1,460,200,118 9.15 18.41 355 194,000 178 8% 3% 20 % 4 Bongor Logone 1,460,300,112 10.26 15.41 321 72,000 396 35 % 17 % 20 % 5 Bousso Chari 1,460,200,106 10.5 16.71 325 475,000 576 27% – 20 % 6 Logone-Gana Logone 1,460,300,163 11.55 15.15 295 89,000 293 17 % – 20 % 6 bis Ngueli Logone 1,460,300,164 1206 1505 294 90,000 230 – 59 % 10 % 7 Mailao Chari 1,460,200,133 11.6 15.28 294 510,000 543 4% – 10 % 7 bis Chagoua Chari 1,460,200,109 1208 1508 290 523,000 500 – 24 % 10 % 8 N’Djamena Chari-Logone 1,460,200,121 12.11 15.03 286 613,000 918 15 % 11 % 10 % A. Mahamat Nour et al.
particular by constituting large areas of evaporation and having a potential impact on water chemistry (Lienou, 2007; Delclaux et al., 2011; Seeber et al., 2014; Lemoalle et al., 2014). The precipitation over these flooded plains does not compensate for the net loss by
evaporation. The area of the flood plains is variable and depends on the amount of rainfall that has fallen on the basin (Jung et al.,
2011; Vassolo et al., 2016). The main flood plains of the Chari-Logone basin are (Fig. 1):
- The Yaer´e plain: The Yaer´e is a floodplain in northern Cameroon. This plain is flooded by rains and overflows from the Logone. The accumulated water is taken up by the evapotranspiration effect. The average extent of flooded surface between 2000 and 2014 was
2767 km2 (Vassolo et al., 2016).
- The Massenya plain: The Bahr Erguig, partially silted up, is a defluent that occasionally feeds the floodplain of Massenya. - The Salamat plain (Am Timan): The Bahr Salamat sub-basin forms more or less temporary marshes and floods a depression 20 km
long. In wet periods, the floodplains of Salamat are very largely flooded, with the exception of the sandy ridges.
- The Logone loses water along its right bank from Ba-Illi to Bongor towards the large plain drained by the Ba-Illi and other secondary
depressions (Fig. 1). Further north, at Bongor, the Logone loses water through its left bank towards the Ya´er´e (Bouchardeau and
Lefevre, 1957).
3. Data acquisition 3.1. Precipitation
Several types of precipitation datasets are available for the Lake Chad basin. The Chari-Logone basin is shared between 4 countries: Cameroon, the Central African Republic, Sudan and Chad. The acquisition and management of rainfall data on each national territory are managed by the relevant services of each country.
In Chad, the General Directorate of National Meteorology (DGMN) of the Ministry of Civil Aviation and Meteorology is in charge of all available stations and datasets in the country. Most of these stations were installed during the colonial period by researchers from the Overseas Scientific and Technical Research Office (ORSTOM), an organization now replaced by the IRD (Research Institute for Development) and the Agency for the Safety of Air Navigation in Africa and Madagascar (ASECNA). They are still mostly functional despite some periods of interruption linked in particular to the civil war in Chad and the sub-region at the end of the 1980s.
The climate division of the DGMN provided us with monthly data from 1960 to 2015 at 12 meteorological stations (rainfall) within and around the Chari-Logone basin. A systematic quality control was carried out on the raw data to remove or correct obvious outliers. We were unable to obtain data from the national networks of the Cameroonian, Central African and Sudanese parts.
The database was completed with monthly interannual averages obtained from two monographs published by the ORSTOM
Institute, providing information on the Chari basin (Billon et al., 1968) with 74 precipitation stations covering periods of 6–27 years
between 1940 and 1967, and on the Logone basin (Cabot, 1965) with 27 stations covering 4–22 years between 1934 and 1956. A total
of 89 referenced stations were available (since 12 stations were referred to in common by the two monographs). We also used reanalysis data from the Climate Research Unit (CRU), University of East Anglia, Norwich, UK and the UK Department for
Environ-ment, Transport and Regions. These are interpolated with actual monthly precipitation since 1900, at a grid resolution of 0.5◦in
latitude and longitude. The method of processing precipitation in grids is described in the work of Hulme et al. (1995) and Jones and
Hulme (1996). Data for version CRU TS 4.02 are available on the website https://crudata.uea.ac.uk/cru/data/hrg/ described by Harris et al. (2014). These data were used for comparison with our interpolated and reconstructed data and therefore for validation our method of processing precipitation data.
3.2. River discharge
A large hydrometric database is available at the LCBC (Lake Chad Basin commission). These data, which initially come from the Chadian national network of the Water Resources Department (DRE), were processed within the framework of the "Integrated
Management Program of Transboundary Basin Resources in Africa - Lake Chad Basin Component" (Chenevey, 2011). The main
ac-tivities of the project were to collect hydrometeorological data, improve the measurement network and to correct the gaps (Efstratiadis
et al., 2013). The origin of the data, their processing, the types of models, the input and calibration parameters as well as the
reconstruction method are all detailed in a report by the LCBC and the 9th FED (European development fund; Verdonck, 2011). This
database includes monthly river discharges from 30 hydrometric stations of the Chari-Logone basin covering different periods between
1950 and 2007. Based on the quantity of data, 8 stations were selected and used in the present study (Table 1).
For the period 2000–2016, we obtained from the (DRE) daily river discharge data for five stations (Table 1): two on the Chari (“3”
and “7bis” stations), two on the Logone (stations “4” and “6bis”) and one on the Chari-Logone (“8”).
3.3. Data quality and reconstruction of missing flow data
A systematic data quality verification was performed on the raw data to ensure the reliability of the series. It is important to note that observations were interrupted on most of the measuring stations during 1980 and 1981, during the period of civil war, except on the stations of Mailao, Logone Gana and Moundou. After the measurement interruption, most of the stations were put back into service: the limnimetric scales were repositioned when necessary and for each station a new gauging curve was established. An exhaustive
Journal of Hydrology: Regional Studies 35 (2021) 100824
6
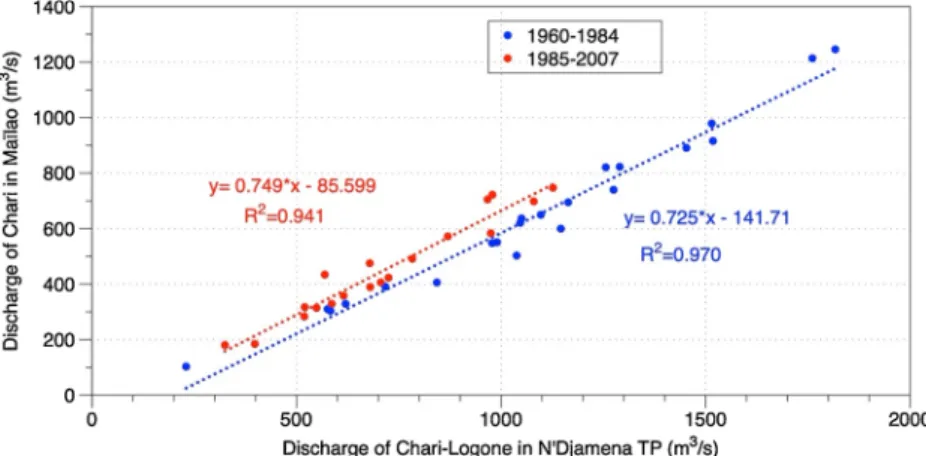
series analysis evidenced an overall shift between the data from the Maïlao station and those from N’Djamena TP (Fig. 2). As the
N’Djamena TP station is believed not to have undergone any scale modification or derating after years of disruption, this suggests an inconsistency at the Maïlao station. The latter was not interrupted but underwent a displacement of scale. Indeed, despite the
continuous record at the Maïlao station, a 1-meter scale shift was performed in 1985, as reported by Nelngar (1989), followed by the
establishment of a new gauging curve. The two gauging curves for the Maïlao station are parallel to each other, but the offset is slightly less than 1 m. The comparison of flows at Maïlao and N’Djamena TP shows two robust and parallel linear correlations. Based on the
difference in the y-intercept, the offset is estimated to be around 100 m3/s. To understand whether the shift is explained by an
un-derestimation of river discharge values at Maïlao before 1985, or if recent flows are overestimated, we compared the monthly data from Maïlao with the daily data from the Chagoua station located 59 km downstream from Maïlao for the Chari, for the common period from 2000 to 2007. The two datasets were found to be consistent except during the low water period. Based on this criterion, we
conclude that there was an underestimation of 100 m3/s for the Maïlao data before 1985. This underestimation was taken into account
in our analysis.
Many gaps remain in addition to the 1980–1981 war period. Where possible, we have reconstructed the data in order to make the best use of the information available without introducing too much uncertainty.
For the monthly data, a normalized average flow regime was established based on a coefficient (ki) calculated for a month i from the
monthly interannual average (1950–2007):
ki=
Qi
Qmax (1)
where Qi is the interannual average flow of month i and Qmax the interannual maximum flow (value for the month of October). Except
for the maximum flood period (September, October and November) the missing data corresponding to the month i of a given year n were replaced by:
Qi,n=ki∗Qmax,n. (2)
This method makes it possible not to eliminate incomplete years when the gaps correspond to periods of low water, which have little impact on the robustness of the annual average.
For the daily time step, missing data were replaced when corresponding to a period of unequivocal variation in flows, either ascending or descending, by assuming a continuous and linear variation in flows. Linear interpolation in this way was used to fill some gaps in the daily flow series (period 2000–2016).
The percentages of missing data are displayed in Table 1, with an evaluation of discharge uncertainties based on the analysis of
gauging curves and all available information.
4. Method
4.1. Delineation of sub-basins
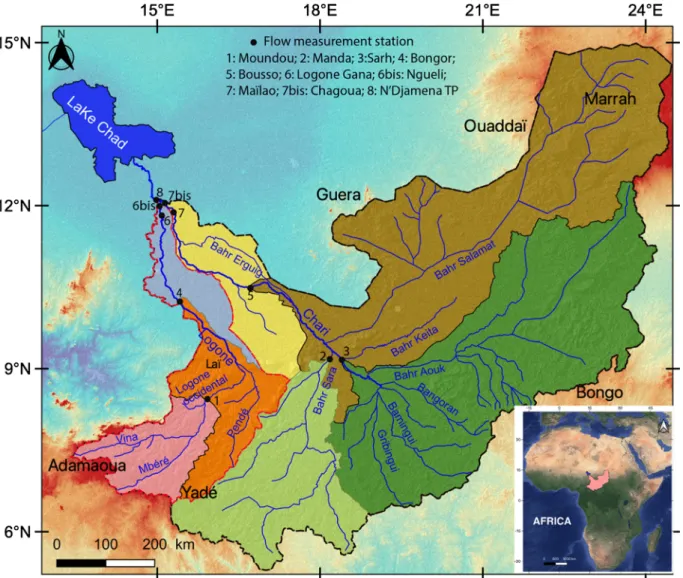
Based on available river discharge time series, eight sub-basins were delineated (Fig. 3). The SRTM topo 30 data were used for the
DEM and the delimitation of sub-basins with the QGIS 3.4.5 software. These contours are similar to the limits of the sub-basins
identified in the monographs by Billon et al. (1968) and Cabot (1965). The main characteristics of these zones are described in
Table 2. It should be noted that a large part of the zone is flat, and the surfaces of the flood zones can overflow into neighboring basins
(see description of the floodplains in section 2.2.).
Fig. 2. Comparison of flow data from the Maïlao vs N’Djamena station for two periods (1960-1978 and 1982-2007).
4.2. Spatial precipitation estimates
As described previously, 12 precipitation time series were available in the Chadian part of the Chari-Logone basin between 1950 and 2015. Therefore, the spatial distribution of precipitation was more robustly estimated from the dense data network available for
the average 1940–1960 period (Billon et al., 1968; Cabot, 1965), which also included the 12 stations available between 1950 and
2015. The spatial interpolation was performed using a kriging method (Nkiaka et al., 2017; Mahamat Nour et al., 2019). Kriging
interpolation of precipitation data from rainfall measurement stations is carried out using the gstat package of the "R" software. Semi-variograms constructed with raw data show no range. When no still is identifiable, it is recommended to work on the residuals (Goovaerts, 2000; Snepvangers et al., 2003), which represent the difference between the variable and a surface, for example a plane
Fig. 3. Sub-basin of the Chari-Logone system (data SRTM (Shuttle Radar Topography topo 30). Table 2
Characteristics of sub-basins.
Basin Area (km2) Hydrological context Station used to estimate runoff
Moundou 33,000 Sudanian climate, fractured aquifer 80 % #1 Manda 80,000 Sudanian climate, fractured aquifer 50 %, sedimentary aquifer 50 % #2 Sarh 194,000 Sudano-sahelian climate, fractured aquifer 20 %, sedimentary aquifer 80 % #3 Laï 38,000 Sudano-sahelian climate, fractured aquifer 20 %, sedimentary aquifer 80 % #1, 4 Bahr Salamat 201,000 Sahelian climate, fractured aquifer 20 %, sedimentary aquifer 80 % #2, 3, 5 Ya´er´e 20,000 Sahelian climate, sedimentary aquifer 100 %, flood area (15 %) #4, 6 Massenya 40,000 Sahelian climate, sedimentary aquifer 100 %, flood area (10–40 %) #5, 7
Journal of Hydrology: Regional Studies 35 (2021) 100824
8
determined by the adjustment of the data considered by a least squares method (Séraphin, 2016). Thus, this method makes it possible
to subtract the linear trends from the rainfall data which result from the latitudinal or continental effects, in order to interpret only the purely stochastic signal, i.e the local variations in rainfall. For the analysis of the anisotropy of the rainfall distribution, we established
the directional variograms in the four directions (0◦, 45◦, 90◦and 135◦). Examination of the variogram surface of the residuals
ob-tained from rainfall data shows still, thus making it possible to adjust classical variogram models. The models and parameters used are
given in Table 3.
The interpolation was done on 89 rainfall stations, and the mesh chosen was a regular grid with a 0.1◦spacing.
The average 1940–1960 precipitation was determined as a reference value for each sub-basin i from the interpolated map (Pi,ref).
Then, the average precipitation of a given year n was compared to the reference period using a coefficient kn defined as follows:
kn=
Pn
Pref (3)
where Pn and Pref correspond to the annual average rainfall at the 12 stations for the year n, and the reference period 1940–1960,
respectively. Finally, assuming a stable spatial distribution of precipitation over time, the variations of spatial precipitation over a sub- basin i during the year n were calculated for 1960–2015 with:
Pi,n=knPi,ref (4)
4.3. Determination of reference periods
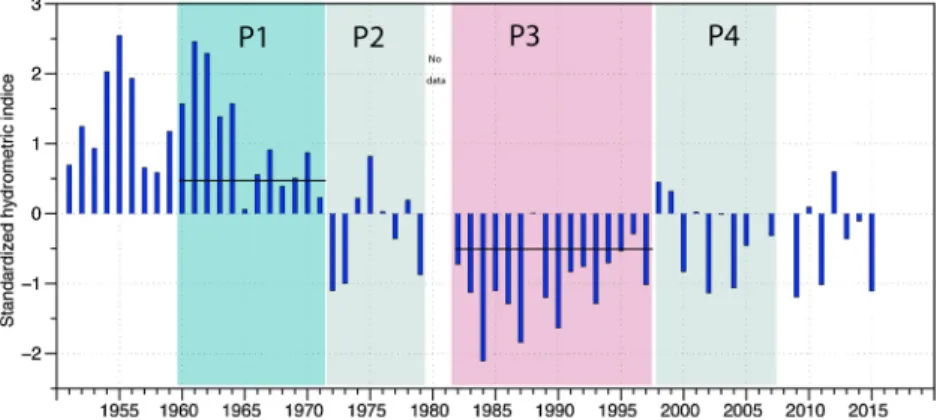
The definition of reference periods was based on the standardized index of annual river discharge measured at the outlet of the Chari-Logone basin (Station #8), which is a robust integrator of the water balance at the catchment scale. The standardized index (McKee et al., 1993) provides the deviation from a long-term average, and can be translated into wet or dry episodes, when the index is
greater than 0.5 or lower than -0.5, following the criteria proposed by Balme et al. (2006). The standardized index was calculated for
hydrological years (May to April) over the 1950–2015 period, following:
I =Di− D
σ (5)
with Di the average discharge for year i, D the interannual mean, σ the standard deviation of the interannual discharge.
The interannual variability of flows in the Chari-Logone basin shows the non-stationarity of the hydrometric evolution from 1950 to 2015, with a general downward trend since the 1950s followed by a slight increase since 1998. The Chari-Logone discharge
temporal evolution is consistent with what has been observed in most of the work on the evolution of the level of Lake Chad (Bader
et al., 2011; Lemoalle et al., 2012; Bouchez et al., 2016; Ndehedehe et al., 2016; Pham-Duc et al., 2020) and the rainfall regime in the
African sub-region (Hubert et al., 1989; Koumassi, 2014; Mah´e et al., 2013; Mah´e and Olivry, 1995; Nkiaka et al., 2017; Paturel et al.,
1995; Vissin, 2007).
Taking into account the temporal coverage of precipitation data (from 1960) and the availability of monthly discharge data for the
8 reference sub-watersheds (until 2007), we chose the following reference periods (Fig. 4):
- Wet period P1 from 1960 to 1971, corresponding to successive years represented by positive indices: 8 out of 12 years have indices greater than 0.5 with an average of 1.07;
- Intermediate period P2 from 1972 to 1979, comprising 8 consecutive years with a zero average index, although with substantial interannual variations;
- Dry period P3 from 1982 to 1997, characterized by globally negative indices (13 out of 15 years have indices less than -0.5 with an average of -1.03);
- Period P4 from 1998 to 2007 can be considered as an intermediate period of 10 years with an average index of -0.33. The indices are distributed evenly on either side of the zero on the x-axis.
4.4. Water balance analysis
The annual water balance of a sub-basin can be written as follows:
P – ET = Q (6) with P the precipitation, Q the total flow (R = Q/A, mm/year, A is the area), ET and the evapotranspiration.
For the upstream sub-basins (Moundou, Manda, Sahr), Q = Qout, while for intermediate sub-basins, which already receive flow from
Table 3
Parameters of calibration and models of semi variograms.
Parameters Model Threshold Scope Nugget effect Variance
Caracteristics Spherical 7800 3 3500 10550.15
upstream, the value of Q can be negative. In the case of the Salamat basin, which is a non-permanent tributary of the Chari River characterized by an unstable riverbed, no gauging station exists. Nevertheless, the net flow was estimated as a difference between the total Chari discharge upstream (stations #2 and #3) and downstream (station #5) of the mouth of the Bahr Salamat into the Chari River. When calculated from several stations, the uncertainty on the net flow was estimated from the combined uncertainties of all the stations used.
Our analysis was based on the comparison of water slide (Q/A), flow coefficient (Q/P) and flow deficits (P – Q), which corresponds to the sum of the losses by evapotranspiration and infiltration (ET + I). In addition, the time variations of the rainfall-flow relation will be discussed on the basis of a “runoff elasticity to rainfall" coefficient to evaluate the amplified response of runoff to the variations of
precipitation. The coefficient is defined as follows (Sankarasubramanian et al., 2001; Chiew et al., 2006):
ε=ΔQ Q / ΔP P (7) Fig. 4. Standardized hydrometric indices of the Chari-Logone river in N’Djamena TP. Annual average values are calculated for the hydrologic year
from May to April.
Fig. 5. Spatial distribution of average precipitation (mm) for the period 1940-1960 in the Chari-Logone basin and location of the 89 rainfall stations
Journal of Hydrology: Regional Studies 35 (2021) 100824
10
5. Results and discussion
5.1. Spatial variations in the Chari-Logone basin 5.1.1. Precipitation
The analysis of Fig. 5 shows that the distribution of average precipitation (1940–1960) follows a south-north gradient typical of the
Sudano-Sahelian region. The highest values are recorded at the southwestern part of the catchment and correspond to the direction of the monsoon flow into the basin, combined with a slight orographic effect (1000 m altitude on average). Rainfall amounts vary from 800 to 1600 mm/year in Sudanese regions, which are more humid in the southwest, and from 200 to 800 mm/year in the Sahelian regions, the minimum occurring in the northeast part of the catchment, corresponding to the upper Salamat sub-basin.
5.1.2. Upper catchments water balance
For the whole catchment, the discharge represents only 5% of precipitation. However, the runoff ratios and flow deficits present
particularly contrasted values (Table 4). Most of the Chari-Logone flow (92 %) in N’Djamena TP is recorded in the 3 main upper
catchments: Manda (38 %), Moudou (35 %) and Sahr (19 %, see Fig. 3 for locations). Among them, the highest runoff ratio (0.24) is
found in the Moundou basin, and the lowest in the Sahr basin (0.03). Therefore, although it includes the source region of the Chari and the upstream part of the eponymous river, the Sahr basin corresponds to a strongly arid context and weakly contributes to the Chari-
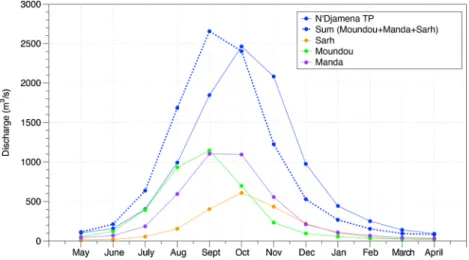
Logone flow. The mean hydrological regime of the Chari-Logone River (Fig. 6) shows that the river discharge presents a one-month
delay compared to the sum of the 3 main upper catchment contributions. The rise of the discharge curve is faster for the Moundou
basin, followed by the Manda, and then the Sahr basins (Fig. 6).
The contribution of the Salamat basin is intermittent and poorly determined because of the cumulated uncertainties associated to the indirect estimate. The Bahr Salamat basin, located in the Sahelian belt, is almost endorheic and water is mainly lost by evaporation
in temporally flooded areas (Fig. 1). Except during humid periods (which will be discussed later), its average contribution can be
considered as negligible compared to that of the other 3 upper basins.
It is interesting to note that there is a significant difference in the runoff values between the neighboring Moundou and Manda sub- basins. This difference cannot be attributed to climate since annual precipitation is similar. The flow coefficients are very different: 24 and 11 % for the upstream Logone (upper Logone) and the Bahr Sara respectively. This difference could be explained by the geological context: Moundou is made up of approximately 90 % of basement, while Manda is shared between basement and the outcrop of the
Continental Terminal CT (26 % of the surface of this sub-basin, Fig. 1). It is therefore possible that a higher recharge in the CT
(Gonçalv`es et al., 2020) and therefore a larger contribution to river baseflow than in the Moundou sub-basin could explain the lower discharge value of the Moundou sub-basin.
5.1.3. Water balance in the downstream sub-basins
Downstream to these upper catchments, the net flow acquired in the Laï basin is largely compensated by the deficit observed in the
Ya´er´e flood zone (Fig. 7). The Massenya basin in the downstream part of the Chari has a slightly negative average balance, although
associated to a large uncertainty.
During the maximum flood, the Chari and the Logone overflow of the plain Bongor Ba-Illi, between Bousso and Bongor and feeds the wide Ya´er´e floodplains. The water losses affecting the Logone in the Ya´er´e floodplains are probably due mainly to evaporation and some infiltration. They are not proportional to the surface drained because the flow is concentrated in the bed of the Chari and Logone rivers, especially during the dry season. However, compared to the total area of the sub-basin, they represent a negative flux of 127 mm/year, or P–Q of 965 mm/year. A more detailed analysis of the evaporation and infiltration rates in the Ya´er´e could be carried out from a precise estimate of the flooded areas and their seasonal variations, but the interannual variation of the flooded sectors is large and makes an analysis over the period considered difficult.
Table 4
Average water balance of the Chari-Logone from 1960-2007. Uncertainties on the runoff values were estimated basis on the information obtained on the gauges and gauging curves (Mahamat Nour, 2019).
Basin Period (1960− 2007) P (mm) R (mm) R/P P-R Moundou 1258 305 ± 30 0.24 953 Manda 1236 135 ± 27 0.11 1101 Sarh 960 29 ± 6 0.03 931 Laï 1086 84 ± 75 0.08 1002 Salamat 688 10 ± 221 0.01 678 Ya´er´es 765 −200 ± 161 965 Massenya 800 −6 ± 96 806 Chari-Logone (N’Djamena) 912 43 ± 4 0.05 869
5.2. Comparison between the wet and dry periods 5.2.1. Comparison of water balance results
During the wet period P1, the global basin of the Chari-Logone provided 1243 m3/s (Q =64 mm/year) while it decreased to 563
m3/s (29 mm/year) during the dry period P3 (Table 5). This difference (ΔQ/Q = 0.75) corresponds to a lower precipitation variation
(ΔP/P = 0.155). The variation in precipitation is therefore amplified by a factor ε =4.9, thus significantly greater than the factor 3
proposed by Lemoalle et al. (2012).
The upper Logone basin at Moundou is the least sensitive to rainfall variations (ε =3.0), while the Sahr basin, which is less
productive, is the most sensitive (ε =6.4). The Manda basin shows an intermediate dependency (ε =4.4).
The propagation of these sensitivities from these upstream areas to the Chari-Logone as a whole is linked to the contributions of the Fig. 6. Average hydrological regime of the productive upstream sub-basins and the total Chari-Logone of the Chari-Logone system.
Fig. 7. Average hydrological regime of the intermediate sub-basins of the Chari-Logone system.
Table 5
Variation of water balances for the wet period (1960-1971) and the dry period (1982-1997) and estimate of the elasticity coefficient.
Basin Wet Period (1960− 1971) Dry Period (1982− 1997) ℇ (Wet Period -Dry Period) P (mm) Q (m3/s) R (mm) R/P P (mm) Q (m3/s) R (mm) R/P Moundou 1372 409 391 0.28 1174 253 242 0.21 3.03 Manda 1347 503 198 0.15 1153 245 97 0.08 4.41 Sarh 1047 293 48 0.05 896 98 16 0.02 6.43 Bahr Salamat 750 49 8 0.01 642 17 3 0.00 6.25 Chari-Logone (N’Djamena) 994 1243 64 0.06 851 563 29 0.03 4.86
Journal of Hydrology: Regional Studies 35 (2021) 100824
12
sub-basins to the total flow of the Chari-Logone. For the Logone, the upper basin provides the whole flow and therefore controls the
sensitivity of the Logone river at its mouth with the Chari (ε =3.0). The contributions of the two downstream sectors (intermediate Laï
and Ya´er´e sub-basins) offset each other and do not contribute to the sensitivity of the system. Indeed, while the contribution of in-termediate Logone decreased during the dry period, this decrease was largely compensated by the less negative balance of Ya´er´e, which is probably explained by a smaller extension of flooded areas subject to evaporation and water infiltration.
Within the Chari river (ε =5.6 for the entire Chari) at Maïlao, the combined sensitivities of the upstream Chari and the Bahr Sara
explain the overall strong sensitivity of this river. The two basins located in the Sahelian part, Bahr Salamat and Massenya, do not contribute enough to the flow to have a significant influence on the sensitivity of the Chari. For these downstream basins, it is also impossible to achieve a robust determination of their sensitivity to climatic variations, because the uncertainties on their respective flow and runoff are too large. The Bahr Salamat basin in particular is intermittent and, although its contribution seems to have
decreased (from 49 to 17 m3/s between the wet and dry periods), it has only a slight influence on the overall flow variations.
5.2.2. Comparison of hydrological regimes
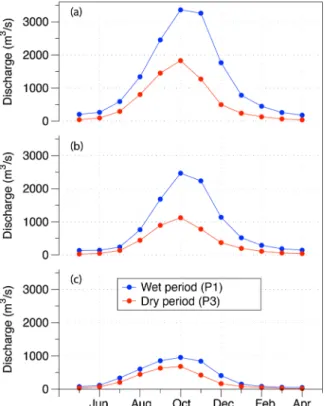
The average seasonal patterns of the Chari-Logone show that the difference in the annual water levels is explained by a flood that is
more intense but also longer for the wet period than for the dry period (Fig. 8). This difference in behavior is observed for both the
Chari and the Logone. The delimitation of the various sub-basins is subject to uncertainties as the very low relief of the downstream part of the basin and the formation of seasonal flooding zones can lead to seasonal exchanges between sub-basins during wet years. During the maximum flood, the waters of the Chari and Logone can overflow of the Bongor Ba-Illi, between Bousso and Bongor, passing
through the Ba-Illi bed which feeds the great Ya´er´e. In addition, the first geographic observers (Tilho, 1928; Bouchardeau and Lefevre,
1957; Rodier, 1966) reported that there was an exchange between the Logone basin and that of B´enou´e, that is to say a “capture water” from Logone near Er´e between Laï and Bongor via the Mayo Kebbi, a tributary of the Benou´e and sub-tributary of the Niger. An
evaluation of these transfers (Rodier, 1966) showed that they occur mainly during strong floods (for example in 1954), and that even in
this case they represent less than 10 % of the annual water layer of the Logone. Under the hydrological conditions of our study, these transfers are negligible.
5.3. Long-term stability of the rainfall-runoff relation during intermediate climatic periods 5.3.1. Evolution of average water balances
The comparison of the two intermediate periods P2 and P4 shows fairly similar average situations, with however a difference of 2%
and 4% respectively for precipitation and runoff (Table 6). In both cases, there is significant interannual variability, with an alternation
of very dry and very wet years (hydrological indices less than -0.5 and greater than +0.5, Fig. 4), but period P2 follows a very wet
Fig. 8. Average hydrological regime of the wet (1960-1971) and dry (1982-1997) periods for the Chari-Logone (a), the Chari (b) and the Logone (c).
period whereas period P4 follows a very dry period, which potentially influences groundwater reservoirs. Despite this, there is no noticeable difference in the flows, nor in the hydrological regimes.
Within Chari-Logone, there is a slight difference in contribution between Chari (+7%) and Logone (-3%). The Manda basin presents a slightly positive difference and is therefore more consistent with that of the entire Chari. However, given the questions raised above on the stability of the rating curves, in particular before and after the interruption of measurements in 1980− 81, these small differ-ences cannot be interpreted. The rainfall-runoff relationship did not change significantly between the two "intermediate" climatic conditions. Consequently, anthropogenic influence has no detectable impact on the flows. The very large amplitude of variation observed for annual flows results only from an amplification of the variations in precipitation. This amplification is high because of the
spatial contrasts, and the role of arid sub-basins. These data therefore contradict the studies recently published by Zhu et al., 2019a,
2019b who assessed the total water loss caused by climate variability and human activities. These authors proposed that the losses
were 16.76 km3 including the relative contribution of climate (26.83 %) and human activity (73.17 %). Their work was based on
models, however, essentially calibrated in a humid period, and applied without the transferability of their parameters to a drier context having been established.
5.3.2. Comparison between individual years
In order to further explore the question of a potential anthropogenic impact, it is interesting to compare hydrologically similar years chosen in different reference periods. The choice was based on the standardized flow rate indices. Thus, we identified five years that
have indices close to zero (Fig. 4). These years and their indices are 1965 (0.06), 1976 (0.03), 1988 (0.01), 2003 (-0.01) and 2010
(0.09).
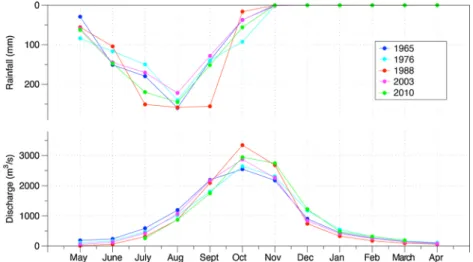
For these 5 years, slight differences appeared in the onset, intensity and duration of the flood (Fig. 9). Several factors can explain
these differences: the influence of the dry or wet context of previous years which could have an influence on runoff, the hydrological regime of year n-1 which influences the value of the starting low of year n, and of course the start of the rainy season.
Prior to the flood, and during the flood onset (parallel trends), the river discharge seems to be controlled by the flood intensity of the preceding year. For example, the year 1964 was very wet (index 1.57), and the flood in 1965 started earlier than in other years. Conversely, the years 1988 and 2010, which followed dry preceding years (indices -1.84 and -1.19) displayed delayed flood onsets. The regime of 2010 was prolonged more in time. The highest peak of the flood was observed in 1988. For the year 1988, precipitation begins later. However, it is high during the season, but recedes earlier than the other 5 years used for comparison. This could be the explanation for the later rise and fall of the discharge curve, as well as the higher maximum of 1988.
In conclusion, it seems that the previous low (n-1) flow determines the rise of the flood (n), and the intensity of precipitation determines the total height of the flood.
The comparison of the different terms of the water balance over the five years studied (Table 7) shows that there is no observable
change in the response of flows to precipitation.
6. Synthesis of discussion
A detailed analysis of all the available gauging curves was carried out as well as a critical verification of the time series in order to estimate the uncertainties on the flow rates. These substantial uncertainties represent at least 10 % of the flow values. The magnitude of these uncertainties requires careful interpretation of the comparisons of flows between stations and makes the estimates of the hydrological balances of the downstream sub-watersheds, in particular those of Bahr Salamat and Massenya which are almost zero, very poorly constrained. On the other hand, the comparison made between different time windows is much more robust, subject to careful verification of the continuity of the calibrations. In fact, all hydrological observations were interrupted between 1980 and 1981 and we have shown that this period corresponds to a clear shift in the flows measured at the Maïlao station. All these elements are taken into account in our analyses.
Our analysis highlights significant spatial contrasts in the flow of water and the hydrological contributions of the various sub-basins of the Chari-Logone, the first contrast being between the Chari and the Logone rivers. The main tributary the Chari contributes 65 % to the flow of the Chari-Logone river system. However, this proportion is low in view of the size of its basin, which represents 83 % of the whole basin. The detailed analysis of the seven sub-basins shows that the flow of the Chari-Logone comes mainly from the Bahr Sara basin (38 %), mainly located in the Central African Republic, from the Logone upstream of Moundou (35 %), mainly located in Cameroon and the upstream Chari basin (19 %) mainly located in the Central African Republic and Sudan. The contrasts between the water heights flowing from these 3 upstream sub-basins are significant. Although subject to similar climates, the Bahr Sara has a water flow (135 mm/year) that is twice as low as that of the upstream Logone (305 mm/year), which highlights the role of geology, and the Table 6
Water balance for Intermediate Period 1 (1972-1979) and Intermediate Period 2 (1998-2007).
Basin Intermediary Period P2 (1972− 1979) Intermediary Period P4 (1998− 2007)
P (mm) Q (m3/s) R (mm) R/P P (mm) Q (m3/s) R (mm) R/P
Moundou 1273 331 316 0.25 1244 294 281 0.23
Manda 1250 307 121 0.10 1222 316 125 010
Sarh 971 177 29 0.03 950 162 26 0.03
Journal of Hydrology: Regional Studies 35 (2021) 100824
14
existence of a significant recharge over the Continental Terminal outcrops in the Bahr Sara sub-basin (Gonçalv`es et al., 2020). This
recharge also occurs in the upstream Chari sub-basin and combined with the influence of a Sahelian-type climate throughout its northeastern part, explains the very low flow of water (29 mm/year).
The Bahr Salamat sub-basin, mainly located in Chad but also extending to Sudan in its upstream part, contributes only very slightly to the supply of the flow of the Chari-Logone (7 ± 15 %), although this sub-basin represents 33 % of the entire Chari-Logone basin. In this sub-basin located entirely in a Sahelian climate, the flows are temporary and difficult to gauge. The significant uncertainty in this estimate stems from the lack of a gauging station and an indirect estimate of the flows. Nevertheless, it is important to stress that this highlights that a significant part of the Chari-Logone basin is not "hydrologically active" and is related to the endorheic context (Bouchez et al., 2019).
The temporal variations of the flows were considerable during the period 1960–2015. They are characterized by a general downward trend, responsible for a dramatic reduction in the extension of Lake Chad. This discharge decrease in the Chari-Logone basin
is observed in several basins of tropical Africa (Olivry, 1993; Mah´e and Olivry, 1995; Paturel et al., 1995; Vissin et al., 2007). There is a
close relationship between rainfall variability and flow variability (Mah´e et al., 2005; Koumassi, 2014). This relationship is nonlinear
because the relative decrease in runoff is greater than that in rainfall. Lemoalle et al. (2012) showed that the decrease in rainfall of
about 10 % led to a 30 % drop in flows for the Chari-Logone. Our analysis allows a more detailed and complete assessment of this relationship than what has been reported so far in the literature. There is a rainfall difference of 15.5 % over the entire Chari-Logone basin between a wet (1960− 1971) and dry (1982− 1997) sub-period. This rainfall difference led to a difference in flow of 75 % on average over the entire Chari-Logone basin, 47 % in the upstream Logone basin, 69 % in the Bahr Sara basin and 100 % in the Chari upstream. The Chari-Logone sub-basins have elasticity coefficients of 6.4, 4.4 and 3.0 respectively for Chari upstream, Bahr Sara and Logone upstream.
Recent publications claim that abstraction and anthropogenic activities are mainly responsible for the decrease in flow in the Chari-
Logone basin (Gao et al., 2011; TellroWaï et al., 2012; Zhu et al., 2019a, 2019b; Mahmood and Jia, 2019; Mahmood et al., 2020).
However, these studies are based on models, essentially calibrated in a humid period, and applied without the transferability of their parameters to a drier context having been established. In order to shed objective light on this question, we compared hydrologically intermediate situations between the wet period and the dry period and distributed at different times of the period 1960–2015. The first comparison is based on the interannual average conditions of two periods (1972− 1979 and 1998− 2007) for which the average flow rate is similar. It appears that the corresponding average climatic conditions were also similar. The second comparison is based on individual years, also chosen on the criterion of an intermediate hydrological situation between wet and dry but distributed in different average climatic contexts. A comparison of the five selected years, distributed between 1964 and 2010, shows that there has been no observable change in the response of flows to precipitation. The slight differences in runoff coefficients are explained by the influence
Fig. 9. Chari-Logone hydrological regimes for the five selected years (1965; 1976; 1988; 2003 and 2010). Table 7
Chari-Logone hydrological balances for five particular years (1965, 1976, 1988, 2003 and 2010) characterized by similar standardized indices and close of 0. The rainfall data for 2003 and 2010 were reconstructed with 8 and 9 available stations, respectively.
Years P (mm) Q (m3/s) R (mm) R/P 1965 894 916 47 0.05 1976 899 906 47 0.05 1988 1076 898 46 0.04 2003 861 893 46 0.05 2010 952 927 48 0.05
of year n-1 which determines the low water flow at the start of the season, and the base flow of the rising flood. The analysis of hydro-climatic data therefore shows no evidence of an anthropogenic impact that would lead to a decrease in flows or a modification of the hydrological regime in the Chari-Logone basin between 1964 and 2010.
It is nevertheless clear that water withdrawals in the Chari-Logone basin are occurring (Coe and Foley, 2001; World Bank, 2002;
United Nations Environmental Programme (UNEP), 2004; TellroWaï et al., 2012). The contribution of the Chari-Logone waters to Lake Chad is 26 km3 on an interannual average (1960–2015). The total withdrawal for irrigation is estimated at 1.8 km3 / year in the basin
and the lake (Lemoalle et al., 2014). However, our results show that the order of magnitude of this withdrawal remains moderate, and
that its influence is not detected in the hydrological balances of the various sub-basins except for a few uncertainties.
Finally, our analysis also made it possible to hydrologically situate the recent period from 2013 to 2015. The annual average precipitation for the recent period (2013–2015) is only slightly different from the interannual average period of 1960–2015. On the other hand, the flow monitoring is variable.
The apparent temporal decrease in flows from the upstream Chari and also the entire Chari could be due in particular to the great uncertainties in the estimation of average precipitation and the absence of vegetation cover in the Chari basin.
7. Conclusion
We have synthesized and analyzed all the available hydroclimatic data for the Chari-Logone basin during the period 1960–2015 in order to characterize the spatial contrasts, the temporal variations and the respective sensitivities of the various sub-watersheds to climatic variations.
The average flow of the Chari-Logone during the period 1960–2015 was 823 m3/s, or a water height of 42 mm/year which
rep-resents 5% of precipitation in the watershed. This very low discharge ratio makes it highly sensitive to variations in precipitation. Our hydroclimatic data show no clearly detectable evidence of an anthropogenic impact responsible for a decrease in flows or a modification of the hydrological regime in the Chari-Logone basin.
Declaration of Competing Interest
The authors report no declarations of interest.
Acknowledgements
This work was supported by the National Research Institute for Sustainable Development (IRD) within the framework of the project "Preservation of Lake Chad: Contribution to the lake development strategy" funded by the French Global Environment Fund. The authors thank the University of N’Djamena and the French Embassy in Chad for their logistical support. The authors also thank the Directorate of Water Resources of Chad for the data provided and the International Atomic Energy Agency for their support.
Appendix A. Supplementary data
Supplementary material related to this article can be found, in the online version, at doi:https://doi.org/10.1016/j.ejrh.2021.
100824.
References
Ardoin-Bardin, S., Dezetter, A., Servat, E., Paturel, J.E., Mah´e, G., Niel, H., Dieulin, C., 2009. Using general circulation model outputs to assess impacts of climate change on runoff for large hydrological catchments in West Africa. Hydrol. Sci. J. Des Sci. Hydrol. 54 (1), 77–89. https://doi.org/10.1623/hysj.54.1.77. Bader, J.-C., Lemoalle, J., Leblanc, M., 2011. Mod`ele hydrologique du lac Tchad. Hydrol. Sci. J. 56 (3), 411–425.
Balme, M., Lebel, T., Amani, A., 2006. Ann´ees s`eches et ann´ees humides au Sahel: quo vadimus? Hydrol. Sci. J. 51 (2), 254–271. https://doi.org/10.1623/ hysj.51.2.254.
Billon, B., Guiscafr´e, J., Herbaud, J., Oberlin, G., 1968. Monographie Hydrologique Du Chari, 145 + 289 + 99 + 235 + 477 p. Multigr.. Retrieved from ORSTOM, Paris. http://www.documentation.ird.fr/hor/fdi:16679.
Bouchardeau, A., Lefevre, R., 1957. Monographie Du Lac Tchad NOEDI Ed. Prov.
Bouchez, C., Goncalves, J., Deschamps, P., Vallet-Coulomb, C., Hamelin, B., Doumnang, J.-C., Sylvestre, F., 2016. Hydrological, chemical, and isotopic budgets of Lake Chad: a quantitative assessment of evaporation, transpiration and infiltration fluxes. Hydrol. EarthSyst. Sci. 20 (4), 1599–1619. https://doi.org/10.5194/hess-20- 1599-2016.
Bouchez, C., Deschamps, P., Goncalves, J., Hamelin, B., Mahamat Nour, A., Vallet-Coulomb, C., Sylvestre, F., 2019. Water transit time and active recharge in the Sahel inferred by bomb-produced 36Cl. Sci. Rep. 9 (1), 7465. https://doi.org/10.1038/s41598-019-43514-x.
Cabot, J., 1965. Le Bassin Du Moyen Logone (Monographie Du Logone), 355. Document De ORSTOM. P.355, Paris.
Chenevey, R., 2011. Programme de gestion int´egr´ee des ressources des bassins transfrontaliers en Afrique – composante du Lac Tchad FED/2009/219-259. PGIRE/ CBLT/EU: Rapport d’activit´e Final 2009 - 2011, p. 55. CBLT-BRL.
Chiew, F.H., Peel, M.C., McMahon, T.A., Siriwardena, L.W., 2006. Precipitation elasticity of streamflow in catchments across the world. IAHS Publ. 308, 256. Coe, M.T., Foley, J.A., 2001. Human and natural impacts on the water resources of the Lake Chad basin. J. Geophys. Res. Atmos. 106 (D4), 3349–3356. https://doi.
org/10.1029/2000JD900587.
Delclaux, F., Seignobos, C., Li´enou, G., Genthon, P., 2011. Water and people in the Yaere floodplain (NorthCameroon). In: Alvarez, Marc A. (Ed.), Foodplains, pp. 1–36, 36. Retrieved from. https://www.google.com/search?client=firefox-b-ab&q=Delclaux%2C++F.%2C++Seignobos%2C++C.%2C++Li%C3%A9nou%
Journal of Hydrology: Regional Studies 35 (2021) 100824
16
2C++G.%2C++Genthon%2C++P.%2C++2011.++Water++and++people++in++the++Yaere++floodplain++%28NorthCameroon%29.+In+Foodplains.+ ed.+Marc+A.+Alvarez%2C+pp.1-36.Nover+Science+Publishers.
Descroix, L., Mah´e, G., Lebel, T., Favreau, G., Galle, S., Gautier, E., Olivry, J.C., et al., 2009. Spatio-temporal variability of hydrological regimes around the boundaries between Sahelian and Sudanian areas of West Africa: a synthesis. J. Hydrol. (Amst) 375 (1–2), 90–102.
Efstratiadis, A., Koussis, A., Lykoudis, S., Koukouvinos, A., Christofides, A., Karavokiros, G., Kappos, N., et al., 2013. Hydrometeorological network for flood monitoring and modeling. Proc SPIE 8795. https://doi.org/10.1117/12.2028621.
Fourissala, R.H., Gormo, J., 2012. Changement climatique et migration dans la bande sah´elienne du Tchad. Locus-Rev. Hist´oria 18 (2).
Gac, J.-Y., 1980. G´eochimie Du Bassin Du Lac Tchad : Bilan De l’alt´eration De l’´erosion Et De La S´edimentation. Retrieved from. ORSTOM, Paris. http://www. documentation.ird.fr/hor/fdi:00039.
Gal, L., Grippa, M., Hiernaux, P., Pons, L., Kergoat, L., 2017. The paradoxical evolution of runoff in the pastoral Sahel: analysis of the hydrological changes over the Agoufou watershed (Mali) using the KINEROS-2 model. Hydrol. Earth Syst. Sci. 21 (9), 4591–4613.
Gao, H., Bohn, T.J., Podest, E., McDonald, K.C., Lettenmaier, D.P., 2011. On the causes of the shrinking of Lake Chad. Environ. Res. Lett. 6 (3), 034021. Gonçalv`es, J., Mahamat Nour, A., Bouchez, C., Deschamps, P., Vallet-Coulomb, C., 2020. Recharge and baseflow constrained by surface-water and groundwater
chemistry: case study of the Chari River, Chad basin. Hydrogeol. J. https://doi.org/10.1007/s10040-020-02259-y.
Goovaerts, P., 2000. Geostatistical approaches for incorporating elevation into the spatial interpolation of rainfall. J. Hydrol. 228 (1), 113–129. https://doi.org/ 10.1016/S0022-1694(00)00144-X.
Harris, I., Jones, P.D., Osborn, T.J., Lister, D.H., 2014. Updated high-resolution grids of monthly climatic observations – the CRU TS3.10 Dataset. Int. J. Climatol. 34 (3), 623–642. https://doi.org/10.1002/joc.3711.
Hubert, P., Carbonnel, J.P., Chaouche, A., 1989. Segmentation des s´eries hydrom´et´eorologiques—application `a des s´eries de pr´ecipitations et de d´ebits de l’Afrique de l’ouest. J. Hydrol. 110 (3–4), 349–367.
Hulme, M., Conway, D., Jones, P.D., Jiang, T., Barrow, E.M., Turney, C., 1995. Construction of a 1961–1990 European climatology for climate change modelling and impact applications. Int. J. Climatol. 15 (12), 1333–1363. https://doi.org/10.1002/joc.3370151204.
Jones, P.D., Hulme, M., 1996. Calculating regional climatic time series for temperature and precipitation: methods and illustrations. Int. J. Climatol. 16 (4), 361–377. https://doi.org/10.1002/(SICI)1097-0088(199604)16:4<361::AID-JOC53>3.0.CO;2-F.
Jung, H.C., Alsdorf, D., Moritz, M., Lee, H., Vassolo, S., 2011. Analysis of the relationship between flooding area and water height in the Logone floodplain. Phys. Chem 36 (7), 232–240. https://doi.org/10.1016/j.pce.2011.01.010.
Koumassi, H., 2014. Risques Hydroclimatiques Et Vuln´erabilit´es Des ´Ecosyst`emes Dans Le Bassin Versant De La Sota a l’exutoire De Couberi. PhD Thesis. Universit´e d’Abomey Calavi.
Lavergne, M., 2017. Le Lac Tchad, Entre l’ass`echement Et l’intrusion De BokoHaram: La Faute Au Changement Climatique, Ou `a l’immobilit´e Politique? (PhD Thesis). Sawaconsulting.
Leblanc, M., Favreau, G., Maley, J., Nazoumou, Y., Leduc, C., Stagnitti, F., Oevelen, P., van, J., et al., 2006. Reconstruction of Megalake Chad using shuttle radar topographic mission data. Palaeogeogr. Palaeoclimatol. Palaeoecol. 239 (1–2), 16–27. https://doi.org/10.1016/j.palaeo.2006.01.003.
Lemoalle, J., Bader, J.-C., Leblanc, M., Sedick, A., 2012. Recent changes in Lake Chad: observations, simulations and management options (1973–2011). Glob. Planet. Change 80–81, 247–254. https://doi.org/10.1016/j.gloplacha.2011.07.004.
Lemoalle, J., Magrin, G., Ngaressem, G.M., NgounouNatcha, B., Raimond, C., Issa, S. (Eds.), 2014. Le d´eveloppement du Lac Tchad : situation actuelle et futurs possibles = Developement of Lake Chad : current situation and possible outcomes. Expertise coll´egiale r´ealis´ee par l’IRD `a la demande de la Commission du Lac Tchad = Expert group reviewunder the IRD supervision and the request of th Lake Chad Basin Commission. Expertise Coll´egiale. IRD, Marseille. Retrievedfrom. http://www.documentation.ird.fr/hor/fdi:010063402.
Lienou, G., 2007. Impacts De La Variabilit´e Climatique Sur Les Ressources En Eau Et Les Transports De Mati`eres En Suspension De Quelques Bassins Versants Repr´esentatifs Au Cameroun. PhD Dissertation. Retrieved from. Univ. of Yaound´e I. https://core.ac.uk/download/pdf/39839507.pdf.
Louis, P., 1970. Contribution g´eophysique `a la connaissance g´eologique du bassin du lac Tchad. M´emoires ORSTOM. ORSTOM., Paris. Retrieved from. http://www. documentation.ird.fr/hor/fdi:04616.
Mahamat Nour, A., 2019. Fonctionnement Hydrologique, Chimique Et Isotopique Du Principal Affluent Du Lac Tchad : Le Syst`eme Chari-logone (PhD Dissertation). Retrieved from. Aix-Marseille. https://www.theses.fr/2019AIXM0196.
Mahamat Nour, A., Vallet-Coulomb, C., Siddig, A.A., 2019. Distribution of mean spatial rainfall in the Chari-Logone basin from 1960-2015. Int. J. Eng. Sci. Res. Technol. 3 (11), 17. https://doi.org/10.5281/zenodo.3542442.
Mah´e, G., Olivry, J.-C., 1995. Variations des pr´ecipitations et des ´ecoulements en Afrique de l’Ouest et centrale de 1951 `a 1989. Sci. Chang. Plan´etaires S´echer. 6 (1), 109–117. Retrieved from. https://www.jle.com/fr/revues/sec/e-docs/variations_des_precipitations_et_des_ecoulements_en_afrique_de_louest_et_centrale_de_ 1951_a_1989_270910/article.phtml?cle_doc=0004223E.
Mah´e, G., Paturel, J.-E., Servat, E., Conway, D., Dezetter, A., 2005. The impact of land use change on soil water holding capacity and river flow modelling in the Nakambe River, Burkina-Faso. J. Hydrol. 300 (1–4), 33–43.
Mah´e, G., Lienou, G., Descroix, L., Bamba, F., Paturel, J.-E., Laraque, A., Meddi, M., et al., 2013. The rivers of Africa: witness of climate change and human impact on the environment. Hydrol. Process. 27 (15), 2105–2114.
Mahmood, R., Jia, S., 2019. Assessment of hydro-climatic trends and causes of dramatically declining stream flow to Lake Chad, Africa, using a hydrological approach. Sci. Total Environ.
Mahmood, R., Jia, S., Mahmood, T., Rao, A., 2020. Predicted and projected water resources changes in the chari catchment, the Lake Chad Basin, Africa. J. Hydrometeorol 21, 73–97. https://doi.org/10.1175/JHM-D-19-0105.1.
McKee, T.B., Doesken, N.J., Kleist, J., 1993. The relationship of drought frequency and duration to time scales. In: American Meteorological Society Boston, MAProc. 8th Conf. Appl. Climatol., 17, pp. 179–183.
Ndehedehe, C.E., Agutu, N.O., Okwuashi, O., Ferreira, V.G., 2016. Spatio-temporal variability of droughts and terrestrial water storage over Lake Chad Basin using independent component analysis. J. Hydrol. 540, 106–128. https://doi.org/10.1016/j.jhydrol.2016.05.068.
Nelngar, Y., 1989. Mise `a Jour Des ´Etalonnages Des Principales Stations Hydrom´etriques De La R´epublique Du Tchad. Retrieved from. ORSTOM, Montpellier. http:// www.documentation.ird.fr/hor/fdi:010020456.
Nkiaka, E., Nawaz, N.R., Lovett, J.C., 2017. Evaluating global reanalysis precipitation datasets with rain gauge measurements in the Sudano-Sahel region: case study of the Logone catchment, Lake Chad Basin. Meteorol. Appl. 24 (1), 9–18. https://doi.org/10.1002/met.1600.
Nkiaka, E., Nawaz, N.R., Lovett, J.C., 2018. Effect of single and multi-site calibration techniques on hydrological model performance, parameter estimation and predictive uncertainty: a case study in the Logone catchment, Lake Chad basin. Stoch. Environ. Res. RiskAssess. 32 (6), 1665–1682. https://doi.org/10.1007/ s00477-017-1466-0.
Olivry, J.-C., 1993. Evolution R´ecente Des R´egimes Hydrologiques En Afrique Intertropicale.
Olivry, J.-C., Chouret, A., Vuillaume, G., Lemoalle, J., Bricquet, J.-P., 1996. Hydrologie Du Lac Tchad, Vol. 12. Orstom.
Paturel, J.E., Servat, E., Vassiliadis, A., 1995. Sensitivity of conceptual rainfall-runoff algorithms to errors in input data — case of the GR2M model. J. Hydrol. 168 (1), 111–125. https://doi.org/10.1016/0022-1694(94)02654-T.
Pham-Duc, B., Sylvestre, F., Papa, F., Frappart, F., Bouchez, C., Cr´etaux, J.-F., 2020. The Lake Chad hydrology under current climate change. Sci. Rep. 10 (1), 5498. https://doi.org/10.1038/s41598-020-62417-w. Nature Publishing Group.
Rodier, J., 1966. Les D´eversements Du Logone Vers La B´enou´e. ORSTOM.
Sankarasubramanian, A., Vogel, R.M., Limbrunner, J.F., 2001. Climate elasticity of streamflow in the United States. Water Resour. Res. 37 (6), 1771–1781. Schneider, J.-L., Wolf, J.P., 1992. Carte g´eologique et hydrog´eologique de 1/500 000 de la republique du Tchad, m´emoire explicatif (No. 209), 531. Paris: BRGM 531.
Seeber, K., Daïra, D., Aminu, M.B., Vassolo, S., 2014. ´Etudes De La Qualit´e Des Eaux Souterraines Dans La Plaine d’inondation Du Logone Inf´erieur | La Commission Du Bassin Du Lac Tchad (Gestion Durable Des Eaux Du Bassin Du Lac Tchad No. 7).. Hanovre. Retrieved from. http://www.cblt.org/fr/etudes-de-la-qualite-des- eaux-souterraines-dans-la-plaine-dinondation-du-logone-inferieur.
Séraphin, P., 2016. Contribution du traçage isotopique (δ 18O et δ D) à la compréhension et à la modélisation hydrogéologique de la nappe de la Crau (PhD Thesis). Aix-Marseille. http://www.theses.fr/2016AIXM4353.
Snepvangers, J.J.J.C., Heuvelink, G.B.M., Huisman, J.A., 2003. Soil water content interpolation using spatio-temporal kriging with external drift. Geoderma Pedometrics 112 (3), 253–271. https://doi.org/10.1016/S0016-7061(02)00310-5, 2001.
TellroWaï, N., NgounouNgatcha, B., Mah´e, G., Doumnang, J.C., Delclaux, F., 2012. Influence Des Activit´es Anthropiques Sur Le R´egime Hydrologique Du Bassin Du Fleuve Du Logone De 1960 `a 2000.
Tilho, J., 1928. Variations et disparition possible du Tchad. Ann. G´eographie 37, 238–260. JSTOR.
United Nations Environmental Programme (UNEP), 2004. Lake Chad, Global International Water Assessment (GIWA) Regional Assessment 43. - Recherche Google. Retrieved March 28, 2019, from. University of Kalmar, Kalmar, Sweden. https://www.google.com/search?client=firefox-b-d&q=United+Nations+
Environmental+Programme+%28UNEP%29%2C+2004.+Lake+Chad%2C+GlobalInternational+Water+Assessment+%28GIWA%29+Regional+assessment+ 43.+University+ofKalmar%2C+Kalmar%2C+Sweden.
Vassolo, S., Wilczok, C., Dai¨ra, D., Magaji Bala, A., 2016. Interaction entre les eaux souterraines et les eaux de surface dans les plaines inondables du Bas-Logone | La Commission du Bassin du Lac Tchad (No. 10). Gestion Durable des Eaux du Bassin du Lac Tchad. Hanovre: BGR- CBLT. Retrieved from. http://www.cblt.org/fr/ interaction-entre-les-eaux-souterraines- et-les-eaux-de-surface-dans-les-plaines-inondables-du-bas.
Verdonck, J., 2011. Lake Chad Basin Water allocation planning model final report. In: Integrated Management Programme of the Transboundary Resources in Africa – Lake Chad Component FED/2009/219-259, 91. CBLT-BRL.
Vissin, E., 2007. Impact De La Variabilit´e Climatique Et De La Dynamique Des ´Etats De Surface Sur Les ´Ecoulements Du Bassin B´eninois Du Fleuve Niger (PhD Dissertation). Universit´e de Bourgogne.
Vissin, E., Amoussou, E., Houssou, C., 2007. Variabilit´e de la pluviom´etrie et des ´ecoulements dans le bassin b´eninois du fleuve Niger. Rev. Clim. D´ev. Abomey-Calavy 3, 25–33.
Vuillaume, G., 1981. Bilan hydrologique mensuel et mod´elisation sommaire du r´egime hydrologique du lac Tchad. Cah ORSTOM S´erHydrol 18 (1), 23–72. Retrieved from. https://scholar.google.fr/scholar?hl=fr&as_sdt=0%2C5&q=Bilan+hydrologique+mensuel+et+mode%CC%81lisation+sommaire+du+re%CC%81gime+ hydrologique+du+lac+Tchad&btnG=.
World Bank, 2002. Africa Region - Reversal of Land and Water Degradation Trends in Lake Chad Basin Ecosystem Project (No. PID9666), 1. Retrieved from. The World Bank. http://documents.worldbank.org/curated/en/209211468767651342/Africa-Region-Reversal-of-Land-and-Water-Degradation-Trends-in-Lake-Chad-Basin- Ecosystem-Project.
Zhu, W., Jia, S., Lall, U., Cao, Q., Rashid, M., 2019a. Relative contribution of climate variability and human activities on the T water loss of the Chari/Logone River discharge into Lake Chad: a conceptual and statistical approach - Recherche Google. J. Hydrol. 569, 519–531. https://doi.org/10.1016/j.jhydrol.2018.12.015. Zhu, W., Jia, S., Lall, U., Cao, Q., Rashid, M., 2019b. Relative contribution of climate variability and human activities on the T water loss of the Chari/Logone River discharge into Lake Chad: a conceptual and statistical approach - Recherche Google. J. Hydrol. 569, 519–531. https://doi.org/10.1016/j.jhydrol.2018.12.015.