HAL Id: hal-00298073
https://hal.archives-ouvertes.fr/hal-00298073
Submitted on 23 Apr 2007
HAL is a multi-disciplinary open access
archive for the deposit and dissemination of
sci-entific research documents, whether they are
pub-lished or not. The documents may come from
teaching and research institutions in France or
abroad, or from public or private research centers.
L’archive ouverte pluridisciplinaire HAL, est
destinée au dépôt et à la diffusion de documents
scientifiques de niveau recherche, publiés ou non,
émanant des établissements d’enseignement et de
recherche français ou étrangers, des laboratoires
publics ou privés.
interglacial and the last glacial inception
F. Kaspar, T. Spangehl, U. Cubasch
To cite this version:
F. Kaspar, T. Spangehl, U. Cubasch. Northern hemisphere winter storm tracks of the Eemian
inter-glacial and the last inter-glacial inception. Climate of the Past, European Geosciences Union (EGU), 2007,
3 (2), pp.181-192. �hal-00298073�
www.clim-past.net/3/181/2007/
© Author(s) 2007. This work is licensed under a Creative Commons License.
of the Past
Northern hemisphere winter storm tracks of the Eemian interglacial
and the last glacial inception
F. Kaspar, T. Spangehl, and U. Cubasch
Freie Universit¨at Berlin, Institut f¨ur Meteorologie
Received: 16 November 2006 – Published in Clim. Past Discuss.: 7 December 2006 Revised: 3 April 2007 – Accepted: 5 April 2007 – Published: 23 April 2007
Abstract. Climate simulations of the Eemian interglacial
and the last glacial inception have been performed by forc-ing a coupled ocean-atmosphere general circulation model with insolation patterns of these periods. The parameters of the Earth’s orbit have been set to conditions of 125 000 and 115 000 years before present (yr BP). Compared to to-day, these dates represent periods with enhanced and weak-ened seasonality of insolation in the northern hemisphere. Here we analyse the simulated change in northern hemi-sphere winter storm tracks. The change in the orbital con-figuration has a strong impact on the meridional tempera-ture gradients and therefore on strength and location of the storm tracks. The North Atlantic storm track is strengthened, shifted northward and extends further to the east in the sim-ulation for the Eemian at 125 kyr BP. As one consequence, the northern parts of Europe experience an increase in winter precipitation. The frequency of winter storm days increases over large parts of the North Atlantic including the British Isles and the coastal zones of north-western Europe. Oppo-site but weaker changes in storm track activity are simulated for 115 kyr BP.
1 Introduction
Climate variations during the last 500 000 years are domi-nated by interglacial-glacial-cycles, which are generally be-lieved to be responses to changes in insolation as a result of variations in Earth’s orbit around the sun (Berger, 1988). Palaeoclimatic records reveal that interglacials occurred ap-proximately every 100 000 years in this period and lasted for 7 000 to 17 000 years. Here, we present simulations of the Eemian interglacial, which was the last interglacial before the present one (approx. 130 000 yr BP–116 000 yr BP; Kukla
Correspondence to: F. Kaspar
(frank.kaspar@met.fu-berlin.de)
et al., 2002). The simulations approximately represent pe-riods with maximum and minimum summer insolation in the northern hemisphere. These periods are connected with dif-ferent states of the climate system that are visible in palaeo-data, namely: The minimum of global ice volume occurred at approx. 125 000 yr BP. We therefore consider this date as representative for the warm phase of the Eemian (heafter: EEM). After ca. 115 000 yr BP, open vegetation re-placed forests in northwestern Europe and at Vostok air tem-peratures dropped sharply (Kukla et al., 2002). We use this date to represent the start of the last glaciation (hereafter: GI, “glacial inception”). Three parameters are responsible for the seasonal distribution of insolation: the eccentricity of the Earth’s orbit, the angle of the axis of rotation (obliq-uity) and the position of the equinoxes relative to the perihe-lion. The combined effect of greater obliquity and eccentric-ity, together with the fact that perihelion occurred in northern hemisphere summer caused an amplification of the northern hemispheric seasonal cycle of insolation at 125 000 yr BP. Figure 1 illustrates the latitudinal distribution of insolation during the seasons for 125 000 yr BP as anomaly from to-day. The changes are especially strong on the high north-ern latitudes during summer. At 65◦North the insolation in
mid June was 11.7% higher than today (531 W/m2instead of 475 W/m2). The insolation in mid December was 1.9 W/m2 compared to 3.0 W/m2today. At 115 000 yr BP the angle of perihelion was almost opposite compared to 125 000 yr BP and similar to today. The perihelion occurring in northern hemisphere winter combined with greater eccentricity and lower obliquity caused a weakening of the seasonal cycle of insolation in the northern hemisphere. This results in an al-most opposite distribution of the anomalies as for 125 000 yr BP, but with smaller absolute differences. The insolation in mid June at 65◦North was 7.6% lower (439 W/m2) than
to-day. In mid December it was 6.8 W/m2. For a detailed dis-cussion of insolation patterns during interglacials see Berger et al. (2007).
Fig. 1. Insolation anomaly in W/m2at 125 000 yr BP as a function of latitude and the position on the Earth’s orbit. The values are shown as deviation from present-day conditions and are calculated according to Berger (1978). See Berger et al. (2007) for more details on conditions during interglacials.
Although absolute changes in insolation in the northern hemisphere are strongest in summer, northern high latitudi-nal winter temperatures can also be strongly modified due to indirect effects, as for example via the influence of oceanic or atmospheric dynamics or changes in sea-ice distribution. Therefore, the changed orbital configuration could lead to distinct changes in the seasonal cycle of temperature. As the strength of this effect strongly depends on the latitude, it leads to significant changes in the meridional temperature gradients. Due to the temperature gradients in midlatitudes atmospheric circulation is characterised by the occurrence of baroclinic waves. According to the theory of baroclinic insta-bility (Charney, 1947) these waves develop from small dis-turbances and depending on the background flow conditions they amplify to mature synoptic scale systems. They interact with the background flow by reducing the meridional tem-perature gradient and by dynamical feedbacks (Hoskins and Valdes, 1990). Of relevance for the local weather and cli-mate are the synoptic scale cyclones and the associated fronts as they are largely responsible for the precipitation and near surface wind at these latitudes.
The regions of higher frequency atmospheric variability that are characterized by the frequent passage of cyclones and anticyclones (in contrast to low frequency variability associated with blocking) have been intensively studied for observed present-day climate (Blackmon, 1976; Blackmon et al., 1977) as well as in model-based climate change projec-tions for the 21st century. “Storm tracks” defined after Black-mon et al. (1977) as regions with large synoptic-scale activ-ity can be calculated as the standard deviation of the band-pass filtered geopotential height and are often used to quan-tify baroclinic wave activity (Eulerian view) as they are easy to apply and provide a general storm track activity measure
(Hoskins and Hodges, 2002). Alternative measures for syn-optic scale activity are based on the identification and track-ing of individual systems (cyclones and anticyclones) from sea level pressure or near surface geopotential height fields (Lagrangian view). In contrast to the Eulerian view this La-grangian approach yields more detailed information on cy-clone characteristics and enables to separate different types of systems (e.g. weak and strong cyclones). Here a num-ber of methods have been developed and applied to general circulation models (GCMs) and reanalysis data (e.g. Knip-pertz et al., 2000; Hoskins and Hodges, 2002; Wernli and Schwierz, 2006). These methods require a smoothing of the input fields or the introduction of numerous parameters and thresholds to eliminate artificial and spurious lows. A di-rect comparison between different studies is often compli-cated as results are sensitive to both the resolution/spherical truncation of the input fields and the setting of the individual parameters (Pinto et al., 2005). General circulation models are able to simulate the present-day storm tracks fairly well (Hall et al., 1996). Whereas the main characteristics of the storm tracks are captured by models with lower spectral res-olution (Stendel and Roeckner, 1998) the representation of numerous features (e.g. the number of weak cyclones, the in-tensity of strong cyclones, the representation of associated fronts and wind speeds) can be significantly improved by in-creased model resolution (Jung et al., 2006).
As GCMs indicate significant changes in storm tracks un-der climate change scenarios (Yin, 2005; Pinto et al., 2007), it is of interest to analyse the behaviour of the models un-der different conditions. Simulations of palaeoclimates offer the opportunity to compare variables that are linked to storm tracks with reconstructed data, e.g. changes in precipitation. Kageyama et al. (1999) analysed storm tracks in a number of GCMs for the last glacial maximum at 21 000 yr BP. At that time orbital configuration was similar to today, but cli-mate was strongly influenced by the presence of large ice sheets and differences in sea surface temperatures and sea ice cover. Nearly all models reacted with an eastward shift of the northern hemispheric storm tracks. Hall and Valdes (1997) analysed winter storm tracks in a GCM simulation for 6000 years before present, also a period with enhanced summer insolation in the northern hemisphere. They found an increase in baroclinicity in the storm track regions of the Atlantic and the Pacific.
Previous modelling experiments for the last glacial in-ception at approx. 115 000 yr BP focused on the question if the change in insolation is sufficient to generate a peren-nial snow coverage in polar latitudes. Early experiments with atmosphere-only models failed, but later experiments led to better results by considering additional feedbacks, for exam-ple that of the ocean (Khodri et al., 2001) or vegetation (Gal-limore and Kutzbach, 1996). For a detailed review, see Vet-toretti and Peltier (2004).
In this article, we analyse storm tracks in simulations of the Eemian interglacial and the subsequent glacial inception.
The climate model and the setup of the experiments are de-scribed in Sect. 2. In Sect. 3 we give an overview over some general features of the simulations and present the results for the northern hemispheric winter storm tracks and related cli-matic parameters. In Sect. 4 the results are discussed and compared with simulations of future climate change.
2 Model description and experimental setup
2.1 The ECHO-G model
The ECHO-G model (Legutke and Maier-Reimer, 1999; Legutke and Voss, 1999) consists of the ECHAM4 atmo-sphere model (Roeckner et al., 1992) coupled to the HOPE-G ocean model. The atmospheric component is a spectral model with a horizontal resolution of T30 (≈3.75◦) and 19
vertical hybrid sigma-pressure levels with the highest level at 10 hPa. The ocean model HOPE-G is the global version of the Hamburg Ocean Primitive Equation Model (Wolff et al., 1997) and includes a dynamic-thermodynamic sea-ice model with a viscous-plastic rheology (Hibler, 1979). A gaussian T42 Arakawa E-Grid (≈2.8◦) is used with a gradual
merid-ional refinement reaching 0.5◦in the tropical ocean between
10◦S and 10◦N. The vertical resolution is given by 20
hor-izontal levels with eight levels within the top 2000 meters from the ocean surface. The atmospheric and oceanic com-ponents are coupled with a flux correction. The model time steps are 30 min for ECHAM4 and 12 h for HOPE-G. The resolution of the model is appropriate for palaeoclimatic ex-periments as it allows to simulate time-slices of several cen-turies on modern computing facilities. The analysis of a 1000-year control simulation shows an overall good skill in simulating today’s climatology and interannual variabil-ity (Min et al., 2005a). The El Ni˜no Southern Oscillation (ENSO) and the North Atlantic Oscillation (NAO) are also simulated reasonably well (Min et al., 2005b).
Fischer-Bruns et al. (2005) analysed midlatitude storm ac-tivity based on wind speed thresholds in ECHO-G simula-tions with historical and climate change forcing. For the cli-mate change experiments with a strong increase in green-house gas concentrations (IPCC SRES A2 and B2) they found a poleward shift in all three storm track regions and increasing activity over the North Atlantic.
2.2 The experiments
The simulations are performed as equilibrium experiments with constant boundary conditions. Therefore the simulated temporal climate variations are only caused by the nonlin-ear internal dynamics of the climate model. The orbital pa-rameters and greenhouse gas concentrations have been set to values of 125 kyr BP and 115 kyr BP (hereafter EEM and GI). Orbital parameters have been calculated according to Berger (1978). Greenhouse gas concentrations (CO2, CH4,
N2O) have been adapted to values obtained from Vostok ice
Table 1. Orbital parameters and greenhouse gas concentrations of
the simulations. Orbital parameters are calculated following Berger (1978). The angle of perihelion refers to vernal equinox. Green-house gas concentrations are based on Vostok ice cores (CO2and CH4: Petit et al., 1999; N2O: Sowers, 2001)
125 kyr BP 115 kyr BP preindust.
EEM GI PI Eccentricity 0.0400 0.0414 0.0167 Obliquity [◦] 23.79 22.41 23.44 Perihelion [◦] 127.3 290.9 282.7 CO2[ppmv] 270 265 280 CH4[ppbv] 630 520 700 N2O [ppbv] 260 270 265 CFCs [ppbv] 0 0 0
cores (Petit et al., 1999; Sowers, 2001). Concentrations of chlorofluorocarbons (CFCs) are set to zero. The models de-fault values are retained for all the remaining boundary con-ditions, i.e. present-day conditions are used. A third simu-lation with preindustrial conditions is used for comparison (hereafter PI). We did not select a present-day simulation, as greenhouse gas concentrations of the preindustrial simu-lation are very similar to the values in the Eemian and there-fore the simulated anomalies can be attributed more clearly to insolation change. All parameters are shown in Table 1. All simulations have been initialized with the same oceanic state, i.e. potential temperature and salinity calculated from the Levitus et al. (1994) climatology.
3 Results
3.1 General behaviour of the simulations
The simulations have been performed for at least 2000 years. During the first ≈100 years all simulations are dominated by similar initial trends that are related to adaptations of the ocean circulation. In this period global mean near sur-face temperature rises by approx. 0.4 K. Most features of the oceanic circulation reach quasi-stationary conditions af-ter approx. 150 years in all three simulations. Afaf-ter this ini-tial phase the simulations of the preindustrial and the Eemian climate are relatively stable. In the simulation for 115 kyr BP a significant long-term cooling trend occurs which is connected with an expansion of perennial snow-covered ar-eas over northern parts of North America and an incrar-ease in northern hemispheric sea ice volume.
For the further analysis we selected an interval of 100 years during the early part of the simulations starting 300 years after the beginning of the simulations. This period was selected, because the simulations have already reached their equilibrium, but the perennial snow-covered areas over North
Fig. 2. Winter (DJF) near-surface temperature difference [K] between the EEM simulation and the PI simulation.
Fig. 3. Winter (DJF) near-surface temperature difference [K] between the GI simulation and the PI simulation.
America are still very limited. Therefore the structure of the simulated patterns are mainly influenced by the orbital con-figuration, whereas the land surface conditions are compara-ble. Anomalies are shown relative to the same interval of the preindustrial simulation.
The changes in the latitude and season dependent distri-bution of insolation combined with the feedbacks of the cli-mate system, especially sea ice, result in a modification of the meridional temperature gradients. These have a strong impact on strength and location of the winter storm tracks. Summer temperatures directly react to the strong changes of the high northern insolation, i.e. they are significantly higher for 125 000 yr BP and significantly lower for 115 000 yr BP. This temperature change is especially strong on the conti-nental areas. In contrast to that, winter temperatures are mainly influenced by indirect effects, namely a combina-tion of changes in the large-scale atmospheric circulacombina-tion, the meridional ocean circulation and summer-season induced changes in sea ice. Winter insolation is reduced at 125 000 yr BP (cf. Fig. 1), leading to distinct temperature reductions
over North America and the lower northern latitudes (com-pared to the preindustrial simulation). The temperature re-duction over North America is stronger than over Siberia, as southward advection of polar air enhances the effect of the re-duced insolation. However, temperatures are higher in large parts of the Arctic ocean, as a result of reduced sea ice cov-erage (Fig. 2), which is in turn a result of the increased sum-mer insolation. A strong temperature increase is simulated for north-east Europe. In that region increased advection of oceanic heat due to stronger westerly winds leads to a strong winter warming (Kaspar and Cubasch, 2007). The simulated seasonal temperature patterns over Europe are in good agree-ment with pollen-based temperature reconstructions (Kaspar et al., 2005).
For 115 000 yr BP winter insolation was increased on al-most all latitudes. However, the temperatures of the Arctic ocean are reduced, as they are dominated by the influence of the increased sea ice coverage (again a result of the reduced summer insolation; Fig. 3). Increased temperatures occur in a region in the north-west of the North Atlantic. This effect
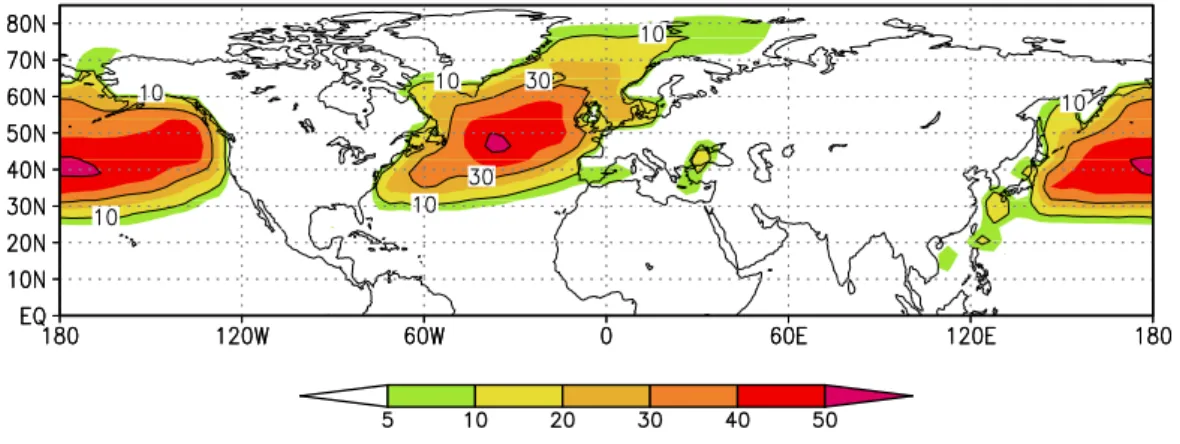
Fig. 4. Winter storm tracks of the preindustrial simulations [Pa], calculated as standard deviation of the filtered sea level pressure.
Fig. 5. Winter storm tracks of the preindustrial simulations [gpm], calculated as standard deviation of the filtered geopotential height at
500 hPa.
is caused by an enhanced North Atlantic current in this sim-ulation, which is a consequence of the stronger annual mean meridional temperature gradient.
A detailed description of general features of these simula-tions can be found in Kaspar and Cubasch (2007).
3.2 Winter storm tracks in the preindustrial simulation Following Blackmon (1976), storm tracks are often quanti-fied by the variability of the bandpass (typically 2.5–6 or 2.5– 8 days) filtered geopotential height (GPH) fields at 500 hPa. Alternatively the calculation of storm tracks can be per-formed based on sea level pressure (SLP). As a change in insolation directly influences surface conditions, we analysed the storm tracks based on SLP. In order to evaluate if the sim-ulated changes persist at higher levels we also applied the analysis for 500 hPa. We used a Butterworth bandpass filter (Hoffmann, 1999) with cut-off periods of 2.5 and 8 days and applied it to the time series of the 12-hourly SLP and GPH (at 500 hPa) fields. Based on this filtered time series we
cal-culated the standard deviation for each grid point based on the winter seasons (DJF). Storm tracks are then represented by the regions with high values of this standard deviation.
Figure 4 shows the results for the preindustrial simulation. The maximum of the SLP-based Atlantic storm track is lo-cated at around 53◦W and 52◦N. The maximum of the
Pa-cific storm track is located at around 175◦E and 48◦N (SLP).
The general structure and location of the storm tracks is quite well reproduced compared to ECMWF re-analyses data (see for example Kageyama et al., 1999). When storm tracks are calculated based on geopotential height (at 500 hPa) the max-ima lie approx. 5◦further south (Fig. 5). Moreover a third
maximum is pronounced over central Asia that is also known from reanalysis data and is often called the Siberian storm track (e.g. Hoffmann, 1999).
3.3 Winter storm tracks during the Eemian
Figure 6 shows the SLP-based winter storm tracks in the sim-ulation for 125 kyr BP as differences from the preindustrial
Fig. 6. Eemian winter storm track anomaly [Pa] at 125 kyr BP (EEM-PI) calculated based on sea level pressure as in Fig. 4.
Fig. 7. Eemian winter storm track anomaly [gpm] at 125 kyr BP (EEM-PI) calculated based on geopotential height as in Fig. 5.
simulation. The figure indicates a significant strengthening and northward shift of the Atlantic storm track. The region with activity greater than 700 Pa also extends further east-ward. In a large region close to the maximum of the North Atlantic storm track at around 60◦N changes exceed 50 Pa.
In this region the relative change is around 10%.
Storm track activity is also enhanced over the North Amer-ican continent, including Alaska. The Pacific storm track is weakened mainly in its western part (120◦E to 180◦E).
Its eastern part in the region of Alaska is shifted north-ward. Over the Asian continent the activity is reduced, as well as over the Mediterranean region (by about more than 20 Pa over large areas). When the analysis is done based on geopotential height at 500 hPa, the spatial distribution of the anomalies is similar but more zonally oriented (Fig. 7). Anomalies exceed 6 gpm over the Atlantic. The weakening of the Pacific storm track is more distinct at this height.
There is a strong linkage between the simulated changes in storm tracks and the differences in the meridional tem-perature gradients (cf. Fig. 2). Reduced winter
tempera-tures over the high latitudes of the western part of the North Atlantic and North America are responsible for a stronger temperature gradient in these regions at 125 kyr BP, which in turn enhances storm track activity in both regions. For Asia a temperature reduction is simulated for the southern part, whereas slightly higher temperatures occur in the Arc-tic ocean. In combination, the merdional temperature gra-dient over Asia is reduced and a coinciding reduction in storm track activity (weaker Siberian storm track) is simu-lated for the northern part of the continent (north of 50◦N).
Over the Mediterranean region the winter temperature gra-dient is reduced compared to the preindustrial case for two reasons: over Northern Africa, reduced winter temperatures are simulated mainly because of reduced insolation. Over north-eastern Europe higher winter temperatures are caused by enhanced westerly winds and reduced sea-ice coverage. Consistently, reduced storm track activity is simulated for the Mediterranean region.
At 115 kyr BP the change in SLP-based storm track ac-tivity is approx. complementary compared to 125 kyr BP,
Fig. 8. Winter storm track anomaly [Pa] at 115 kyr BP (GI-PI) calculated based on sea level pressure as in Fig. 4.
but not as strong (Fig. 8). The western part of the Atlantic storm track is shifted slightly southward and it has a re-duced strength especially at its eastern part. The reduction is about >20 Pa east of 30◦E. In this region the relative change
is around 5%. In total, this results for the Atlantic storm track in a more east-west-oriented structure of the changes as compared to the EEM case. Storm track activity over the north-western parts of North America is reduced by a simi-lar amount. The Pacific storm track activity is increased at its eastern part, whereas the change over Asia is relatively small. A distinct increase of activity also occurs in an area extend-ing from the eastern Mediterranean to approx. 75◦E. As in
the EEM case, the anomalies have a stronger zonal structure when calculated based on geopotential height at 500 hPa (not shown).
Again, the strong changes over North America are consis-tent to the temperature changes caused by the increased sea ice coverage in the Arctic. The southward shift of the At-lantic storm track is coherent to the increased temperatures over the western part of the North Atlantic. Relatively weak changes occur over Asia. Here temperature changes are also comparatively small. The temperature decrease over the Arc-tic ocean close to Siberia does not result in a significant mod-ification of storm track activity over Asia.
Although for both simulations a strong relation between changes in meridional temperature gradients and storm tracks has been found, it should be noted that other mech-anisms could have an impact on them, as e.g. latent heat re-lease (Hoffmann, 1999).
To test the robustness of the results, we performed the same analysis for additional 100-year intervals (years: 200– 299 and 400–499). This test showed that the spatial pattern of the simulated changes is independent of the selected interval for the EEM simulation. In the GI case, the spatial structure of the results for the North Atlantic and the Mediterranean are also robust. However, significant differences between the intervals occur for Alaska, the Western Pacific as well as for
the Arctic north of East Asia and Alaska. These differences between the intervals are related to the long-term expansion of the sea-ice in the simulation of the glacial inception (GI). During the selected periods strong changes in winter sea-ice are simulated for the eastern Beaufort Sea and the Sea of Okhotsk. These changes influence the storm track activity in the mentioned adjacent regions.
3.4 Change in extreme wind speed and precipitation Storm tracks are closely related to other climatic parameters that could be relevant for the interpretation of palaeoclimatic data, as for example precipitation or the number of storm days (e.g. Raible et al., 2007). These two will be discussed in this section.
The frequency of extreme wind events is an alternative measure for storm activity. Fischer-Bruns et al. (2005) anal-ysed storm activity of an ECHO-G simulation by counting the number of winter days reaching or exceeding a mini-mum 10 m wind speed within a grid box. As threshold they used the lower limit of the WMO Beaufort wind speed scale of 8 Bft (17.2 ms−1). Here we apply the same method and
threshold. The wind speed is calculated by the model ev-ery 30 min. The 10 m wind is interpolated between the low-est model level and the surface according to the logarithmic wind profile based on a modified roughness length. At each grid point the maximum value is determined for each day.
As Fig. 9 indicates for the preindustrial case, the area where this wind speed is exceeded is almost solely restricted to the oceans. An annual average value of 50 storm days for the winter season (DJF) is exceeded in a small region over the Atlantic as well as over the Pacific. The maximum over the Atlantic is located at 37◦W/47◦N. Over the Pacific it is
located at 175◦W/40◦N.
The change of the frequency of winter storm days is shown in Fig. 10 for the EEM simulation. The North Atlantic north of 45◦N is affected by an increase in the frequency, with the
Fig. 9. Frequency of storm days (number of days with maximum daily 10m wind speed reaching or exceeding the lower threshold of 8 Bft)
per winter season in the preindustrial simulation.
Fig. 10. Change in the average number of storm days (defined as in Fig. 9) per winter season in the simulation for 125 kyr BP (EEM-PI).
strongest changes in the eastern part at around 55◦N. The
increase in this region in the neighbourhood of the British Isles is of about 6 storm days, which is an increase of around 20% compared to the preindustrial simulation (Fig. 9). The European coastal regions from France to Norway are affected by an increase of at least 2 storm days. A belt with a reduced number of storm days is visible at around 30◦N. In total, the
changes on the North Atlantic indicate a north-eastward shift of the regions with frequent storm days. This is consistent with the shift of the storm tracks described in the previous section. The results for the Pacific also reflect the pattern of changes in storm track activity.
In the case of the GI simulation (Fig. 11) the general structure of the changes is also roughly consistent with the changes of the storm tracks. On the eastern Atlantic the fre-quency is reduced between latitudes 35◦N and 70◦N. The
decrease reaches 4 days in some areas. The western part of the North Atlantic is affected by an increase in storm fre-quency (north of 30◦N). Over the north-western North
At-lantic this increase occurs in a region with decreased storm
track activity. However, the change of activity in this region is relatively small (cf. Fig. 8). A northward shift of the storm frequency occurs over the Pacific.
The Figs. 12 and 13 show the simulated change of win-ter precipitation for EEM and GI as ratios to the simulated preindustrial precipitation. A strong change in precipitation is visible for many regions of the North Atlantic and Europe that are affected by the described changes in storm track ac-tivity. In case of the EEM simulation, a large region is af-fected by a precipitation increase of around 10%. This region includes Iceland, the British Isles and Scandinavia. It also in-cludes the European continent north of 55◦N and extends up
to 80◦N. In general, for most oceanic and coastal regions
be-tween 30◦N and 70◦N the change in winter precipitation is
roughly consistent with the change in storm track activity. In case of the GI simulation the simulated changes in mid-latitudinal winter precipitation are less strong (Fig. 13). Compared to the preindustrial simulation, the relative change is smaller than 5% for most continental areas and the Pacific north of 40◦N. Although a small decrease in the order of
Fig. 11. Change in the average number of storm days (defined as in Fig. 9) per winter season in the simulation for 115 kyr BP (GI-PI).
Fig. 12. Winter precipitation anomaly in the EEM simulation as ratio relative to the preindustrial simulation (EEM/PI).
5% is simulated for the European Atlantic coast, the Euro-pean continent does not experience strong changes in winter precipitation. Distinct changes in precipitation are simulated for the Atlantic ocean, whereas the changes on the mid- and high latitudes of the Pacific are comparatively small. The simulated changes in precipitation over the Atlantic show a west-east-structure in rough consistency with the changes in storm track activity: Decreased precipitation in the eastern part of the Atlantic and an increase in the western part at around 35◦N is consistent with the changes in storm tracks
as in Fig. 8. However, in the north-western part of the At-lantic an increase of precipitation is simulated, which is in contrast to the slight decrease in storm track activity, but in consistency with the changes in the number of storm days (Fig. 11).
4 Summary and conclusions
Anomalies of northern hemispheric winter storm tracks as a measure for synoptic-scale activity have been analysed for
simulations with orbital forcing of two phases of the Eemian interglacial: The Eemian warm phase at 125 kyr BP and the subsequent glacial inception at 115 kyr BP. The strongest simulated change in storm track activity occurred in the sim-ulation for 125 kyr BP namely a significant northward shift of the axis of the North Atlantic storm track, combined with a general increase in activity especially downstream of the storm track maximum. For 115 kyr BP the changes are of op-posite sign, but less strong. The frequency of storm days has been used to identify regions with intense storm activity. As with that measure similar regions of strongest change have been identified, it can be concluded that this is a robust con-clusion. It has also been shown that the results are indepen-dent of the selected height, i.e. performing the analysis based on sea level pressure or geopotential height at 500 hPa led to the same conclusions. In case of the warm phase, the results are also independent of the selected interval. As a long-term cooling trend occurs in the simulation of the glacial incep-tion, the simulated storm track activity is not stable in all re-gions for that simulation. However, for the North Atlantic the results are independent of the selected interval. One caveat is
Fig. 13. Winter precipitation anomaly in the GI simulation as ratio relative to the preindustrial simulation (GI/PI).
that the results are only based on one single coupled model with a relatively coarse resolution. The reproduction of ex-treme wind speeds by climate models significantly improves with higher spatial and temporal resolution, esp. in coastal areas (Leckebusch and Ulbrich, 2004).
The results show, that the changes in storm tracks are in line with the changes in the meridional winter temperature gradients. For Europe these simulated changes in the tem-perature gradient have been compared with proxy-data in an earlier study (Kaspar et al., 2005). As in that study it has been shown that the simulated seasonal patterns of the tem-perature anomalies are in good agreement with pollen-based reconstructions, we can assume at least for this region that changes in temperature gradients are simulated realistically.
The question whether the Eemian could be used as ana-logue for a warmed future climate has been a matter of de-bate (see for example Mearns et al., 2001). Analyses of storm tracks with GCMs under greenhouse gas scenarios show sim-ilar spatial patterns in storm tracks as simulated here for the Eemian at 125 kyr BP: Based on a tracking analysis Bengts-son et al. (2006) found a similar distribution of changes for a future climate change scenario simulation with the cou-pled GCM ECHAM5/MPI-OM: indications for a northward shift, a weakening of the Mediterranean storm track and a strengthening north of the British Isles (for IPCC-SRES-scenario A1B). These pattern agrees with the findings in Sect. 3.3 (cmp. also Fig. 6). For the same model Pinto et al. (2007) found mainly a large increase in storm track activity at 500 hPa over Western Europe. Yin (2005) analysed an en-semble of 21st century simulations performed by 15 coupled climate models and also found a poleward shift and intensifi-cation of the northern hemispheric winter storm track simu-lated by all but four models (for IPCC-SRES-scenario A1B). Fischer-Bruns et al. (2005) calculated the frequency of storm days for an ECHO-G climate change simulation (for IPCC-SRES scenario A2 and B2). Again, the simulated change in frequency of winter storm days shows a similar
structure and order of magnitude as simulated here for the Eemian, with strongest changes in the neighbouring regions of the British Isles. In summary, the results suggest that concerning the shift of winter storm tracks the Eemian in-terglacial reveals a signal similar to future climate scenarios. When comparing Eemian and future changes in storm tracks, it has to be noted that the forcings have different spa-tial and seasonal structure. The similarity in the simulated changes in storm tracks does not occur because the forcing itself is similar, but because of the similar consequences on meridional gradients of the near-surface temperature of the winter months.
Changes in North Atlantic storm tracks contribute to changes in European precipitation. Information on this could be relevant for the interpretation of palaeoclimatic proxies. Our results suggest that an increase in winter precipitation does mainly occur in the northern parts of Europe at 125 kyr BP (north of 55◦N). For southern Europe and for 115 kyr BP
the changes in winter precipitation are comparatively small.
Acknowledgements. This work has been performed within the
German Climate Research Program DEKLIM of the German Min-istry for Education and Research (BMBF). The simulations have been run on the NEC SX-6 supercomputer of the German Climate Computing Centre (DKRZ, Hamburg). We thank H. Wernli and an anonymous reviewer for their comments that helped to improve the manuscript.
Edited by: J. Hargreaves
References
Bengtsson, L., Hodges, K. I., and Roeckner, E.: Storm tracks and climate change, J. Climate, 19, 3518–3543, 2006.
Berger, A. L.: Long-term variations of daily insolation and Quar-ternary climate changes, J. Atmos. Sci., 35, 2362–2367, 1978.
Berger, A. L.: Milankovitch theory and climate, Rev. Geophys., 26, 624–657, 1988.
Berger, A. L., Loutre, M.-F., Kaspar, F., Lorenz, S. J.: Insolation during interglacials. In: F. Sirocko, T. Litt, M. Claussen, M. F. S´anchez-Go˜ni (eds.): The Climate of Past Interglacials, Devel-opments in Quaternary Sciences, Volume 7, Chapter 4, 13–27, Elsevier, 2007.
Blackmon, M. L.: A climatological spectral study of the 500 mb geopotential height of the Northern Hemisphere, J. Atmos. Sci., 33, 1607–1623, 1976.
Blackmon, M. L., Wallace, J. M., Lau, N.-C., and Mullen, S. J.: An observational study of the northern hemisphere wintertime circulation, J. Atmos. Sci., 34, 1040–1053, 1977.
Charney, J. G.: The dynamics of long waves in a baroclinic westerly current, J. Meteorol., 4, 135–162, 1947.
Fischer-Bruns, I., von Storch, H., Gonz´ales-Rouco, J. F., and Zorita, E.: Modelling the variabiliy of midlatitude storm activity on decadal to century time scales, Clim. Dyn., 25 (5), 461–476, 2005.
Gallimore, R. G. and Kutzbach, J. E.: Role of orbitally induced changes in tundra area in the onset of glaciation, Nature, 381, 503–505, 1996.
Hall, N. M., Dong, B., and Valdes, P. J.: Atmospheric equilib-rium, instability and energy transport at the last glacial maxi-mum, Clim. Dyn., 12, 497–511, 1996.
Hall, N. M. and Valdes, P. J.: A GCM simulation of the climate 6000 years ago, J. Climate, 10, 3–17, 1997.
Hibler III, W. D.: A dynamic thermodynamic sea ice model, J. Phys. Oceanogr. 9, 817–846, 1979.
Hoffmann, G.: Die Bedeutung der diabatischen Heizung f¨ur die synoptische St¨orungsaktivit¨at der Nordhemisph¨are im heutigen und in einem zuk¨unftigen Klima. Mitteilungen aus dem Institut f¨ur Geophysik und Meteorologie der Universit¨at zu K¨oln. Heft 126, 1999.
Hoskins, B. J. and Valdes, P. J.: On the existence of storm tracks, J. Atmos. Sci., 47, 1854–1864, 1990.
Hoskins, B. J. and Hodges, K. I.: New perspectives on the northern hemisphere winter storm tracks, J. Atmos. Sci., 59, 1041–1061, 2002.
Jung, T., Gulev, S. K., Rudeva, I., and Soloviov, V.: Sensitivity of extratropical cyclone characteristics to horizontal resolution in the ECMWF model, Q. J. R. Meteorol. Soc., 132, 1839–1858, 2006.
Kageyama, M., Valdes, P. J., Ramstein, G., Hewitt, C., and Wy-putta, U.: Northern hemisphere storm tracks in present day and last glacial maximum climate simulations: A comparison of the European PMIP models, J. Climate, 12, 742–760, 1999. Kaspar, F. and Cubasch, U.: Simulations of the Eemian
inter-glacial and the subsequent inter-glacial inception with a coupled ocean-atmosphere general circulation model, in: The Climate of Past Interglacials, edited by: Sirocko, F., Litt, T., Claussen, M., S´anchez-Go˜ni, M. F., Developments in Quaternary Sciences, 7, Chapter 33, 499–515, Elsevier, 2007.
Kaspar, F., K¨uhl, N., Cubasch, U., and Litt, T.: A model-data-comparison of European temperatures in the Eemian interglacial, Geophys. Res. Lett., 32, L11703, doi:10.1029/2005GL022456, 2005.
Khodri, M., Leclainche, Y., Ramstein, G., Braconnot, P., Marti, O., and Cortijo, E.: Simulating the amplification of orbital forcing
by ocean feedbacks in the last glaciation, Nature, 410, 570–574, 2001.
Knippertz, P., Ulbrich, U., and Speth, P.: Changing cyclones and surface wind speeds over the North Atlantic and Europe in a tran-sient GHG experiment, Clim. Res., 15, 109–122, 2000. Kukla, G. J., Bender, M. L., de Beaulieu; J. L., Bond, G., Broecker,
W. S., Cleveringa, P., Gavin, J. E., Herbert, T. D., Imbrie, J., Jouzel, J., Keigwin, L. D., Knudsen, K. L., McManus, J. F., Merkt, J., Muhs, D. R., and M¨uller, H.: Last Interglacial Cli-mates, Quart. Res., 58, 2–13, 2002.
Leckebusch, G. C. and Ulbrich, U.: On the relationship between cy-clones and extreme windstorm events over Europe under climate change. Global and Planetary Change, 44, 181–193, 2004. Legutke, S. and Maier-Reimer, E.: Climatology of the HOPE-G
Global Ocean - Sea Ice General Circulation Model, Technical Report 21, Deutsches Klimarechenzentrum, Hamburg, Germany, 1999.
Legutke, S. and Voss, R.: The Hamburg Atmosphere-Ocean Coupled Circulation Model ECHO-G. Technical Report 18, Deutsches Klimarechenzentrum, Hamburg, 1999.
Levitus, S., Burgett, R., and Boyer, T. P.: World Ocean Atlas. Vol. 3, Salinity and Vol. 4, Temperature. NOAA Atlas NESDIS 3/4, U. S. Government Printing Office, Washington, DC, 1994. Mearns, L. O., Hulme, M., Carter, T. R., Leemans, R., Lal, M., and
Whetton, P.: Climate Scenario Development, in: Climate Change 2001: The Scientific Basis, edited by: Houghton, J. T., Ding, Y., Griggs, D. J., et al., Chapter 13, 739–768, Cambridge University Press, New York, 2001.
Min, S.-K., Legutke, S., Hense, A., and Kwon, W.-T.: Internal vari-ability in a 1000-year control simulation with the coupled climate model ECHO-G. Part I: near surface temperature, precipitation, and mean sea level pressure, Tellus A 57(4), 605–621, 2005a. Min, S.-K., Legutke, S., Hense, A., and Kwon, W.-T.: Internal
vari-ability in a 1000-year control simulation with the coupled climate model ECHO-G. Part II: ENSO and NAO, Tellus A 57(4), 622– 640, 2005b.
Petit, J. R., Jouzel, J., Raynaud, D., Barkov, N. I., Barnola, J. M., Basile, I., Bender, M., Chapellaz, J., Davis, J., Delaygue, G., Delmotte, M., Kotlyakov, V. M., Legrand, M., Lipenkov, V. M., Lorius, C., Pepin, L., Ritz, C., Saltzman, E., and Stievenard, M.: Climate and atmospheric history of the past 420 000 years from the Vostok ice core, Nature, 399, 429–436, 1999.
Pinto, J., Spangehl, T., Ulbrich, U., and Speth, P.: Sensitivities of a cyclone detection and tracking algorithm: individual tracks and climatology, Meteorologische Zeitschrift, 14, 823–838, 2005. Pinto, J., Ulbrich, U., Leckebusch, G., Spangehl, T., Reyers, M.,
and Zacharias, S.: Changes in storm track and cyclone activity in three SRES ensemble experiments with the ECHAM5/MPI-OM1 GCM, Clim. Dyn., in press, doi:10.1007/s00382-007-0230-4, 2007.
Raible, C. C., Yoshimori, M., Stocker, T. F., and Casty, C.: Extreme midlatitude cyclones and their implications for precipitation and wind speed extremes in simulations of the Maunder Minimum versus present day conditions, Clim. Dyn., 28, 409–423, 2007. Roeckner, E., Arpe, K., Bengtsson, L., Brinkop, S., D¨umenil, L.,
Esch, M., Kirk, E., Lunkeit, F., Ponater, M., Rockel, B., Sausen, R., Schlese, U., Schubert, S., and Windelband, M.: Simula-tion of the present-day climate with the ECHAM model: Impact of model physics and resolution. Report No. 93,
Max-Planck-Institute for Meteorology, Hamburg, Germany, 1992.
Sowers, T.: N2O record spanning the penultimate deglaciation from the Vostok ice core. J. Geophys. Res.-Atmos., 106(D23), 31 903– 31 914, 2001.
Stendel, M. and Roeckner, E.: Impacts of horizontal resolution on simulated climate statistics in ECHAM4. Report No. 253, Max-Planck-Institute for Meteorology, Bundesstr. 55, Hamburg, Ger-many, 1998.
Vettoretti, G. and Peltier, W. R.: Sensitivity of glacial inception to orbital and greenhouse gas climate forcing, Quat. Sci. Rev., 23, 499–519, 2004.
Wernli, H. and Schwierz, C.: Surface cyclones in the ERA-40 dataset (1958-2001). Part I: Novel identification method and global climatology, J. Atmos. Sci., 63, 2486–2507, 2006. Wolff, J. O., Maier-Reimer, E., and Legutke, S.: The Hamburg
Ocean Primitive Equation Model HOPE. Technical Report No. 13, Deutsches Klimarechenzentrum, Hamburg, Germany, 1997. Yin, J. H.: A consistent poleward shift of the storm tracks in
simu-lations of 21st century climate, Geophys. Res. Lett., 32, L18701, doi:10.1029/2005GL023684, 2005.


![Fig. 2. Winter (DJF) near-surface temperature difference [K] between the EEM simulation and the PI simulation.](https://thumb-eu.123doks.com/thumbv2/123doknet/14798674.605060/5.892.156.742.102.326/fig-winter-djf-surface-temperature-difference-simulation-simulation.webp)
![Fig. 4. Winter storm tracks of the preindustrial simulations [Pa], calculated as standard deviation of the filtered sea level pressure.](https://thumb-eu.123doks.com/thumbv2/123doknet/14798674.605060/6.892.149.742.100.323/winter-preindustrial-simulations-calculated-standard-deviation-filtered-pressure.webp)
![Fig. 6. Eemian winter storm track anomaly [Pa] at 125 kyr BP (EEM-PI) calculated based on sea level pressure as in Fig](https://thumb-eu.123doks.com/thumbv2/123doknet/14798674.605060/7.892.150.742.100.325/eemian-winter-storm-track-anomaly-calculated-based-pressure.webp)
![Fig. 8. Winter storm track anomaly [Pa] at 115 kyr BP (GI-PI) calculated based on sea level pressure as in Fig](https://thumb-eu.123doks.com/thumbv2/123doknet/14798674.605060/8.892.149.743.99.327/winter-storm-track-anomaly-calculated-based-level-pressure.webp)