HAL Id: hal-00295222
https://hal.archives-ouvertes.fr/hal-00295222
Submitted on 3 Feb 2003
HAL is a multi-disciplinary open access
archive for the deposit and dissemination of
sci-entific research documents, whether they are
pub-lished or not. The documents may come from
teaching and research institutions in France or
abroad, or from public or private research centers.
L’archive ouverte pluridisciplinaire HAL, est
destinée au dépôt et à la diffusion de documents
scientifiques de niveau recherche, publiés ou non,
émanant des établissements d’enseignement et de
recherche français ou étrangers, des laboratoires
publics ou privés.
Ground-based intercomparison of two isoprene
measurement techniques
E. Leibrock, L. G. Huey, P. D. Goldan, W. C. Kuster, E. Williams, F. C.
Fehsenfeld
To cite this version:
E. Leibrock, L. G. Huey, P. D. Goldan, W. C. Kuster, E. Williams, et al.. Ground-based
inter-comparison of two isoprene measurement techniques. Atmospheric Chemistry and Physics, European
Geosciences Union, 2003, 3 (1), pp.67-72. �hal-00295222�
www.atmos-chem-phys.org/acp/3/67/
Chemistry
and Physics
Ground-based intercomparison of two isoprene measurement
techniques
E. Leibrock1,2,*, L. G. Huey3, P. D. Goldan1,2, W. C. Kuster1,2, E. Williams1,2, and F. C. Fehsenfeld1,2
1Aeronomy Laboratory, Environmental Research Laboratories, NOAA, Boulder, Colorado, USA
2Cooperative Institute for Research in Environmental Sciences, University of Colorado, Boulder, Colorado, USA
3School of Earth and Atmospheric Sciences, Georgia Institute of Technology, Atlanta, Georgia, USA
*present address: The Boston Consulting Group, Ludwigstraße 21, D–80539 M¨unchen, Germany
Received: 11 March 2002 – Published in Atmos. Chem. Phys. Discuss.: 24 June 2002 Revised: 22 December 2002 – Accepted: 22 December 2002 – Published: 3 February 2003
Abstract. An informal intercomparison of two isoprene
(C5H8) measurement techniques was carried out during Fall
of 1998 at a field site located approximately 3 km west of Boulder, Colorado, USA. A new chemical ionization mass spectrometric technique (CIMS) was compared to a well-established gas chromatographic technique (GC). The CIMS technique utilized benzene cation chemistry to ionize iso-prene. The isoprene levels measured by the CIMS were often larger than those obtained with the GC. The results indicate that the CIMS technique suffered from an anthropogenic in-terference associated with air masses from the Denver, CO metropolitan area as well as an additional interference occur-ring in clean conditions. However, the CIMS technique is also demonstrated to be sensitive and fast. Especially after introduction of a tandem mass spectrometric technique, it is therefore a candidate for isoprene measurements in remote environments near isoprene sources.
1 Introduction
Isoprene is a C5H8hydrocarbon that is emitted in large
quan-tities by deciduous trees and other plant species, (e.g. Singh and Zimmerman, 1992; Steinbrecher, 1997). Isoprene reacts at the gas kinetic rate with the OH radical and has an atmo-spheric lifetime of approximately two hours during the day. Consequently, isoprene plays an important role in the pro-duction of secondary pollutants such as ozone, PAN, and CO (Atkinson, 1990; Montzka et al., 1993). Isoprene mixing ra-tios in the lower atmosphere vary from a few pptv to several ppbv and depend on factors such as land use, season, and temperature. Isoprene also reacts with ozone, which provides an important loss mechanism during the night. A detailed review of the atmospheric chemistry of isoprene as well as Correspondence to: E. Leibrock ([email protected])
estimates of the global emissions is given in Fehsenfeld et al. (1992).
In order to better understand oxidant formation on local and regional scales, reliable airborne measurements of the temporal and spatial distribution of isoprene are needed, re-quiring senitive, fast time response (t ∼1 s) techniques. We developed a chemical ionization mass spectrometric method (CIMS) for the detection of isoprene in ambient air (Leibrock and Huey, 2000). CIMS techniques are generally known for their high time resolution and good sensitivity and have been applied to measure a number of different trace gases, includ-ing nitric and formic acid (Huey and Lovejoy, 1996), OH (Eisele et al., 1994), ammonia, acetonitrile, acetone (Arnold and Hauck, 1985), and various other organic compounds (Hansel et al., 1995); (Lindinger and Hansel, 1997). The goal of this study is to characterize the CIMS isoprene measure-ment by comparison with a well-established gas chromato-graphic (GC) technique (Goldan et al., 2000).
2 Experimental section
2.1 Intercomparison location and time frame
Isoprene measurements were performed on 18, 29, and 30 September and 01 October 1998 at the Enchanted Mesa field site located ∼3 km west of Boulder, Colorado at 1770 m above mean sea level in the foothills of the Rocky Moun-tains at the northwest edge of the Denver metropolitan area. At this location mixing ratios of VOCs such as isoprene can vary by orders of magnitude within a short time frame. These variations are primarily due to wind speed and direction and to a lesser extent to other factors such as temperature and precipitation. When the wind is from the west, clean air with low isoprene mixing ratios is transported to the site from the mountains. When the wind is from the urban ar-eas to the south or ar-east, large VOC loadings and high
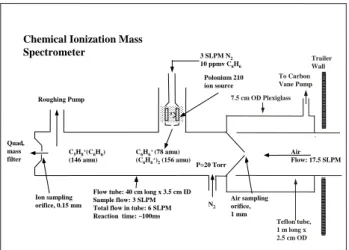
lev-68 E. Leibrock et al.: Intercomparison of two isoprene measurement techniques a Polonium 210 ion source Air sampling orifice, 1 mm Ion sampling orifice, 0.15 mm Quad. mass filter . 3 SLPM N2 10 ppmv C6H6 C6H6+ (78 amu) (C6H6+)2(156 amu) N2 Roughing Pump P=20 Torr
Flow tube: 40 cm long x 3.5 cm ID Sample flow: 3 SLPM Total flow in tube: 6 SLPM Reaction time: ~100ms C5H8+(C6H6)
(146 amu)
Air Flow: 17.5 SLPM Chemical Ionization Mass
Spectrometer To Carbon Vane Pump Trailer Wall Teflon tube, 1 m long x 2.5 cm OD 7.5 cm OD Plexiglass
Fig. 1. Simplified schematic drawing of the chemical ionization
mass spectrometer (CIMS).
els of other pollutants such as nitrogen oxides can be trans-ported to the site. Consequently, the site is well suited for a challenging instrument intercomparison and has been used for this purpose on previous occasions (Fehsenfeld et al., 1998; Williams et al., 1992). Ancillary measurements of a wide range of chemical species and meteorological parame-ters were also performed during the intercomparison.
2.2 CIMS
The CIMS instrument was located in a trailer on the mesa. The air sampling inlet extended horizontally ∼50 cm from the west wall of the trailer at a height of ∼2 m above the ground. The inlet consisted of a 1 m long × 2.5 cm OD Teflon tube in which a flow of 17.5 SLPM (standard liters per minute) was maintained with a carbon vane pump. A small fraction of the total inlet flow, ∼3 SLPM, was sampled into the CIMS. The CIMS consisted of a flow tube reactor that was coupled to a quadrupole mass spectrometer (Fig. 1). The flow tube was equipped with a radioactive ion source
(210Po, NRD) and a 1 mm diameter air sampling orifice. A
total pressure of 20 Torr was maintained in the flow tube by a rotary vane pump. Benzene monomer and dimer cations,
C6H+6 and (C6H+6)2, were synthesized by flowing ∼3 SLPM
of nitrogen doped with ∼10 ppmv benzene vapor through the ion source into the flow tube reactor. The constituents of the sampled air reacted with the benzene cations along the length of the flow tube (reaction time ∼100 ms). The resulting ions were sampled into the mass spectrometer where they were mass filtered and detected with an ion multiplier. The pulses from individual ions were amplified, counted, and stored in a computer.
Isoprene reacted by charge transfer association reaction with the benzene reagent ions (Leibrock and Huey, 2000):
C6H+6 +C5H8→C5H+8(C6H6)
(C6H6)+2 +C5H8→C5H+8(C6H6) +C6H6
Both benzene reagent ions react at collision rate with
isoprene to form the same product ion, C5H+8(C6H6), at
146 amu. Isoprene sensitivity was not affected by ambient humidity levels; water clusters were not observed for either benzene cation (Leibrock and Huey, 2000). Isoprene was
detected by sequentially monitoring masses 78 amu (C6H+6),
156 amu ((C6H6)+2)), and 146 amu (C5H+8(C6H6))for
inte-gration times of 0.33 s, 0.33 s, and 1.65 s, respectively. For the conditions of this study, the ratio of the benzene dimer cation signal (100 kHz) to the benzene monomer cation sig-nal (50 kHz) was ∼2 : 1. The isoprene sigsig-nal was normal-ized to the sum of the reagent ion signals to account for vari-ations in the ion source intensity. The sensitivity of the in-strument was calibrated by performing standard additions of known amounts of isoprene to the inlet flow; calibration lev-els were 190, 1400, 2100, and 3100 pptv. The calibration gas was a gravimetrically prepared 10 ppmv mixture of iso-prene in synthetic air (see below). The background at the isoprene product mass was measured by periodically over-flowing the inlet with dry, isoprene free synthetic air (Scott Specialty Gases). Both, background determinations and cal-ibrations were performed hourly. Mixing ratios of isoprene were obtained by subtracting the linearly interpolated back-ground levels from the normalized isoprene signal and then dividing by the measured calibration factor. The calibration factor was of the order of 2 Hz per pptv of isoprene at a to-tal reagent ion signal of 150 kHz. The measured background signals were 100 – 200 Hz with variations of less than 10 Hz within one day. The detection limit (S/N = 3) for these con-ditions was 21 pptv for a 1 s integration period.
2.3 GC
The GC was housed in a separate trailer on the mesa. Air
samples for the GC were drawn through a 3 m long × 1/400
OD Teflon tube at approximately 12 SLPM. The end of the tube was also located at a height of ∼2 m above the ground within 5 m of the CIMS inlet. The in situ GC method is de-scribed in detail elsewhere (Goldan et al., 2000) and is only briefly outlined here. The GC utilized a 70 SCCM (stan-dard cubic centimeters per minute) fraction of the whole air sample stream, passed it through an Ascarite trap at ambient temperature that removed carbon dioxide and ozone and
sub-sequently through a cold zone held at −50◦C to remove most
of the water. Hydrocarbons in the sample stream were subse-quently concentrated for a 5 minute period in a cold trap that
consisted of a 0.53 mm ID × 20 cm long section of Al2O3
capillary column thermostatted at −170◦C. The concentrated
sample was then injected onto a 0.53 mm ID × 50 m long analytical column of the same material (Chrompack Inc.) by
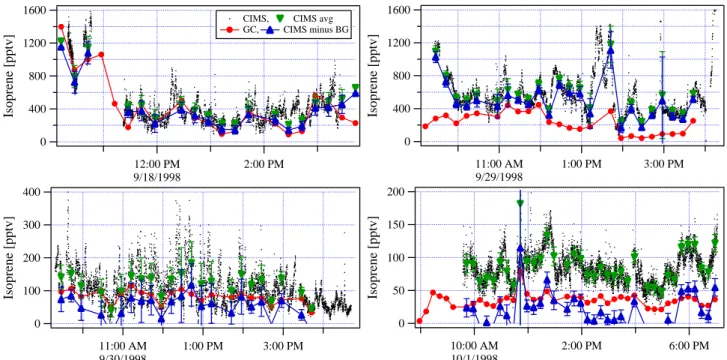
1600 1200 800 400 0 Isoprene [pptv] 12:00 PM 9/18/1998 2:00 PM
CIMS, CIMS avg GC, CIMS minus BG 1600 1200 800 400 0 Isoprene [pptv] 11:00 AM 9/29/1998 1:00 PM 3:00 PM 400 300 200 100 0 Isoprene [pptv] 11:00 AM 9/30/1998 1:00 PM 3:00 PM 200 150 100 50 0 Isoprene [pptv] 10:00 AM 10/1/1998 2:00 PM 6:00 PM
Fig. 2. Diurnal trends of isoprene measured with both instruments (CIMS: black dots, GC: red markers) during the intercomparison period
as well as the CIMS data averaged (green markers) to the GC sampling periods. The CIMS background of about 70 pptv determined from Fig. 3 was substracted from the CIMS averages resulting in the CIMS net signal (blue markers). The error bars on the CIMS data represent the variability (standard deviation) of the CIMS data during the GC sampling interval. Time is Mountain Daylight Time (MDT).
heating the trap to 100◦C in ∼6 s. Analysis was performed
with a hydrogen carrier gas at a flow rate of 4 SCCM while
the column temperature was ramped from 75 to 150◦C at a
rate of 13◦C per min. The detection limit for isoprene
(de-fined as signal to noise ratio = 2) was 5 pptv. The instrument had a 15 minute cycle time allowing the acquisition and anal-ysis of 4 samples per h. Between samples, the water trap was
heated to 50◦C and both it and the Ascarite trap were flushed
with hydrocarbon free “zero air” for cleaning. The sensitivity of the FID was calibrated using gravimetrically prepared cal-ibration standards of isoprene in synthetic air at the 10 ppmv level. For instrument calibration, these standards were di-luted to the 0.1 to 2 ppbv range in a synthetic air matrix, to which ambient levels of carbon dioxide and water vapor were added, by a dynamic dilution system. The same gravimetri-cally prepared calibration standards were used by the CIMS instrument.
2.4 Ancillary measurements
Ancillary measurements of chemical species included NO
(chemiluminescence), NO2 (photolytic conversion /
chemi-luminescence), total reactive nitrogen NOy (gold catalytic
converter / chemiluminescence), and ozone (UV absorption). Wind speed and direction were also measured at the field site from a 10 m tower. The computer clocks for all the mea-surements were synchronized every morning and were found to deviate less than 5 s over the course of a day.
Temper-ature, barometric pressure, and relative humidity were ob-tained from the Mesa Lab Weather Station (1855 m asl) at the National Center for Atmospheric Research located ap-proximately 5 km south of Enchanted Mesa (NCAR, 1998).
3 Results
The CIMS and GC data were compared by averaging the individual 1.65 s CIMS data points over the corresponding 5 min GC sampling period. Figure 2 is a time series plot of the measurements obtained with both instruments as well as the time averaged CIMS data. The error bars on the averaged CIMS data represent the variability (standard deviation) of the CIMS isoprene measurements during the GC sampling period. Figure 3 shows the correlation of all averaged CIMS data with the individual GC measurements. While there is a good overall correlation (R = 0.78), the CIMS isoprene measurements clearly were consistently higher than those made with the GC. The linear regression of all CIMS vs. GC data has a positive intercept of 67 pptv and a slope of 1.57. Intercepts determined for the individual measurement days from 18 September to 01 October were 176 pptv, 341 pptv, 4.5 pptv, and 12 pptv, respectively. These data strongly indi-cate that the CIMS method suffered from an interference that led to over-measurement of isoprene in addition to a potential background problem. In an attempt to characterize the inter-ference, the normalized differences (ND) between the CIMS
70 E. Leibrock et al.: Intercomparison of two isoprene measurement techniques 10 2 4 6 100 2 4 6 1000 2 CIMS [pptv] 10 2 3 4 5 6 7 8 100 2 3 4 5 6 7 8 1000 2 GC [pptv] Linear regression: CIMS=67+1.57GC R=0.78
Fig. 3. Correlation of all GC measurements made during the
in-tercomparison period with the averaged CIMS data. The error bars represent the standard deviation of the CIMS data during the GC sampling intervals. The solid line is the linear regression of CIMS vs. GC data, equation and correlation coefficient R are given in the text box: The intercept of about 70 pptv indicates an enhanced background in the CIMS measurements.
and GC data were compared with both the chemical and me-teorological ancillary measurements. The ND is a measure of the relative deviation between the measurements and is defined as:
ND = [√CIMS] − [GC]
[CIMS][GC],
where [CIMS] and [GC] are the concurrent isoprene mea-surements made by the CIMS and GC, respectively.
Of the meteorological parameters considered, the normal-ized differences were found to have a significant correla-tion only with wind direccorrela-tion (Fig. 4 and 5). Clearly, the ND was largest when the wind was from the south (Fig. 5). On 18 September, a day with relatively high concentrations and good correlation, there was no wind from southerly
di-rections between 140 and 250◦. On 29 September,
how-ever, when concentrations were similarly high, but correla-tion poorer, basically all direccorrela-tions were present. 30 Septem-ber and 01 OctoSeptem-ber, the two days with low isoprene con-centrations, were dominated by northeasterly and northwest-erly winds, respectively; no southnorthwest-erly directions were present at all. The CIMS isoprene measurements are also
remark-ably well correlated with NOxmeasurements (R = 0.7, see
Fig. 6) even though NOx and isoprene have very different
sources. This suggests that the interfering compound to the CIMS measurements and nitrogen oxides were transported to the site from a collocated, anthropogenically influenced source. These findings clearly indicate that the main inter-ference to the CIMS measurement was present in air masses transported from the Denver metropolitan area.
The high variation in the ND in the wind sector from
300 to 350◦ may be due to an additional interference from
the remote, forested areas in the northwest of our measure-ment site. We have demonstrated that 2-methyl-3-butene-2-ol (MBO), a biogenic compound known to be emitted by
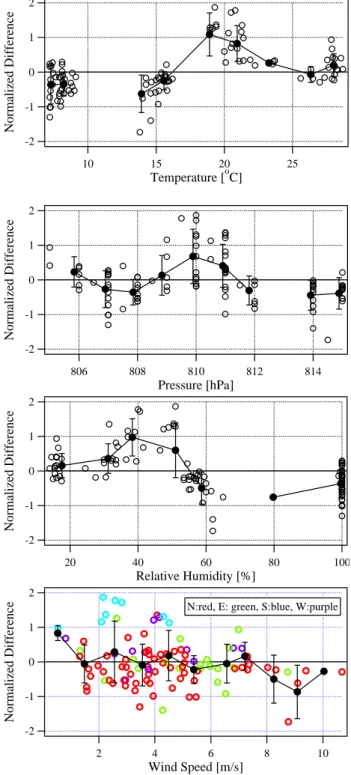
-2 -1 0 1 2 Normalized Difference 25 20 15 10 Temperature [oC] -2 -1 0 1 2 Normalized Difference 814 812 810 808 806 Pressure [hPa] -2 -1 0 1 2 Normalized Difference 100 80 60 40 20 Relative Humidity [%] -2 -1 0 1 2 Normalized Difference 10 8 6 4 2 Wind Speed [m/s]
N:red, E: green, S:blue, W:purple
Fig. 4. Normalized differences of CIMS and GC data versus various
meteorological parameters: temperature, pressure, relative humid-ity, wind speed, and wind direction. The CIMS data were aver-aged over the GC sampling time of 5 min and background corrected (open circles). To better visualize possible trends, the data were grouped into separate bins with a suitably chosen width and aver-aged within each bin (filled circles). The bars show the data vari-ability (standard deviation) within each bin. Temperature, pressure, and relative humidity data were obtained from NCAR (1998).
1.5 1.0 0.5 0.0 -0.5 -1.0 -1.5 Normalized Difference 350 300 250 200 150 100 50 0
Wind Direction [deg]
N:0o, E:90o, S:180o, W:270o
Fig. 5. Normalized differences of CIMS and GC data versus wind
direction (0◦= N, 90◦= E, 180◦= S, 270◦= W).
North American pine forests (Goldan et al., 1993; Harley et al., 1998; Schade et al., 2000) interferes with our isoprene measurement (Leibrock and Huey, 2000). However, without the use of a tandem technique, we cannot yet determine the exact nature of the interfering species.
4 Conclusions
Unfortunately, the data obtained in this study demonstrate that the CIMS technique in its present form is not a viable method for isoprene measurements in or near an urban en-vironment unless there are high levels of isoprene present. This is likely due to unidentified components that also react with the benzene reagent ions to give the same product mass as isoprene.
Basically, any compound with mass 68 amu and an ion-ization potential of less than 9.1 eV is likely to interfere with
our technique. We have demonstrated that C5H8conjugated
dienes (such as t−1,3-pentadiene) and
2-methyl-3-butene-2-ol (MBO) also react with C6H+6 and (C6H6)+2 to give mass
146 (Leibrock and Huey, 2000). However, we could not yet determine if these actually were the interfering species in this work. This study thus demonstrates the largest difficulty with measurements of VOCs by positive ion chemical ionization: the ambient mix of organic compounds in polluted air is so complex that it is difficult for ion chemistry to selectively detect a tractable number of compounds.
The conditions of this intercomparison were very chal-lenging for the CIMS method because of the low isoprene mixing ratios (less than 1 ppbv for most of the time) and the complex mix of VOC at the site due to local urban sources. These considerations suggest that the present CIMS isoprene method may be a viable technique for measurements in re-mote areas with high isoprene emissions and little anthro-pogenic influence. Sensitivity and time response of the tech-nique were also clearly demonstrated in this study (Fig. 2).
One improvement to enhance the selectivity of the current technique would be the replacement of the quadrupole mass
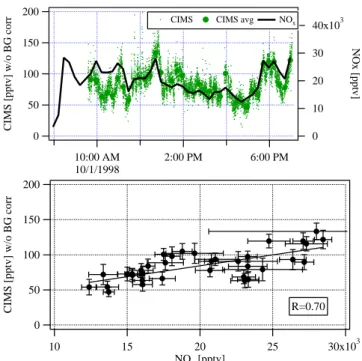
200 150 100 50 0
CIMS [pptv] w/o BG corr
10:00 AM 10/1/1998 2:00 PM 6:00 PM 40x103 30 20 10 0 NOx [pptv]
CIMS CIMS avg NOx
200 150 100 50 0
CIMS [pptv] w/o BG corr
30x103 25 20 15 10 NOx [pptv] R=0.70
Fig. 6. The upper panel shows diurnal trends (01 October 1998) of
non-background corrected isoprene data measured with the CIMS and their 5-min averages (left axis) and NOx(right axis) based on
measurements of NO and NO2with a time resolution of 1 s each,
suggesting a correlation between the data shown. The lower panel shows the linear correlation of the averaged, non-background cor-rected CIMS data versus the corresponding 5-min averages of the NOxvalues.
filter with a system that is capable of tandem mass spectrom-etry such as an ion trap mass spectrometer, (e.g. Dawson, 1976; March and Hughes, 1989). This would add another level of selectivity and allow to differentiate between iso-prene and compounds that form products with equal masses, but have different internal structures.
Acknowledgements. E. L. was supported by a research grant by the
German Academic Exchange Service (DAAD).
References
Arnold, F. and Hauck, G.: Lower stratosphere trace gas detection using aircraft-borne active chemical ionization mass spectrome-try, Nature, 315, 307–309, 1985.
Atkinson, R.: Gas-phase tropospheric chemistry of organic com-pounds, Atmos. Environ., 24, 1–41, 1990.
Dawson, P. H.: Quadrupole mass spectrometry and its application, Elsevier, Amsterdam, 1976.
Eisele, F. L., Mount, G. H., Fehsenfeld, F. C., Harder, J., Marovich, E., Roberts, J., Tanner, D. J., and Trainer, M.: An intercompari-son of tropospheric OH and ancillary trace gas measurements at Fritz Peak Observatory, Colorado, J. Geophys. Res., 99, 18 605, 1994.
72 E. Leibrock et al.: Intercomparison of two isoprene measurement techniques
Fehsenfeld F., Calvert, J., Fall, R., Goldan, P., Guenther, A. B., Hewitt, C. N., Lamb, B., Liu, S., Trainer, M., Westberg, H., and Zimmerman, P.: Emissions of volatile organic compounds from vegetation and the implications for atmospheric chemistry, Global Biogeochemical Cycles, 6, 389–430, 1992.
Fehsenfeld, F. C., Huey, L. G., Sueper, D. T., Norton, R. B., Williams, E. J., Eisele, F. L., Mauldin, III, R. L., and Tanner, D. J.: Ground-based intercomparison of nitric acid measurement techniques, J. Geophys. Res., 103, 3343–3353, 1998.
Goldan, P. D., Kuster, W. C., Fehsenfeld, F. C., and Montzka, S. A.: The observation of a C5alcohol emission in a North American
pine forest, Geophys. Res. Lett., 20, 1039–1042, 1993.
Goldan, P. D., Parrish, D. D., Kuster, W. C., Trainer, M., McKeen, S. A., Holloway, J., Jobson, B. T., and Sueper, D. T.: Airborne measurements of isoprene, CO, and anthropogenic hydrocarbons and their implications, J. Geophys. Res., 105, 9091–9105, 2000. Hansel A., Jordan, A., Holzinger, R., Prazeller, P., Vogel, W., and Lindinger, W.: Proton transfer reaction mass spectrometry: on-line trace gas analysis at the ppb level, Int. J. Mass Spec. Ion Processes, 149/150, 609–619, 1995.
Harley, P., Fridd-Stroud, V., Greenberg, J., Guenther, A., and Vas-concellos, P.: Emission of 2-methyl-3-buten-2-ol by pines: A potentially large natural source of reactive carbon to the atmo-sphere, J. Geophys. Res., 103, 25 479–25 486, 1998.
Huey, L. G. and Lovejoy, E. R.: Reactions of SiF5− with
atmo-spheric trace gases: ion chemistry for chemical ionization de-tection of HNO3in the troposphere, Int. J. Mass Spec. Ion
Pro-cesses, 155, 133–140, 1996.
Leibrock, E. and Huey, L. G.: Ion chemistry for the detection of isoprene and other volatile organic compounds in ambient air,
Geophys. Res. Lett., 27, 1719–1722, 2000.
Lindinger, W. and Hansel, A.: Analysis of trace gases at ppb lev-els by proton transfer reaction mass spectrometry (PTR-MS), Plasma Sources Sci. Technol., 6, 111–117, 1997.
March, R. E. and Hughes, R. J.: Quadrupole storage mass spec-trometry, John Wiley & Sons, New York, NY, 1989.
Montzka, S. A., Trainer, M., Goldan, P. D., Kuster, W. C., and Fehsenfeld, F. C.: Isoprene and its oxidation products, methyl vinyl keton and methacrolein in the rural troposphere, J. Geo-phys. Res. 98, 1101–1111, 1993.
NCAR: Mesa Lab Weather Station Data, via anonymous ftp from atd.ucar.edu/pub/weather/mesa/, 1998.
Schade, G., Goldstein, A., Gray, D., and Lerdau, M.: Whole ecosys-tem and leaf level 2-methyl-3-buten-2-ol fluxes from a ponderosa pine plantation, Atmos. Env. 34, 3535–3544, 2000.
Singh, H. B. and Zimmerman, P. B.: Atmospheric distribution and sources of nonmethane hydrocarbons, in: Gaseous Pollutants: characterization and cycling, (Ed) Nriagu, J. O. , pp. 177–235, John Wiley & Sons, New York, NY, 1992.
Steinbrecher, R.: Isoprene: Production by plants and ecosystem-level estimates , in: Biogenic volatile organic carbon compounds in the atmosphere, (Eds) Helas, G., Slanina, J., and Steinbrecher, R., pp. 101–114, SPB Academic Publishing, Amsterdam, The Netherlands. 1997.
Williams, E. J., Sandholm, S. T., Bradshaw, J. D., Schendel, J. S., Langford, A. O, Quinn, P. K., LeBel, P. J., Vay, S. A., Roberts, P. D., Norton, R. B., Watkins, B: A., Buhr, M. P., Parrish, D. D., Calvert, J. G., and Fehsenfeld, F. C.: An intercomparison of five ammonia measurement techniques, J. Geophys. Res., 97, 11 591–11 611, 1992.