HAL Id: hal-00691797
https://hal.archives-ouvertes.fr/hal-00691797
Submitted on 27 Apr 2012
HAL is a multi-disciplinary open access
archive for the deposit and dissemination of
sci-entific research documents, whether they are
pub-lished or not. The documents may come from
teaching and research institutions in France or
abroad, or from public or private research centers.
L’archive ouverte pluridisciplinaire HAL, est
destinée au dépôt et à la diffusion de documents
scientifiques de niveau recherche, publiés ou non,
émanant des établissements d’enseignement et de
recherche français ou étrangers, des laboratoires
publics ou privés.
Neutral production of hydrogen isocyanide (HNC) and
hydrogen cyanide (HCN) in Titan’s upper atmosphere
Eric Hébrard, M. Dobrijevic, Jean-Christophe Loison, A. Bergeat, K. M.
Hickson
To cite this version:
Eric Hébrard, M. Dobrijevic, Jean-Christophe Loison, A. Bergeat, K. M. Hickson. Neutral production
of hydrogen isocyanide (HNC) and hydrogen cyanide (HCN) in Titan’s upper atmosphere. Astronomy
and Astrophysics - A&A, EDP Sciences, 2012, 541, pp.21. �10.1051/0004-6361/201218837�.
�hal-00691797�
Astronomy & Astrophysicsmanuscript no. HNC-AA ESO 2012c March 15, 2012
Neutral production of hydrogen isocyanide (HNC) and hydrogen
cyanide (HCN) in Titan’s upper atmosphere
E. H´ebrard
1,2, M. Dobrijevic
1,2, J.C. Loison
3, A. Bergeat
3, and K.M. Hickson
31 Univ. Bordeaux, LAB, UMR 5804, F-33270, Floirac, France
2 CNRS, LAB, UMR 5804, F-33270, Floirac, France
3 Institut des Sciences Mol´eculaires, UMR 5255, CNRS-Universit´e de Bordeaux, 351 cours de la Lib´eration, Talence Cedex, F-33405, France
Preprint online version: March 15, 2012
ABSTRACT
Aims.Following the first detection of hydrogen isocyanide (HNC) in Titan’s atmosphere, we have devised a new neutral chemical scheme for hydrogen cyanide (HCN) and HNC in the upper atmosphere of Titan.
Methods.Our updated chemical scheme contains 137 compounds (with C, H, O and N elements) and 788 reactions (including 91 photolysis processes). To improve the chemistry of HNC and HCN, a careful review of the literature has been performed to retrieve critical reaction rates and to evaluate their uncertainty factors. We have also estimated the reaction rates of 48 new reactions using simple capture theory.
Results.Our photochemical model gives abundances of HNC and HCN in reasonable agreement with observations. An uncertainty propagation study shows large uncertainties for HNC and relatively moderate uncertainties for HCN. A global sensitivity analysis pinpoints some key reactions to study as a priority to improve the predictivity of the model.
Conclusions.In particular, our knowledge of the isomerization of HNC via the reaction H + HNC → HCN + H and the chemistry of
H2CN needs to be improved. This study of the neutral chemistry taking place in the upper atmosphere of Titan is a prerequisite for future ionospheric models since ion-neutral reactions may also contribute significantly to HNC and HCN production.
Key words. Planets and satellites: individual: Titan Planets and satellites: atmospheres Planets and satellites: composition
-Astrochemistry
1. Introduction
Based on the fact that HCNH+ was considered as an
impor-tant ionospheric species in Titan’s atmosphere (Banaszkiewicz et al. 2000), Petrie (2001) made the hypothesis that hydrogen isocyanide (HNC) could be formed by the dissociative
recombi-nation of HCNH+in Titan’s upper atmosphere where it might be
detectable and might also play a part in the formation of more complex nitriles found on Titan. Recently, observations of Titan performed with the HIFI heterodyne submillimeter instrument aboard the Herschel Space Observatory (as part of the guaran-teed time key programme ”Water and related chemistry in the Solar System” (HssO), Hartogh et al. (2009)), allowed the first detection of HNC in Titan’s atmosphere through the measure-ment of its emission line from the J = 6 → 5 rotational transition at 543.897 GHz (Moreno et al. 2010). Their preliminary analysis suggests that the bulk of this emission must originate at altitudes above 300 km. However, the observations cannot strictly estab-lish a HNC vertical profile (Moreno et al. 2011). Petrie (2001) argued that HNC was likely to be formed almost entirely by an ion-molecule mechanism and that neutral formation pathways were not viable. As a consequence, Petrie (2001) suggested that the concentration profile for HNC as a function of altitude would follow the typical profile for a polyatomic ion rather than a neu-tral molecule. So, according to Petrie (2001), HNC might be lo-cated mainly in the ionosphere with a peak of abundance around 1200 km.
Since the neutral composition of the atmosphere is a prereq-uisite for ionospheric models, it is of prime importance to study
carefully the production of neutral species production in addi-tion to loss processes for HNC and HCN, since HCN is strongly related to HNC. Since HNC was not considered in previous photochemical models, it is necessary to build a new chemical scheme devoted to HNC chemistry and its putative interactions with other species. The chemistry of nitrogen compounds at low temperatures (between 100 and 200 K), either in cold plane-tary atmospheres or in protoplaneplane-tary disks, is not well known (H´ebrard et al. 2006; Vasyunin et al. 2008; H´ebrard et al. 2009). Therefore, it is also critical to evaluate the uncertainties attached to the reviewed reaction rates.
In the present paper, we investigate the production of HNC via neutral reactions. A careful investigation of neutral produc-tion and loss processes for both HNC and HCN has been carried out. A 1D photochemical model is used to infer the abundance of HNC as a function of altitude. Our study includes an uncertainty propagation study and a sensitivity analysis to determine the key reactions of our chemical scheme. We briefly present our photo-chemical model in section 2. The methodology we have adopted to build the chemical scheme for HNC and HCN is presented in detail in section 3. In section 4, we compare the computed abundance profiles of HNC and HCN with the available obser-vations. We present the main reactions for the neutral production and loss of these compounds in the current model. A local sensi-tivity study is carried out in section 5 to highlight the importance of the HNC isomerization reaction. An uncertainty propagation study is presented in section 6 and a global sensitivity analysis is performed subsequently in section 7 to determine the key re-actions which are important to study in priority to improve the
predictivity of our model. The main conclusions of our work are summarized in section 8. Some selected reactions (reactions that are important for the production of HNC or HCN and reactions that contribute significantly to the uncertainties on their abun-dances) are commented in section A.
2. Photochemical model
The photochemical model is derived from the H´ebrard et al. (2007) model with a modification of the numerical solver pre-sented in Dobrijevic et al. (2010a). Instead of using a classi-cal Crank-Nicholson method, we now use the ODEPACK li-brary, which implements Hindmarsh’s solvers for ordinary dif-ferential equations (Hindmarsh 1983). Our photochemical 1D model uses a constant background atmosphere with constant boundary conditions. Atmospheric parameter inputs (T , P, n) were taken from Yelle et al. (1997) recommended engineering model. We use a non-uniform grid of altitude with 125 levels from the ground to 1300 km. Two consecutive levels are sepa-rated by a distance smaller than H(z)/5, where H(z) is the at-mospheric scale height at altitude z. A zero flux was assumed as an upper boundary condition for most of the species, except
for atomic hydrogen H and molecular hydrogen H2, which were
allowed to escape with velocities following Jean’s thermal
es-cape mechanism, and for water H2O, which exhibits an external
influx equal to 5 × 106 cm−2.s−1 to account for the water
in-flux arising from micrometeorites initiating oxygen chemistry in Titan’s atmosphere (Feuchtgruber et al. 1997). At the lower
boundary, methane CH4 abundances was set to its tropopause
abundance 1.41 × 10⁻². The abundance of carbon monoxide CO
at the surface was assumed to be 5. 2 × 10⁻⁵on the basis of the
(Gurwell & Muhleman 2000) high resolution ground-based
in-terferometric observations. Molecular hydrogen H2 abundance
was assumed to be equal to 1.1 × 10⁻³ following (Samuelson
et al. 1997). Calculations are performed with a solar zenith
an-gle of 50◦ to account for diurnally averaged conditions at the
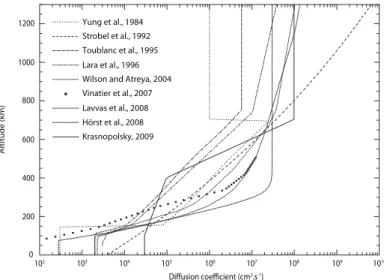
equator. The eddy diffusion coefficient K(z) is a free parameter of 1D photochemical models which is not well constrained. We use the value derived by H¨orst et al. (2008) as a mean profile among all the different profiles that have been published so far (see Figure 1).
3. Chemical scheme
The basis of the chemical scheme is presented in H´ebrard et al. (2006) and H´ebrard et al. (2009). In the present work, many rate constants have been updated and numerous reactions have been added. Our new chemical scheme includes 137 compounds and 788 reactions (91 photodissocation processes, 2 dissociation
processes of N2by cosmic rays, 694 bimolecular reactions and
94 termolecular reactions). The complete list of the reactions is available upon request or can be downloaded from the KInetic Database for Astrochemsity (KIDA, http://kida.obs.u-bordeaux1.fr). In the present paper, we only present reactions which are essential for the study of HCN and HNC, either because they are important for their neutral production and/or loss or because they contribute significantly to the uncertainties on their abundances.
The methodology we have adopted to build a chemical scheme for HNC and HNC is the following. As a first step, all the reactions related to HCN found in the chemical schemes published by H´ebrard et al. (2006) and other photochemical
0 200 400 600 800 1000 1200 102 103 104 105 106 107 108 109 1010 Altitude (km) Diffusion coefficient (cm2.s-1) Yung et al., 1984 Strobel et al., 1992 Toublanc et al., 1995 Lara et al., 1996 Wilson and Atreya, 2004 Vinatier et al., 2007 Lavvas et al., 2008 Hörst et al., 2008 Krasnopolsky, 2009
Fig. 1. Eddy diffusion profiles from various photochemical models
(Yung et al. 1984; Strobel et al. 1992; Toublanc et al. 1995; Lara et al. 1996; Wilson & Atreya 2004; Vinatier et al. 2007; Lavvas et al. 2008; H¨orst et al. 2008; Krasnopolsky 2009).
models were checked and updated, by including in addition new reactions found in the literature. For all these reactions, we investigated their efficiency to produce HNC. In a second step, we completed the HNC scheme by introducing all neutral reactions producing of destroying HNC that we could find in the literature. Then, based on the relative abundance of the various chemical species computed by our photochemical model, we estimated what reactions currently missing in our chemical scheme might be important by systematically evaluating the cross-reactions involving HCN or HNC between
the main species of Titan’s atmosphere: C, H, N(4S), N(2D),
CH, CH3, CH4, C2H2, C2H4, NH, CN, CH2NH, H2CN, etc.
Finally, we also estimated what reactions might be relevant to improve the chemical scheme, in particular to avoid the artificial formation of important sink species (species which are efficiently produced but not destroyed in the model). At the end, the chemical scheme consists of 56 reactions with HCN and 22 reactions with HNC (including photolysis processes). Among these reactions, we have estimated in the present work the rate constants of 12 reactions for HCN and of 14 reactions for HNC. This illustrates the lack of information regarding HNC reactivity in the literature.
3.1. Estimation of reaction rates for new processes
When introducing reactions with unknown reaction rates ( with-out experimental measurements and/or theoretical calculations to rely upon) in the temperature range of interest (T ∈ [100−200] K), one major concern is to make a reasonble estimation of their reaction rates. In the following, we explain how we have esti-mated the rate constants and branching ratios for various reac-tions. For the evaluation of chemical rate constants between 150 K and 200 K the presence of an energetic barrier is critical. When no information was available, the presence and the values of any energetic barriers to the entrance valley for the important reac-tions (in terms of production and/or loss rate) were calculated at the M06-2X/cc-pVTZ level using the Gaussian09 software
package (Frisch et al. 2009) except for the H + H2CN, N(4S) +
performed also at MRCI+Q/vqz level using the Molpro software package (Werner et al. 2010). For the other reactions, identified as being less important, the presence or the absence of a barrier was deduced from general considerations. When a reaction was thought to proceed through direct abstraction, its rate constant has been estimated by comparison with known similar reactions. When a reaction was thought to proceed through addition (as is the case with most of the radical-radical reactions), in the ab-sence of theoretical calculations, we have considered that there was no barrier when the ground state of the adduct arises from pairing up electrons on the two radicals reactants, whereas the surface was likely be repulsive if all the electrons remain un-paired. Therefore, doublet + doublet reactions were considered to have no barrier for the singlet surface but a barrier for the triplet surfaces (which is in good agreement with experimental and theoretical results for H + alkyl or alkyl + alkyl reactions for example (Harding et al. 2005; Klippenstein et al. 2006)).
When no energetic barrier was found to be present, the value of the rate constant was estimated using long-range forces, mainly through dispersion interactions (Stoecklin & Clary 1992; Georgievskii & Klippenstein 2005), and by taking into account
the electronic degeneracy γel. The electronic degeneracy factors
were calculated by applying the spin and orbital correlation rules to the potential energy surfaces that correlate the separated reac-tants with the separated products. Using a capture rate, kcapture, generally overestimates the rate constant by a uncertainty factor
Fcapture = 3 at most (Georgievskii & Klippenstein 2005) except for specific mechanisms for which the potential coexistence of a van der Waals complex and a submerged barrier could play an important role and lead to low rate constant values at 300 K (like for OH + alkenes or CN + alkenes reactions). Accordingly, the nominal rate constant used in the model for such reactions
is k = γel × kcapture/pFcapture to which is associated an
un-certainty factor F = pFcapture. As a result, the minimum and
maximum values expected for this effective rate constant are
kmin = γel× kcapture/Fcapture and kmax = γel× kcapture, respec-tively. Values for the effective uncertainty factor F were esti-mated mainly by comparison with similar reactions and also by taking into account the uncertainties on electronic degeneracy when no ab-initio calculations were available. Branching ratios were estimated from ab-initio calculations except for the key H
+ H2CN reaction for which we performed statistical calculations
of the microcanonical rate constants of the various steps of the mechanism (Bergeat et al. 2009).
3.2. Photolysis processes
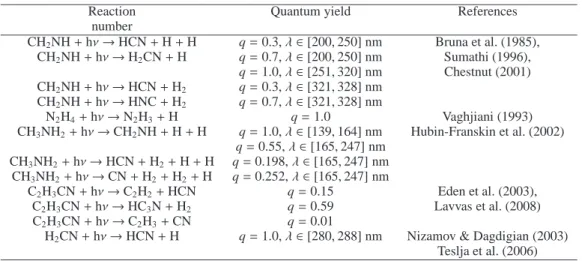
In our model we consider that the photolysis of HNC is similar to the photolysis of HCN (using the identical absorption cross sections, dissociative thresholds and quantum yields). Compared to the H´ebrard et al. (2009) model, we add several photolysis processes which are presented in Table 1.
4. Photochemical model results
4.1. Comparison with observations 4.1.1. HNC observations
Very recently, Moreno et al. (2011) reported the first identifica-tion of HNC in Titan’s atmosphere from observaidentifica-tions using the
HIFI instrument on the Herschel1 Space Observatory. The
col-umn density of HNC inferred from these observations is in the
range (0.6 − 1.5) × 1013cm−2for altitudes between 400 and 1000
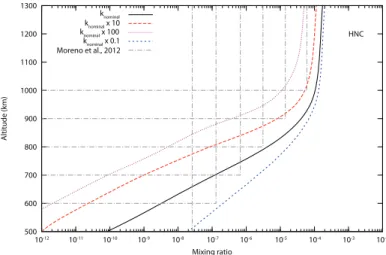
km, but the authors noticed that it was not possible to constrain the vertical profile of HNC from these data. Several constant pro-files of HNC give a satisfactory agreement with the observations depending on the mixing ratio and the altitude cut-off. These profiles are presented in Figure 2 and are compared with our
model. The column density we obtain is 3.4 × 1013cm−2above
500 km whereas the value derived by Moreno et al. (2011) at this altitude is 1.2 × 1013cm−2(about 3 times lower). We will see in
the following that this discrepancy can be simply explained by our poor knowledge of some key reactions.
500 600 700 800 900 1000 1100 1200 1300 10-12 10-11 10-10 10-9 10-8 10-7 10-6 10-5 10-4 10-3 10-2 Altitude (km) Mixing ratio HNC knominal knominal x 100 knominal x 0.1 Moreno et al., 2012 knominal x 10
Fig. 2. Mixing ratio of HNC in the upper atmosphere of Titan. Nominal
model (solid line) and the different acceptable profiles derived from re-cent Herschel observations (Moreno et al. 2011) (grey dotted lines). Local sensitivity analysis for the isomerization reaction H + HNC → HCN + H is also illustrated by changing its rate by a factor of 10 or 100.
4.1.2. HCN observations
The neutral composition of Titan’s upper atmosphere between 1000 and 1100 km has been inferred from the interpretation of Cassini Ion and Neutral Mass Spectrometer (INMS) mea-surements by Magee et al. (2009). In particular, the global
average mixing ratio of HCN at 1050 km is (2.44 ± 0.10) × 10−4.
Previous interpretation of INMS data from Vuitton et al. (2007)
gave a similar abundance of HCN of 2.0 × 10⁻⁴ at 1100 km,
with an uncertainty factor of 2-3. Geballe et al. (2003) detected HCN emission features in a high resolution spectrum near 3 µm acquired at the Keck II telescope. These data were re-analyzed by Yelle & Griffith (2003) with a model for fluorescence of sunlight in the ν3 band of HCN and by Kim et al. (2005) with an updated model. Their results were in agreement in the upper
atmosphere. The HCN mixing ratio is from (1 − 3) × 10−3around
1000 km. The density of HCN between 600 and 1000 km has been also inferred by Shemansky et al. (2005) from observations of stellar occultations by the atmosphere of Titan using the Cassini Ultraviolet Imaging Spectrometer (UVIS). The HCN
mixing ratio at 1000 km is about 4 × 10⁻³. Recently, Adriani
1 Herschel is an ESA space observatory with science instruments pro-vided by European-led Principal Investigator consortia and with impor-tant participation from NASA.
Table 1. New photodissociation processes included in the model (update of H´ebrard et al. (2009)).
Reaction Quantum yield References
number CH2NH + hν → HCN + H + H q = 0.3, λ ∈ [200, 250] nm Bruna et al. (1985), CH2NH + hν → H2CN + H q = 0.7, λ ∈ [200, 250] nm Sumathi (1996), q = 1.0, λ ∈ [251, 320] nm Chestnut (2001) CH2NH + hν → HCN + H2 q = 0.3, λ ∈ [321, 328] nm CH2NH + hν → HNC + H2 q = 0.7, λ ∈ [321, 328] nm N2H4+ hν → N2H3+ H q = 1.0 Vaghjiani (1993) CH3NH2+ hν → CH2NH + H + H q = 1.0, λ ∈ [139, 164] nm Hubin-Franskin et al. (2002) q = 0.55, λ ∈ [165, 247] nm CH3NH2+ hν → HCN + H2+ H + H q = 0.198, λ ∈ [165, 247] nm CH3NH2+ hν → CN + H2+ H2+ H q = 0.252, λ ∈ [165, 247] nm C2H3CN + hν → C2H2+ HCN q = 0.15 Eden et al. (2003), C2H3CN + hν → HC3N + H2 q = 0.59 Lavvas et al. (2008) C2H3CN + hν → C2H3+ CN q = 0.01
H2CN + hν → HCN + H q = 1.0, λ ∈ [280, 288] nm Nizamov & Dagdigian (2003)
Teslja et al. (2006)
et al. (2011) used the limb observations of the Visual and Infrared Mapping Spectrometer (VIMS) onboard the Cassini spacecraft to retrieve vertical profiles of HCN from its 3 µm non-LTE emission in the region from 600 to 1100 km altitude at
daytime. The mixing ratio of HCN is about (5.5 ± 1.5) × 10−3
at 1050 km. This result is in agreement with the upper value of the HCN profile derived by Yelle & Griffith (2003) and Kim et al. (2005). HCN has been also detected in Titan’s upper atmosphere in the ultraviolet by the UltraViolet Spectrometer (UVS) instrument aboard Voyager 1 (Vervack et al. 2004). The
mixing ratio of HCN is around 10−4at 500 km (about 20 times
lower than other observations) and then increases with altitude leading to a value in agreement with all the other observations (but with large uncertainties).
It is difficult to compare all these observations taken at ent times, using different techniques and corresponding to differ-ent spatial resolutions. In addition, these observations are more or less model-dependent and a direct comparison with our nomi-nal profile is not straightforward. Due to the inconsistency of the published observational data (error bars do not overlap), we can conclude that our nominal neutral model, which does not include ions, is roughly consistent with these observations.
4.1.3. Sensitivity to eddy diffusion
If restricted above 1000 km, the mixing ratio of HNC derived
from observation of Moreno et al. (2011) is about 6×10⁻⁵and the
mixing ratio of HCN is in the range (0.2−6)×10−3according the
various observations. This leads to a HNC/HCN ratio of about 0.01-0.3. In our current model, the HNC/HCN ratio is about 0.1. At 500 km, the HNC/HCN ratio from the various observations
is around 5 × 10⁻³(assuming a constant mixing ratio of HNC
above 500 km). In our model, the ratio is 2 × 10⁻⁵, more than
100 times lower.
Since the eddy diffusion coefficient is not well constrained in the atmosphere of Titan, we have tested other K(z) profiles in or-der to test the sensitivity of this ratio to transport. For instance, in the case of the eddy diffusion profile K(z) derived by H¨orst et al.
(2008), the methane homopause is located around zh = 800 km
and Kh= 3 ×107cm2s−1. In the case of the eddy diffusion profile
K(z) obtained by Strobel et al. (1992), the methane homopause
is around zh = 1100 km and Kh = 109cm2s−1. Figure 4 shows
500 600 700 800 900 1000 1100 1200 1300 10-7 10-6 10-5 10-4 10-3 10-2 Altitude (km) Mixing ratio HCN Model Adriani2011 Kim2005 (1) Kim2005 (2) Magee2009 Shemansky2005 Vervack2004
Fig. 3. Mixing ratio of HCN in the upper atmosphere of Titan. Model
(solid line) and main observations in the upper atmosphere (see text for references).
that the HNC/HCN ratio is not sensitive to K(z) down to 700 km but is different by a factor of 100 at 500 km. At 500 km, the discrepancy between our model using the K(z) of Strobel et al. (1992) and observations is more pronounced since the ratio is only 3 × 10⁻⁷.
HNC and HCN mixing ratios for the two eddy profiles are also presented in Figure 4. Their abundances differ by a factor of 3 above 1000 km. As explained in the following section, both
HNC and HCN are mainly produced from the reaction of H2CN,
which is produced by the reaction between N(4S) and CH
3. So,
these differences are directly linked to the mixing ratio of CH3
which depends on the photolysis and the molecular diffusion of
CH4above the homopause.
Consequently, the sensitivity of HNC and HCN to K(z) is lower than the uncertainties on the model (see also Figures 8 and 9) and can not be used to constrain the eddy diffusion coefficient profile in the upper atmosphere of Titan.
Fig. 4. Mixing ratios of HNC and HCN and HNC/HCN ratio as a
func-tion of altitude for two eddy diffusion coefficients.
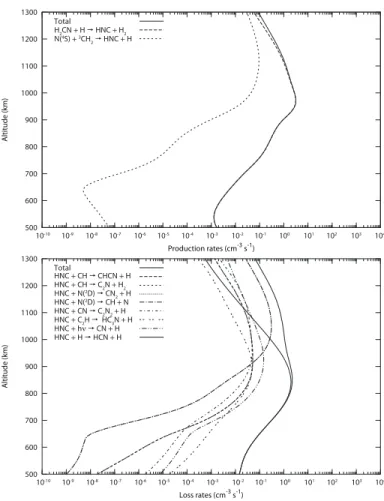
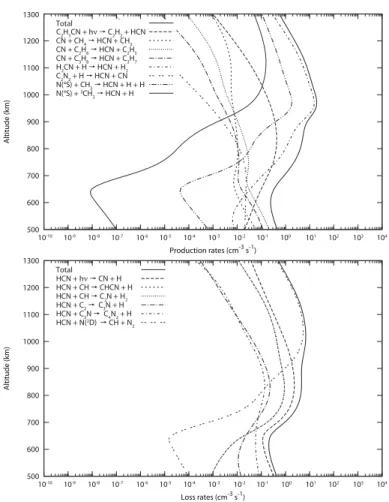
4.2. Main production and loss processes for HNC
The main production and loss processes for HNC (for the cur-rent chemical scheme) are presented in Figure 5 and are listed in Table 2. Here we summarize the main processes leading to the production and loss of HNC from the primary radicals.
4.2.1. Production
At 1300 km, HNC is produced from:
H2CN + H → HNC + H2(64%)
N(4S) +3CH
2→ HNC + H (34%)
At 1000 km, HNC comes mainly from the reaction:
H2CN + H → HNC + H2(98%)
H2CN is mainly produced by two reactions:
N(4S) + CH3→ H2CN + H (90%)
CH2NH + hν → H2CN + H (9%)
while CH2NH comes from:
N(2D) + CH
4→ CH2NH + H (60%)
NH + CH3→ CH2NH + H (35%)
and NH comes from:
N(2D) + CH
4→ NH + CH3(64%)
N(4S) + H2CN → NH + HCN (21%)
N(2D) + H
2→ NH + H (11%)
At 600 km, the scheme for the production of HNC is a little bit different; HNC comes fully from the reaction:
H2CN + H → HNC + H2(100%)
but H2CN is produced from:
CH2NH + hν → H2CN + H (74%)
CH2NH + H → H2CN + H2(22%)
and CH2NH comes from:
CH3NH2+ hν → CH2NH + H + H (37%)
N(2D) + CH
4→ CH2NH + H (30%)
N(2D) + C2H6→ CH2NH + CH3(21%)
NH + CH3→ CH2NH + H (11%)
As a conclusion, H2CN and CH2NH are key species in the
production of HNC in the upper atmosphere of Titan.
4.2.2. Loss
At 1300 km, HNC is mainly destroyed by its reaction with N(2D):
N(2
D) + HNC → CN2+ H (41%)
N(2D) + HNC → CH + N2(41%)
At 1000 km, the isomerization of HNC into HCN begins to con-tribute to the HNC loss as well:
N(2
D) + HNC → CN2+ H (25%)
N(2D) + HNC → CH + N2(25%)
HNC + H → HCN + H (24%)
At 600 km, HNC is fully destroyed through its isomerization into HCN: HNC + H → HCN + H (99%) 500 600 700 800 900 1000 1100 1200 1300 Altitude (km) Production rates (cm-3 s-1) Total H2CN + H HNC + H2 N(4S) + 3CH 2 HNC + H 10-10 10-9 10-8 10-7 10-6 10-5 10-4 10-3 10-2 10-1 100 101 102 103 104 500 600 700 800 900 1000 1100 1200 1300 Altitude (km) Loss rates (cm-3 s-1) Total HNC + CH CHCN + H HNC + CH C2N + H2 HNC + N(2D) CN 2 + H HNC + N(2 D) CH + N HNC + CN C2N2 + H HNC + C2H HC3N + H HNC + hν CN + H HNC + H HCN + H 10-10 10-9 10-8 10-7 10-6 10-5 10-4 10-3 10-2 10-1 100 101 102 103 104
Fig. 5. Reaction rate profiles for most important reactions leading to the
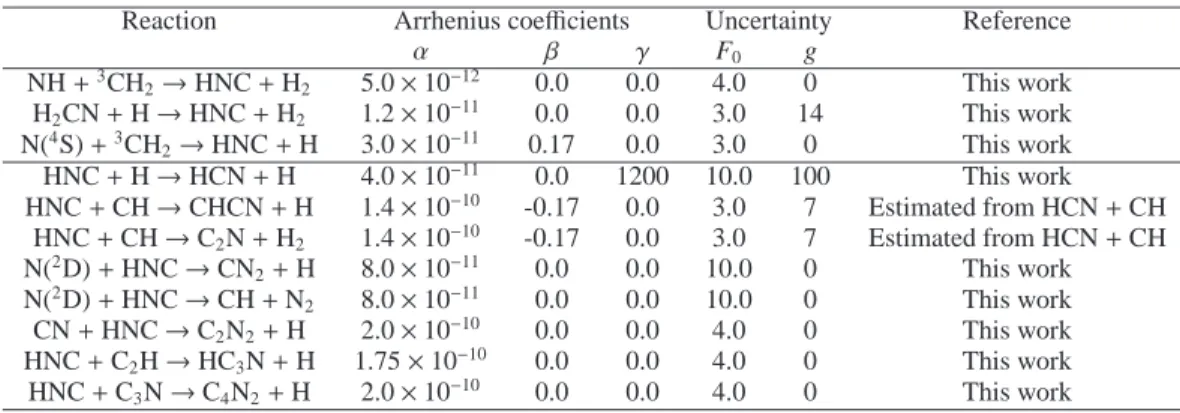
Table 2. Main reactions for the production (top) and loss (bottom) of HNC. Reaction rates are expressed as k = α × (T/300)β
× exp(−γ/T ) cm3 molecule−1s−1. Uncertainties are expressed as F(T ) = F
0× exp(g × |1/T − 1/300|) (T in K).
Reaction Arrhenius coefficients Uncertainty Reference
α β γ F0 g NH +3CH 2→ HNC + H2 5.0 × 10⁻¹² 0.0 0.0 4.0 0 This work H2CN + H → HNC + H2 1.2 × 10⁻¹¹ 0.0 0.0 3.0 14 This work N(4S) +3CH 2→ HNC + H 3.0 × 10⁻¹¹ 0.17 0.0 3.0 0 This work HNC + H → HCN + H 4.0 × 10⁻¹¹ 0.0 1200 10.0 100 This work HNC + CH → CHCN + H 1.4 × 10⁻¹⁰ -0.17 0.0 3.0 7 Estimated from HCN + CH HNC + CH → C2N + H2 1.4 × 10⁻¹⁰ -0.17 0.0 3.0 7 Estimated from HCN + CH N(2 D) + HNC → CN2+ H 8.0 × 10⁻¹¹ 0.0 0.0 10.0 0 This work N(2D) + HNC → CH + N 2 8.0 × 10⁻¹¹ 0.0 0.0 10.0 0 This work CN + HNC → C2N2+ H 2.0 × 10⁻¹⁰ 0.0 0.0 4.0 0 This work HNC + C2H → HC3N + H 1.75 × 10⁻¹⁰ 0.0 0.0 4.0 0 This work HNC + C3N → C4N2+ H 2.0 × 10⁻¹⁰ 0.0 0.0 4.0 0 This work
4.3. Main production and loss processes for HCN
The main production and loss processes for HCN are presented in Figure 6 and are listed in Table 3. Here we summarize the main processes leading to the production and loss of HCN from the primary radicals.
4.3.1. Production
At 1300 km, several reactions contribute to the production of HCN: H2CN + H → HCN + H2(52%) N(4S) + CH 3→ HCN + H + H (19%) N(4S) +3CH 2→ HCN + H (9%) H2CN + hν → HCN + H (7%) N(4S) + H 2CN → HCN + NH (6%)
At 1000 km, the situation is simpler, HCN comes from:
H2CN + H → HCN + H2(78%)
N(4S) + CH3→ HCN + H + H (9%)
C2N + H → HCN + C (7%)
In a similar manner to HNC, the production of HCN is
strongly related to the production of H2CN. Again, the reaction
between N(4S) and CH3 is important since it produces both
H2CN and HCN.
At 600 km, several reactions contribute equally to the production of HCN. Many of them involve CN radicals.
CN + C2H6→ HCN + C2H5(25%) C2H3CN + hν → C2H2+ HCN (24%) HNC + H → HCN + H (16%) CN + C3H8→ HCN + C3H7(14%) C2N2+ H → HCN + CN (9%) CN + CH4→ HCN + CH3(6%) H2CN + H → HCN + H2(5%)
Where C2H3CN comes from:
CN + C2H4→ C2H3CN + H (99%)
And CN comes from:
HCN + hν → CN + H (23%)
HC3N + hν → CN + C2H (55%)
C4N2+ hν → C3N + CN (15%)
As a conclusion, H2CN (z > 1000 km) and CN (z < 1000
km) are important intermediate compounds for the production of HCN in the upper atmosphere of Titan.
4.3.2. Loss
At 1300 km, HCN is mainly destroyed by its reaction with N(2D)
and by its photolysis: N(2
D) + HCN → CH + N2(88%)
HCN + hν → CN + H (7%) At 1000 km, the situation is quite similar:
N(2
D) + HCN → CH + N2(72%)
HCN + hν → CN + H (14%) HCN + CH → CHCN + H (6%)
HCN + CH → C2N + H2 (6%)
At 600 km, HCN is partly destroyed through its reaction with C3N radical:
HCN + hν → CN + H (62%)
HCN + C3N → C4N4+ H (28%)
HCN + C2→ C3N + H (6%)
Remark While studying the relative importance of the individ-ual contribution of each reaction to the production and loss rates of a given compound, it is important to keep in mind the follow-ing fact: Due to the large current uncertainties in reaction rates, the relative importance of each reaction might change drastically as we go along in the improvement of reaction rates accuracy at low temperature. As a consequence, the set of reactions given here for our current nominal model might not be the set of reac-tions that would dominate had some of the initial rate constants been different in the production or loss of HNC and HCN (see section 6 for an illustration of the impact of uncertainties on re-action rates in model outputs).
5. Local sensitivity analysis: a critical reaction study
Figure 5 shows that the most important loss reaction for HNC around 500 km is the isomerization reaction H + HNC → HCN
+ H (see also Table 3). The reaction rate of this process is not
very well known at low temperature (≈ 150 K) with an uncer-tainty factor that we estimate to be about 10 (see section A). So, this reaction is clearly critical for the abundance of HNC in our model. In order to pinpoint the importance of this reac-tion, we performed a local sensitivity analysis, which consists of
Table 3. Main reactions for the production (top) and loss (bottom) of HCN. Reaction rates are expressed as k = α × (T/300)β
× exp(−γ/T ) cm3 molecule−1s−1. Uncertainties are expressed as F(T ) = F
0× exp(g × |1/T − 1/300|) (T in K).
Reaction Arrhenius coefficients Uncertainty Reference
α β γ F0 g
C2H3CN + hν → C2H2+ HCN N(4S) + CH
3→ HCN + H + H 6.0 × 10⁻¹² 0.0 0.0 2.0 7 This work
CN + CH4→ HCN + CH3 6.0 × 10⁻¹² 0.0 721 1.6 0 Yang et al. (1992); Sims et al. (1993)
CN + C2H6→ HCN + C2H5 2.08 × 10⁻¹¹ 0.22 -58 1.4 0 Sims et al. (1993) CN + C3H8→ HCN + C3H7 2.14 × 10⁻¹¹ 1.19 -378 1.4 0 Yang et al. (1992) HNC + H → HCN + H 4.0 × 10⁻¹¹ 0.0 1200 10.0 100 This work C2N2+ H → HCN + CN 8.59 × 10⁻¹⁶ 0.0 0.0 2.0 100 Dunn et al. (1971) H2CN + H → HCN + H2 6.0 × 10⁻¹¹ 0.0 0.0 4.0 7 This work N(4S) +3CH 2→ HCN + H 5.0 × 10⁻¹¹ 0.17 0.0 3.0 0.0 This work HCN + hν → CN + H HCN + CH → CHCN + H 1.4 × 10⁻¹⁰ -0.17 0.0 3.0 7 This work HCN + CH → C2N + H2 1.4 × 10⁻¹⁰ -0.17 0.0 3.0 7 This work HCN + N(2 D) → CH + N2 1.6 × 10⁻¹⁰ 0.0 0.0 10.0 0 This work HCN + C2→ C3N + H 2.0 × 10⁻¹⁰ 0.17 0.0 3.0 0 This work HCN + C3N → C4N2+ H 2.0 × 10⁻¹⁰ 0.0 0.0 4.0 21 This work 500 600 700 800 900 1000 1100 1200 100 Altitude (km) Production rates (cm-3 s-1) C2H3CN + hν C2H2 + HCN CN + CH4 HCN + CH3 CN + C2H6 HCN + C2H5 CN + C3H8 HCN + C3H7 H2CN + H HCN + H2 C2N2 + H HCN + CN N(4S) + CH 3 HCN + H + H N(4S) + 3CH 2 HCN + H Total 1300 10-10 10-9 10-8 10-7 10-6 10-5 10-4 10-3 10-2 10-1 101 102 103 104 500 600 700 800 900 1000 1100 1200 1300 10-10 10-9 10-8 10-7 10-6 10-5 10-4 10-3 10-2 10-1 100 101 102 103 104 Altitude (km) Loss rates (cm-3 s-1) Total HCN + hν CN + H HCN + CH CHCN + H HCN + CH C2N + H2 HCN + C2 C3N + H HCN + C3N C4N2 + H HCN + N(2D) CH + N 2
Fig. 6. Reaction rate profiles for most important reactions leading to the
production and loss of HCN (see Table 3 for reactions).
changing the rate of this reaction by a factor of 10 whilst keep-ing all other rates unchanged. It is important to note that this kind of study gives only incomplete information about the im-portance of this reaction. A global sensitivity analysis is required to study how the uncertainty of this reaction rate propagates in the model through the set of strongly coupled and non-linear differential equations (Dobrijevic et al. 2010b). Results are
pre-sented in Figure 2. Whilst there is only a factor of 2 between the extreme HNC mole fractions at 1300 km, the difference reaches
a factor of 105 at 500 km. As a consequence, the poor
knowl-edge of the rate of this reaction limits strongly the accuracy of photochemical models.
6. Uncertainty propagation study
6.1. Method
The methodology used to study the propagation of uncertainties in the model is described in H´ebrard et al. (2007) and H´ebrard et al. (2009). There are many sources of uncertainty in a 1D pho-tochemical model. In the present study, we focus exclusively on its chemical sources through the uncertainties of the pho-todissociation and reaction rates. These uncertainties originate in their experimental or theoretical determination, and are gen-erally quantified by a standard deviation or a relative uncertainty. Because of the profoundly non-linear nature of the photochem-ical model and the potentially large uncertainties displayed by many parameters, a linear uncertainty propagation is not ex-pected to produce valid results. Propagation of distributions by Monte Carlo sampling is better adapted to such problems (BIPM et al. 2008, 2006). Due to the positivity constraint on these prop-erties, their distributions are modeled by lognormal probability density functions : p(x) = √ 1 2πxσexp − (ln x − µ)2 σ2 ! (1) with µ = ln k(T ), the logarithm of the nominal value of the reaction rate at temperature T , and σ = ln F(T ), the loga-rithm of the geometric standard uncertainty F(T ) of the log-normal distribution. With these notations, the 67% confidence interval for a reaction rate at a given temperature is given as [k(T )/F(T ), k(T ) × F(T )].
Estimation of the uncertainty factor F(T ) of a reaction rate
k(T ) at any given temperature follows an expression adapted
from KIDA (Wakelam et al. 2012):
F(T ) = F(300K) exp g(1 T − 1 300) (2) where F(300K) is the uncertainty in the rate constant k(T ) at
defined for use with F(300K) in the above expression to ob-tain the rate constant uncerob-tainty F(T ) at different temperatures. These assigned uncertainty factors F(300K) and g are evaluated to construct the appropriate uncertainty factor, F(T ), following an approach based on the fact that rate constants are almost always known with a minimum uncertainty at room tempera-ture. The knowledge of both F(300K) and g parameters allows to quantify the temperature-dependent uncertainties carried by each reaction rate present in the standard sets of reaction rates in a temperature range adequate for Titan’s atmosphere.
Most of the reaction rate coefficients and their associated un-certainty factors used in the present study are extracted from our previous reviews (H´ebrard et al. 2006; H´ebrard et al. 2009). Reaction rates and uncertainties for new processes are estimated according to the methodology introduced in section 3. The un-certainty factor is set to 1.2 for all the photodissociation rates for simplicity (see Peng et al. (2012) for a valuable discussion about uncertainties on photodissociation rates). We perform 1000 runs to have statistically significant results. The integration time for
each run is set to 1011s for simplicity and to limit the
compu-tation time. This time is sufficient to reach a steady state in the upper atmosphere. For instance, the most important relative
vari-ation of the HNC mole fractions is lower than 1.0 × 10⁻²for all
the runs with very few exceptions.
Figure 7 presents an example of a rate constant histogram generated by our Monte-Carlo procedure for a reaction rate con-stant estimated by capture theory. As explained in section 3, this kind of rate constant is in practice
k = γel× kcapture/pFcapture
and its uncertainty factor F = pFcapture. Our simulation is in
good agreement with what was expected and we see that only a limited fraction of runs (< 15%) give rates greater than the
kcapturevalue. 0 5 10 15 20 25 30 -11.2 -10.94 -10.68 -10.42 -10.16 -9.9 Frequency Log10(k [cm3s-1]) kc
Fig. 7. Histograms of reaction rates obtained after 1000 runs for reaction
N(4S) + C
2H → C2N + H. The reaction rate estimated for this reaction is kcapture= 6.0 × 10⁻¹¹and its uncertainty factor is Fcapture = 16.
6.2. Results: HCN and HNC profiles
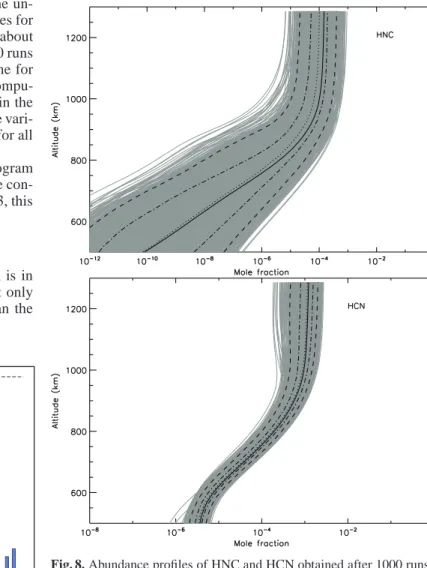
The type of abundance distribution depends on the compound and can vary with altitude: distributions are not always normal
or log-normal. In this case, quantiles are useful measures to rep-resent the distributions. Figures 8 and 9 show the 5th and 15th of the 20-quantiles and the 1st and 19th of the 20-quantiles which give the intervals containing respectively 50% and 90% of the profiles.
The HCN and HNC profiles obtained from the uncertainty propagation study are presented in Figure 8. We obtain large uncertainties for HNC, especially below 900 km, whereas un-certainties are quite reasonable for HCN throughout the upper atmosphere. At 1300 km, the mean value of the HNC mole
frac-tion is 10−4and 50% of the profiles lie between 5.3 × 10⁻⁵and
2.0 × 10⁻⁴. For HCN, the mean mole fraction is 1.2 × 10⁻³and
50% of the profiles lie between 8.0 × 10⁻⁴and 1.6 × 10⁻³.
Fig. 8. Abundance profiles of HNC and HCN obtained after 1000 runs.
Black solid line: initial profile. Black dotted line: median profile ob-tained from the uncertainty propagation study. Black dashed-dotted lines: 5th and 15th 20-quantiles of the distribution. Black long-dashed lines: 1st and 19th 20-quantiles of the distribution.
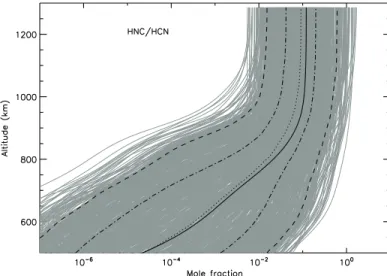
The HNC/HCN ratio as a function of altitude is given in Figure 9. The determination of this ratio is important with re-spect to the detection of HCN by the Cassini Ion Neutral Mass Spectrometer (INMS) (Magee et al. 2009). Since HNC and HCN have the same mass, it is likely that both species contributed sig-nificantly to the same peak in this instrument. We see in Figure 9 that the ratio HNC/HCN can statistically reach a value as high as 0.5. More precisely, 90% of the HNC/HCN profiles are within the range [0.015, 0.5] and 50% in the range [0.04, 0.17]. By
com-parison with observations, Moreno et al. (2011) estimated that this ratio is about 0.3 (based on the abundance of HCN retrieved by INMS).
Fig. 9. Abundance profiles of HNC/HCN ratios obtained after 1000
runs. Black solid line: initial profile. Black dotted line: median profile obtained from the uncertainty propagation study. Black dashed-dotted lines: 5th and 15th 20-quantiles of the distribution. Black long-dashed lines: 1st and 19th 20-quantiles of the distribution.
The main conclusion of these results is that the current accu-racy of photochemical models for HNC is very poor, especially below 800 km. Theoretical and experimental studies are required to improve the situation. We see in the next section that a global sensitivity analysis can pinpoint the key reactions that are re-sponsible for these huge uncertainties.
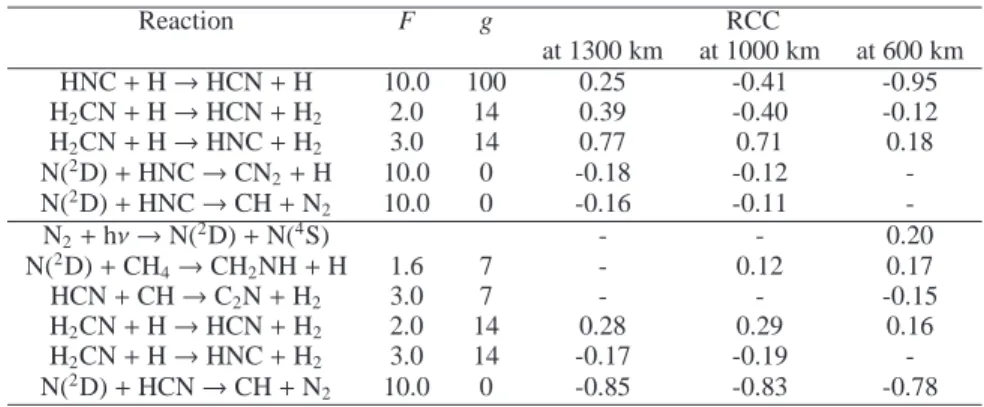
7. Global sensitivity analysis: determination of key reactions
The technique we use is based on the computation of the Rank Correlation Coefficients (RCCs) between rate constants and abundances at different altitudes. It has been previously used and described in Carrasco et al. (2007); Dobrijevic et al. (2008); H´ebrard et al. (2009). The greater the absolute value of a RCC is, the more important the contribution a given reaction rate has on the abundance uncertainty for a given species. As a conse-quence, all reactions with a high absolute value of RCC should be studied in priority to improve the accuracy of the model con-cerning HNC and HCN in the upper atmosphere of Titan. The power of this technique, based on the uncertainty propagation study and the knowledge of RCCs, to improve photochemical models has been demonstrated for Titan by H´ebrard et al. (2009) and for Neptune by Dobrijevic et al. (2010a).
Among the few key reactions we give here, H2CN + H, HNC
+ H and N(2D) + HNC/HCN are clearly the most important
ones for HNC and HCN in the upper atmosphere of Titan. In Appendix A, we discuss in more details our current knowledge about these reactions.
8. Conclusions
Following the prediction of Petrie (2001), Moreno et al. (2011) concluded that a purely ionospheric source may be quantita-tively viable for HNC, provided that the protonation rates are
not too high. Here we show that a purely neutral source is effi-cient enough to produce HNC and HCN in the upper atmosphere of Titan in agreement with current observations. Our study does not mean that ion-molecule mechanisms are not relevant to pro-duce HNC but it shows that neutral reactions are competitive processes in the upper atmosphere and in the middle atmosphere as well.
The aim of the present work is to investigate as exhaustively as possible the neutral chemistry of HNC and HCN in order to construct a chemical scheme as complete as possible, to evalu-ate the uncertainties on the results that originevalu-ate from the ones attached to the neutral reactions and to determine the key reac-tions that should be studied in priority to improve the model’s precision regarding neutral chemistry. We show that the preci-sion on the HCN abundance predicted by photochemical models is currently strongly limited by the poor knowledge of some re-action rates, especially the isomerization rere-action H + HNC →
HCN + H. Further studies of the reactivity of H2CN with H and
the reactivity of N(2D) with HNC and HCN are also very
impor-tant.
Our results are a basis for studying the production and loss of HNC and HCN in the ionosphere of Titan. For instance, Krasnopolsky (2009) stated that 24% of the production of HCN comes from ion reactions, while ion reactions account only for 17% of the loss of HCN. More recently, Plessis et al. (2012) found that the production of HCN and HNC are about 5.9 ± 2.5
molecule cm−3s−1and that 65% of this production comes from
the dissociative recombination reaction HCNH+ + e−. So, we
can expect that the production of HCN and HNC should be greater than the production we find in the present study taking into account only neutral chemistry. However, we can also pre-dict that uncertainties in ion-reaction rates might increase the un-certainty on HNC and HCN mole fractions obtained by the mod-els. In conclusion, a coupled neutral and ion model is required to investigate the impact of ion chemistry on these compounds, to determine the uncertainties on the computed abundances and to pinpoint the key reactions involving ions.
Acknowledgements. The authors acknowledge partial financial support from the Observatoire Aquitain des Sciences de l’Univers (OASU), from the CNRS ”Programme National de Plan´etologie” and from the CNRS interdisciplinary program ”Environnements Plan´etaires et Origines de la Vie (EPOV)”.
Appendix A: Comments on selected reactions
A.1. N(4S) + CH 3
We have shown that the reaction N(4S) + CH
3 → products
is of prime importance in the production of H2CN, which
ap-pears to be a key compound for initiating both HCN and HNC chemistries in Titan’s upper atmosphere. For this reason, we give in the following details our recommendation for the rate constant and the branching ratios.
The N(4S) + CH
3 reaction has been studied
experimen-tally down to 200K (Marston et al. 1989a) showing a high
value for the rate constant at 300 K (8.5 ± 2.0) × 10−11 cm3
molecule−1 s−1 with a complex negative temperature
depen-dence. The authors propose two expressions for the global rate
constant, k(200−423K) = 6.2×10⁻¹¹+ 2.2×10⁻⁹exp(−1250/T )
cm3 molecule−1 s−1 or k(T ) = 4.3 × 10⁻¹⁰exp(−420/T ) cm3
molecule−1s−1. The second one deviates from the experimental
results at low temperature and may underestimate the rate con-stant at temperatures representative of Titan’s atmosphere. The possible exothermic exit channels are:
Table 4. Key reactions responsible for HNC (top) and HCN (bottom) abundance uncertainties at 1000 km and 600 km. Only reactions with RCCs
greater than 0.15 are given.
Reaction F g RCC at 1300 km at 1000 km at 600 km HNC + H → HCN + H 10.0 100 0.25 -0.41 -0.95 H2CN + H → HCN + H2 2.0 14 0.39 -0.40 -0.12 H2CN + H → HNC + H2 3.0 14 0.77 0.71 0.18 N(2 D) + HNC → CN2+ H 10.0 0 -0.18 -0.12 -N(2 D) + HNC → CH + N2 10.0 0 -0.16 -0.11 -N2+ hν → N(2D) + N(4S) - - 0.20 N(2D) + CH 4→ CH2NH + H 1.6 7 - 0.12 0.17 HCN + CH → C2N + H2 3.0 7 - - -0.15 H2CN + H → HCN + H2 2.0 14 0.28 0.29 0.16 H2CN + H → HNC + H2 3.0 14 -0.17 -0.19 -N(2 D) + HCN → CH + N2 10.0 0 -0.85 -0.83 -0.78 N(4S) +2CH 3 →2H2CN +2H ∆Hr(298K) = −153 kJ.mol−1 →1HCN +2H +2H ∆H r(298K) = −48 kJ.mol−1 →1HCN +1H 2 ∆Hr(298K) = −484 kJ.mol−1 →1HNC +1H 2 ∆Hr(298K) = −431 kJ.mol−1
Product branching ratios have been obtained for the N(4S)
+ CH3and N(4S) + CD3reactions (Marston et al. 1989b)
lead-ing mainly to H2CN + H formation (85-100%) with some HCN
formation (0-15%). These authors suggest that HCN formation
is associated with H2, however HCN + H2 production is
spin-forbidden and needs intersystem crossing to occur. Additionally recent ab-initio calculations (Cimas & Largo 2006) found almost
100% of H2CN production in good agreement with previous
cal-culations (Nguyen et al. 1996). As H2CN may have enough
in-ternal energy (153 kJ.mol−1) to overcome the dissociation barrier
for C-H dissociation (130 kJ.mol−1), some HCN + H + H may be
produced (Nguyen et al. 1996). The HCN obtained by Marston
et al. (1989a) may also come from reaction of H2CN with atomic
nitrogen (used in excess in their experiment) through H2CN +
N(4
S) → HCN + NH or more likely through H2CN + N(4S) →
CH2+ N2followed by N(4S) + CH2→ HCN + H. We choose to
recommend a rate constant value of 6.2 × 10⁻¹¹cm3molecule−1
s−1between 150K and 200K with a branching ratio equal to 90%
for H2CN + H formation and 10% for HCN + H + H. Thus :
Reaction k (cm3molecule−1s−1) F g N(4S) + CH 3→ H2CN + H 5.6 × 10⁻¹¹ 1.6 7 N(4S) + CH 3→ HCN + H + H 0.6 × 10⁻¹¹ 2 7 A.2. HCN→HNC isomerization
A specific problem in HCN/HNC formation is the possibility of isomerization. The HCN → HNC isomerization barrier is
calcu-lated equal to 186 kJ.mol−1, and the HNC → HCN isomerization
barrier is calculated equal to 124 kJ.mol−1at the
RCCST(T)/cc-pVTZ level (DePrince III & Mazziotti 2008). Some reactions producing HCN and all reactions producing HNC are highly exothermic. In Titan’s atmosphere, relaxation occurs through collisional stabilization. The collisional stabilization time may
be estimated (Forst 2003) as equal to 1
3×10⁻¹⁰×[M] ≈ 10−7 s at 1
Torr, much greater than the interconversion time-scale estimated
as < 10−13 s (Herbst et al. 2000). Thus, as relaxation slowly
occurs, isomerization leads to equilibrated isomeric abundances at each internal energy. The final balance is determined at or near the effective barrier for isomerization. As the available en-ergy of the exothermic reactions producing HCN and HNC can
be distributed among the translational and vibrational-rotational modes of both products, a fraction of HCN/HNC molecules will possess enough internal energy to overcome the isomerization barrier. To a first approximation we assumed roughly statistical distribution of energy in the fragments and consider that all of the HCN or HNC produced above the isomerization barrier will lead to equal amounts of HCN and HNC (Herbst et al. 2000).
The HNC + H → HCN + H reaction (∆Hr(298K) =
-53 kJ.mol−1) has been calculated to possess a low
bar-rier. The first estimation of the barrier was performed by Talbi & Ellinger (1996) at a relatively high level of theory (MP4/6-311++(3df,2p)//MP3/6-311++G(d,p)) with a best
es-timate value equal to 17.6 ± 4 kJ.mol−1. Sumathi & Nguyen
(1998) found a barrier equal to 13.8 kJ.mol−1at the
CCSD(T)/6-311++(3df,3pd)//CCSD(T)/6-311++G(d,p) level and more
re-cently Petrie (2002) found a value equal to 8.0 kJ.mol−1e at
the CBS/RAD or B3LYP/6-311G** level and 12.9 kJ.mol−1at
the QCISD/6-311G* level. With estimated values between 8.0
kJ.mol−1 (960K) and 18.0 kJ.mol−1 (2160K), the rate will be
low, but not negligible, for relaxed HNC. Moreover, as HNC is produced mainly with high internal energy there is a possibility of rate enhancement. For relaxed HNC we recommend the rate constant calculated by Sumathi & Nguyen (1998) with an av-erage value of the various calculations for the barrier including Petrie (2002): Reaction k (cm3molecule−1s−1) F g H + HNC → HCN + H 4.03 × 10⁻¹¹× exp(−1200/T ) 10.0 100 A.3. N(2D) + CH 4 The N(2D) + CH
4 reaction has been studied experimentally
(Takayanagi et al. 1999; Umemoto et al. 1998) and theoreti-cally (Ouk et al. 2011; Takayanagi & Kurosaki 1999; Takayanagi et al. 1999) and a review has been performed by Herron (1999). Theoretical calculations suggest two pathways for this
reac-tion, direct H atom abstraction and N(2D) insertion in one C-H
bond, both mechanism presenting a barrier in the entrance val-ley (Ouk et al. 2011; Takayanagi & Kurosaki 1999; Takayanagi et al. 1999). It should be noted that ab-initio calculations with DFT and CCSD methods lead to the absence of a barrier for
the insertion (Balucani et al. 2009). The N(2D) + CH4reaction
has been studied experimentally in detail by Takayanagi et al.
(1999) leading to k(223-292K) = 7.13 × 10⁻¹¹× exp(−755/T ) cm3molecule−1s−1. N(2D) +1CH 4 →1CH2NH +2H ∆Hr(298K) = -318 kJ.mol−1 →2CH 3+3NH ∆Hr(298K) = -126 kJ.mol−1
Umemoto et al. (1998) found a ratio between H2CNH + H /
NH + CH3 equal to 0.8/0.3. Balucani et al. (2009) studied this
reaction in a crossed beam experiment at high collision energy
(above 22 kJ.mol−1which corresponds to T > 2600K)
suggest-ing an increassuggest-ing NH branchsuggest-ing ratio with the temperature and
also H2CNH and CH3N production. As their results are
ambigu-ous and correspond to high collisional energies, we preferred to use the Herron (1999) average value for the global rate constant (there is a typographical error in the Herron paper: it should be
A = 4.8 × 10⁻¹¹instead of 4.8 × 10⁻¹²in table 3) associated with Umemoto et al. (1998) branching ratios :
Reaction k (cm3molecule−1s−1) F g N(2D) + CH 4→ CH2NH + H 3.5 × 10⁻¹¹× exp(−755/T ) 1.6 7 N(2D) + CH 4→ CH3+ NH 1.3 × 10⁻¹¹× exp(−755/T ) 1.6 7 A.4. H + H2CN
The H + H2CN reaction is a key reaction for both HCN
and HNC production. The rate constant for this reaction has
been measured to be greater than 7 × 10⁻¹¹ cm3 molecule−1
s−1 (Nesbitt et al. 1990) and the authors also determined
HD/(HCN+HNC) branching ratios for the H + D2CN reaction,
leading to HD/(HCN+HNC) = 5 ± 3. This reaction has two exothermic bimolecular exit channels:
2H
2CN +2H →1H2+1HNC ∆Hr(298K) = -276 kJ.mol−1
→1H
2+1HCN ∆Hr(298K) = -331 kJ.mol−1
Previous theoretical calculations (Nguyen et al. 1996; Larson
et al. 2006) show no barrier in the entrance valley for H2CNH
formation. We performed new ab-initio calculations at the DFT/M06-2X/vtz and MRCI+Q/vqz levels (Loison et al. in
preparation) showing unambiguously that H2CNH formation
oc-curs in addition to the direct H atom abstraction without bar-riers in the entrance valley. The only possible evolution of the
H2CNH molecule is back-dissociation or H2+ HNC formation,
the H2 + HCN exit channel involving a high energy exit
bar-rier located well above the reactant energy and therefore
forbid-den at 150-200 K. H2 + HNC production also involves a high
exit barrier calculated close to the energy level of the reactants. The position of the transition state TS varies with the calculation
level and has been found to range between +15 kJ.mol−1 and
-9 kJ.mol−1 by comparison with the reactants energy (Zhou &
Schlegel 2009; Nguyen et al. 1996). As this energy is critical to estimate HNC production, we calculate it at the MRCI+Q/vqz
+ ZPE(DFT/M06-2X/vtz) level leading to a TS energy equal to
-9 kJ.mol−1below the reactants energy. To estimate the amount
of HNC formed, we performed RRKM calculations (Loison et al, in preparation) with a TS energy given by the MRCI+Q/vqz calculations and the geometry and vibrational frequencies ob-tained at the DFT/M06-2X/vtz level. The main exit channel of
the H2CNH adduct is found to be back-dissociation with a yield
greater than 90% except at high pressure when the three body stabilisation plays a role. This corresponds to pressures above
those relevant for Titan’s upper atmosphere where H2CN is
sup-posed to be present at high altitude. For the H + D2CN results of
Nesbitt et al. (1990) we attribute the m/e = 3 signal, due to the HD molecule, to direct D atom abstraction, and the m/e = 27 signal, due to HNC (and also HCN coming from HNC
isomer-ization), to the H + H2CN → H2CNH → H2 + HNC pathway.
Our RRKM calculations are then in reasonable agreement with experimental results considering the various uncertainties, par-ticularly regarding the TS energy value. However additional
un-certainties arise from the difference between the H2CNH → H2+
HNC and D2CNH → D2+ HNC dissociation rate constants, and
also from the fact that HCN and HNC will be produced partly above the HCN ⇋ HNC isomerization barrier. Considering a roughly statistical energy distribution in HNC and HCN, we es-timate 20% of total HNC production. For the global rate con-stant, we chose the experimental one even if it is only a minimum value. Reaction k (cm3molecule−1s−1) F g H + H2CN → H2+ HCN 6 × 10⁻¹¹ 2 14 H + H2CN → H2+ HNC 1.2 × 10⁻¹¹ 3 14 A.5. N(4S) + H 2CN
There is one experimental determination of the rate constant be-tween 200 K and 363 K (Nesbitt et al. 1990) and one indirect branching ratio determination (Marston et al. 1989b). The pos-sible exit channels are:
2H 2CN + N(4S) →3CH2+1N2 ∆Hr(298K) = -331 kJ.mol−1 →3NH +1HCN ∆H r(298K) = -229 kJ.mol−1 →1H 2+3CNN ∆Hr(298K) = -150 kJ.mol−1
Cimas & Largo (2006) performed ab-initio calculations and found a small barrier for direct H atom abstraction, located at
11 kJ.mol−1 at the CCSD/p-vtz level but at -13 kJ.mol−1at the
G2 level. This negative barrier is due to the ZPE variation. We performed calculations at the UHF-M06-2X/VTZ level and also
found a barrier for direct abstraction (+6.4 kJ.mol−1 without
ZPE and -3.6kJ.mol−1including ZPE). No barrier was found for
H2CNN adduct formation quickly leading to CH2+ N2
forma-tion. The good agreement between the calculated reaction en-thalpy and the value derived from thermochemical data at 298 K (Baulch et al. 2005) gives us confidence in the calculations and in our conclusion that CH2+ N2is an open exit channel. There is
a large uncertainty about NH + HCN production however which is likely to be a minor but non negligible exit channel between 150 and 200K.
Marston et al. (1989b) found that HCN (and/or HNC)
for-mation is the main product in the N(4S) + CH
3 system, HCN
being attributed to the result of the reaction sequence N(4S) +
CH3→ H + H2CN followed by N(4S) + H2CN → NH + HCN.
However in their experiment, N(4S) was in excess and the HCN
could have been the result of the reaction sequence N(4S) + CH3
→ H + H2CN followed by N(4S) + H2CN → CH2 + N2 and
N(4S) + CH2 → H + HCN/HNC. The experimental rate
con-stant (k(T ) = 1.0 × 10⁻¹⁰× exp(−200/T ) cm3 molecule−1s−1
in the 200-363 K range) has large uncertainties (Nesbitt et al. 1990) and cannot be extrapolated to low temperature as it may be the result of the two reaction channels including the direct ab-straction with a barrier. We point out that a simple capture rate model, with the dispersion term only, leads to a rate constant
equal to k(N(4S)+H2CN) = 4.5 × 10⁻¹⁰× (T/300)0.17× (3/8) =
1.7 × 10⁻¹⁰× (T/300)0.17 cm3 molecule−1 s−1, 4 times higher
than the experimental rate constant equal to 4.4 × 10⁻¹¹ cm3
molecule−1 s−1 at 300 K. Considering the uncertainties in the
experimental results we propose:
Reaction k (cm3molecule−1s−1) F g N(4S) + H 2CN → NH + HCN 1.0 × 10⁻¹¹ 4 0 N(4S) + H 2CN → N2+ CH2 3.0 × 10⁻¹¹ 3 0 A.6. HCN + CH
The total rate constant for this reaction has been measured
30)/T ) cm3 molecule−1 s−1 (Zabarnick et al. 1991). This
ex-pression cannot be extrapolated to low temperature as it yields unrealistically large values. The measured k(296K) is equal to 2.7×10⁻¹⁰cm3molecule−1s−1. A simple capture treatment leads
to a high rate constant (close to 6.0 × 10⁻¹⁰ cm3 molecule−1
s−1 at 298K) due to the strong dipole-dipole interaction. We
propose to scale the capture rate constant to the value at room temperature and to conserve the temperature dependence ap-propriate for the dipole-dipole interaction, leading to k(T ) = 2.7 × 10⁻¹⁰× (T/300)−0.17cm3molecule−1s−1. Theoretical
cal-culations (Du & Zhang 2006) show no barrier for H2CCN
for-mation through CH + HCN → HCC(H)N → H2CCN. H2CCN
can lead subsequently to
1HCN +2CH
→3HCCN +2H ∆H
r(298K) = -23 kJ.mol−1
→1H
2+2CCN ∆Hr(298K) = -42 kJ.mol−1
Osamura & Petrie (2004) have determined that H + HCCN
production has no barrier in the exit channel and that H2+ CCN
production exhibits a tight TS located only 6 kJ.mol−1 above
this exit channel. These two exit channels should therefore have similar branching ratios to a first approximation, even if RRKM calculations are necessary to estimate more precisely their value.
Reaction k (cm3molecule−1s−1) F g
HCN + CH → HCCN + H 1.4 10−10× (T/300)−0.17 3.0 7
HCN + CH → H2+ CCN 1.4 10−10× (T/300)−0.17 3.0 7
A.7. N(2D) + HCN
The first electronically excited state of atomic nitrogen, N(2D)
is known to react quickly with most radicals and molecules (Herron 1999). We performed ab-initio calculations at various
levels for N(2D) attack on HCN in C
s and C2v symmetry. The
most attractive pathways have been found at MRCI+Q/vtz and
R-CCSD(T)/vtz levels for C2v geometry for which the2B1 and
2B
2states show no barrier for HCNN adduct formation. The
sim-ilar results for both methods coupled to the very good agreement between experiments (Ralchenko et al. 2011) and our
calcula-tions at the MRCI+Q/vtz level for N(4S)/N(2D)/N(2P) relative
energies lead us to predict no barrier for this reaction. Further evolution of the adduct can lead to :
N(2D) +1HCN →2H +3NCN ∆H r(298K) = -154 kJ.mol−1 →2CH +1N 2 ∆Hr(298K) = -242 kJ.mol−1 → N(4S) +1HCN ∆H r(298K) = -153 kJ.mol−1 To estimate the branching ratio we can use the various
cal-culations performed for the CH + N2 system (Moskaleva et al.
2000; Berman et al. 2007) which strongly suggest that CH + N2
is the most favored exit channel. As there is no barrier for only two surfaces, there is an electronic factor equal to 2/5. The sim-ple capture rate constant model based on dispersion only leads
to a rate constant close to (2/5) × 4.0 × 10−10× (T/300)−0.17=
1.6 ×10⁻¹⁰×(T/300)−0.17cm3molecule−1s−1. This rate constant
is higher than those for similar reactions, N(2D) + singlet state
molecules such as N(2D) + H
2O and N(2D) + NH3 reactions
which are also likely to occur without a barrier considering their
high rate constant values at 300 K, 4.0 × 10⁻¹¹and 5.0 × 10⁻¹¹
cm3molecule−1s−1respectively (Takayanagi et al. 1998; Herron
1999). To evaluate more carefully the N(2D) + HCN rate
con-stant, we performed MRCI+Q/vtz and R-CCSD(T)/vtz
calcula-tions for the N(2D) + NH
3reaction also showing no barrier for
2B
1and2B2 surfaces. The difference between the experimental
value and the higher capture rate value may be due to several reasons such as a bottleneck in the entrance valley (the inter-action potential is attractive mainly around linear attack) and/or
eventually to a possible relaxation (N(2
D) → N(4S)). The
cap-ture rate constant is a maximum value and therefore, the actual rate constant is likely to be smaller, around (4 − 6) × 10−11cm3
molecule−1s−1by comparison with N(2D) + H
2O and N(2D) + NH3reactions. Reaction k (cm3molecule−1s−1) F g N(2 D) + HCN → CH + N2 5.0 × 10⁻¹¹ 3 0 References
Adriani, A., Dinelli, B. M., L ´opez-Puertas, M., et al. 2011, Icarus, 214, 584 Balucani, N., Bergeat, A., Cartechini, L., et al. 2009, J. Chem. Phys. A, 113,
11138
Banaszkiewicz, M., Lara, L. M., Rodrigo, R., L ´opez-Moreno, J. J., & Molina-Cuberos, G. J. 2000, Icarus, 147, 386
Baulch, D., Bowman, C., Cobos, C., et al. 2005, J. Phys. Chem. Ref. Data, 34, 757
Bergeat, A., Moisan, S., M´ereau, R., & Loison, J.-C. 2009, Chem. Phys. Lett., 480, 21
Berman, M., Tsuchiya, T., Gregusova, A., Perera, S., & Bartlett, R. 2007, J. Phys. Chem. A, 111, 6894
BIPM, IEC, IFCC, et al. 2006, Evaluation of measurement data - Supplement 1 to the GUM: Propagation of distributions using a Monte-Carlo method, Tech. rep., BIPM
BIPM, IEC, IFCC, et al. 2008, Evaluation of the measurement data - Guide to the expression of uncertainty in measurement (GUM), Tech. rep., International Organization for Standardization (ISO), Geneva
Bruna, P., Krumbach, V., & Peyerimhoff, S. 1985, Can. J. Chem., 63, 1594 Carrasco, N., H´ebrard, E., Banaszkiewicz, M., Dobrijevic, M., & Pernot, P. 2007,
Icarus, 192, 519
Chestnut, D. 2001, J. Comp. Chem., 22, 1702
Cimas, A. & Largo, A. 2006, J. Phys. Chem. A, 110, 10912 DePrince III, A. & Mazziotti, D. 2008, J. Phys. Chem. B, 112, 16158
Dobrijevic, M., Carrasco, N., H´ebrard, E., & Pernot, P. 2008, Planet. Space Sci., 56, 1630
Dobrijevic, M., Cavali´e, T., H´ebrard, E., et al. 2010a, Planet. Space Sci., 58, 1555 Dobrijevic, M., H´ebrard, E., Plessis, S., et al. 2010b, Adv. Space Res., 45, 77 Du, B. & Zhang, W. 2006, Int. J. Quantum Chem., 106, 1827
Dunn, M. R., Freeman, C. G., McEwan, M. J., & Phillips, L. F. 1971, J. Phys. Chem., 75, 2662
Eden, S., Limo-Vieira, P., Kendall, P., et al. 2003, Eur. Phys. J. D, 26, 201 Feuchtgruber, H., Lellouch, E., de Graauw, T., et al. 1997, Nature, 389, 159 Forst, W. 2003, Unimolecular reactions: a concise introduction (Cambridge
University Press)
Frisch, M. J., Trucks, G. W., Schlegel, H. B., et al. 2009, Gaussian 09 Revision A.1, gaussian Inc. Wallingford CT
Geballe, T. R., Kim, S. J., Noll, K. S., & Griffith, C. A. 2003, Astrophys. J., 583, L39
Georgievskii, Y. & Klippenstein, S. J. 2005, J. Chem. Phys., 122, 194103 Gurwell, M. & Muhleman, D. 2000, Icarus, 145, 653
Harding, L. B., Georgievskii, Y., & Klippenstein, S. J. 2005, J. Phys. Chem. A, 109, 4646
Hartogh, P., Lellouch, E., Crovisier, J., et al. 2009, Planetary and Space Science, 57, 1596
H´ebrard, E., Dobrijevic, M., B´enilan, Y., & Raulin, F. 2006, J. Photochem. Photobiol. C: Photochem. Rev., 7, 211
H´ebrard, E., Dobrijevic, M., B´enilan, Y., & Raulin, F. 2007, Plane. Space Sci., 55, 1470
H´ebrard, E., Dobrijevic, M., Pernot, P., et al. 2009, J. Phys. Chem. A, 113, 11227 Herbst, E., Terzieva, R., & Talbi, D. 2000, Mon. Not. Roy. Astron. Soc., 311,
869
Herron, J. T. 1999, J. Phys. Chem. Ref. Data, 28, 1453 Hindmarsh, A. C. 1983, Scientific Computing, 55
H ¨orst, S. M., Vuitton, V., & Yelle, R. V. 2008, J. Geophys. Res. - Planet.), 113, 10006
Hubin-Franskin, M.-J., Delwiche, J., Giuliani, A., et al. 2002, J. Chem. Phys., 116, 9261
Kim, S. J., Geballe, T. R., Noll, K. S., & Courtin, R. 2005, Icarus, 173, 522 Klippenstein, J., Georgievskii, Y., & Harding, L. B. 2006, Phys. Chem. Chem.
Phys., 8, 1133
Lara, L. M., Lellouch, E., L `opez-Moreno, J. J., & Rodrigo, R. 1996, J. Geophys. Res. - Planets, 101, 23261
Larson, C., Ji, Y., Samartzis, P., et al. 2006, J. Chem. Phys., 125, 133302 Lavvas, P. P., Coustenis, A., & Vardavas, I. M. 2008, Planet. Space Sci., 56, 27 Magee, B. A., Waite, J. H., Mandt, K. E., et al. 2009, Planet. Space Sci., 57, 1895 Marston, G., Nesbitt, F. L., Nava, D. F., Payne, W. A., & Stief, L. J. 1989a, J.
Phys. Chem., 93, 5769
Marston, G., Nesbitt, F. L., & Stief, L. J. 1989b, J. Chem. Phys., 91, 3483 Moreno, R., Lellouch, E., Hartogh, P., et al. 2010, in Bulletin of the American
Astronomical Society, Vol. 42, AAS/Division for Planetary Sciences Meeting Abstracts #42, 1088
Moreno, R., Lellouch, E., Lara, L., et al. 2011, Astron. Astrophys., 536, L12 Moskaleva, L. V., Xia, W. S., & Lin, M. C. 2000, Chem. Phys. Lett., 331, 269 Nesbitt, F. L., Marston, G., & Stief, L. J. 1990, J. Phys. Chem., 94, 4946 Nguyen, M. T., Sengupta, D., & Ha, T. 1996, J. Phys. Chem., 100, 6499 Nizamov, B. & Dagdigian, P. 2003, J. Phys. Chem. A, 107, 2256 Osamura, Y. & Petrie, S. 2004, J. Phys. Chem. A, 108, 3615
Ouk, C. M., Zvereva-Loete, N., & Bussery-Honvault, B. 2011, Chem. Phys. Lett., 515, 13
Peng, Z., Cailliez, F., Dobrijevic, M., & Pernot, P. 2012, Icarus Petrie, S. 2001, Icarus, 151, 196
Petrie, S. 2002, J. Phys. Chem. A, 106, 11181
Plessis, S., Carrasco, N., Dobrijevic, M., & Pernot, P. 2012, Icarus, in revision Ralchenko, Y., Kramida, A., Reader, J., & Team, N. A. 2011,
NIST Atomic Spectra Database (version 4.1) [Online], Available: http://physics.nist.gov/asd
Samuelson, R., Nath, N., & Borysow, A. 1997, Planet. Space Sci., 45, 959 Shemansky, D. E., Stewart, A. I. F., West, R. A., et al. 2005, Science, 308, 978 Sims, I. R., Queffelec, J. L., Travers, D., et al. 1993, Chem. Phys. Lett., 211, 461 Stoecklin, T. & Clary, D. C. 1992, J. Phys. Chem., 96, 7346
Strobel, D. F., Summers, M. E., & Zhu, X. 1992, Icarus, 100, 512 Sumathi, R. 1996, J. Mol. Struc., 364, 97
Sumathi, R. & Nguyen, M. T. 1998, J. Phys. Chem. A, 102, 8013 Takayanagi, T. & Kurosaki, Y. 1999, J. Mol. Struct. (Theochem), 492, 151 Takayanagi, T., Kurosaki, Y., Misawa, K., et al. 1998, J. Phys. Chem. A, 102,
6251
Takayanagi, T., Kurosaki, Y., Sato, K., et al. 1999, J. Phys. Chem. A, 103, 250 Talbi, D. & Ellinger, Y. 1996, Chem. Phys. Lett., 263, 385
Teslja, A., Dagdigian, P., Banck, M., & Eisfeld, W. 2006, J. Phys. Chem. A, 110, 7826
Toublanc, D., Parisot, J. P., Brillet, J., et al. 1995, Icarus., 113, 2
Umemoto, H., Nakae, T., Hashimoto, H., Kongo, K., & Kawasaki, M. 1998, J. Chem. Phys., 109, 5844
Vaghjiani, G. 1993, J. Chem. Phys., 98, 2123
Vasyunin, A. I., Semenov, D., Henning, T., et al. 2008, Astrophys. J, 672, 629 Vervack, R. J., Sandel, B. R., & Strobel, D. F. 2004, Icarus, 170, 91 Vinatier, S., Bzard, B., Fouchet, T., et al. 2007, Icarus, 188, 120 Vuitton, V., Yelle, R. V., & McEwan, M. J. 2007, Icarus, 191, 722
Wakelam, V., Herbst, E., Loison, J.-C., et al. 2012, accepted in Astrophys. J. Suppl. Ser.
Werner, H.-J., Knowles, P. J., Knizia, G., et al. 2010, MOLPRO, version 2010.1, a package of ab initio programs, See http://www.molpro.net
Wilson, E. H. & Atreya, S. K. 2004, Journal of Geophysical Research (Planets), 109, 6002
Yang, D. L., Yu, T., Wang, N. S., & Lin, M. C. 1992, Chem. Phys., 160 Yelle, R., Strobel, D., Lellouch, E., & Gautier, D. 1997, in Huyghens: Science,
payload and mission, ed. A. Wilson, Vol. ESA SP-1177 (ESA Publications Division, ESTEC, Noordwijk, The Netherlands), 243–256
Yelle, R. V. & Griffith, C. A. 2003, Icarus, 166, 107
Yung, Y. L., Allen, M., & Pinto, J. P. 1984, Astrophy. J. Suppl. Ser., 55, 465 Zabarnick, S., Fleming, J. W., & Lin, M. C. 1991, Chem. Phys., 150, 109 Zhou, J. & Schlegel, H. B. 2009, J. Phys. Chem. A, 113, 9958