HAL Id: hal-02879625
https://hal.archives-ouvertes.fr/hal-02879625
Submitted on 24 Jun 2020HAL is a multi-disciplinary open access archive for the deposit and dissemination of sci-entific research documents, whether they are pub-lished or not. The documents may come from teaching and research institutions in France or abroad, or from public or private research centers.
L’archive ouverte pluridisciplinaire HAL, est destinée au dépôt et à la diffusion de documents scientifiques de niveau recherche, publiés ou non, émanant des établissements d’enseignement et de recherche français ou étrangers, des laboratoires publics ou privés.
ROSACE: A Proposed European Design for the
Copernicus Ocean Colour System Vicarious Calibration
Infrastructure
David Antoine, Vincenzo Vellucci, Andrew Banks, Philippe Bardey, Marine
Bretagnon, Véronique Bruniquel, Alexis Deru, Hembise Fanton
D'andon, Christophe Lerebourg, Antoine Mangin, et al.
To cite this version:
David Antoine, Vincenzo Vellucci, Andrew Banks, Philippe Bardey, Marine Bretagnon, et al.. ROSACE: A Proposed European Design for the Copernicus Ocean Colour System Vicarious Cali-bration Infrastructure. Remote Sensing, MDPI, 2020, 12 (10), pp.1535. �10.3390/rs12101535�. �hal-02879625�
Remote Sens. 2020, 12, 1535; doi:10.3390/rs12101535 www.mdpi.com/journal/remotesensing Article
ROSACE: A Proposed European Design for the
Copernicus Ocean Colour System Vicarious
Calibration Infrastructure
David Antoine 1,2,*, Vincenzo Vellucci 3, Andrew C. Banks 4, Philippe Bardey 5,
Marine Bretagnon 6, Véronique Bruniquel 6, Alexis Deru 6, Odile Hembise Fanton d’Andon 6,
Christophe Lerebourg 6, Antoine Mangin 6, Didier Crozel 7, Stéphane Victori 7, Alkiviadis
Kalampokis 4, Aristomenis P. Karageorgis 8, George Petihakis 4, Stella Psarra 4, Melek Golbol 3,
Edouard Leymarie 1, Agnieszka Bialek 9, Nigel Fox 9, Samuel Hunt 9, Joel Kuusk 10, Kaspars
Laizans 10 and Maria Kanakidou 11
1 Laboratoire d’Océanographie de Villefranche LOV, CNRS, Sorbonne Université, F-06230 Villefranche-sur-Mer, France; [email protected]
2 Remote Sensing and Satellite Research Group, School of Earth and Planetary Sciences, Curtin University, Perth, WA 6845, Australia
3 Institut de la Mer de Villefranche IMEV, CNRS, Sorbonne Université, F-06230 Villefranche-sur-Mer, France; [email protected] (V.V.); [email protected] (M.G.)
4 Hellenic Centre for Marine Research, HCMR, Institute of Oceanography, Hersonissos, 71500 Crete, Greece; [email protected] (A.C.B.); [email protected] (A.K.); [email protected] (G.P.);
[email protected] (S.P.)
5 ACRI-IN, Sophia Antipolis, 06904 Valbonne, France; [email protected]
6 ACRI-ST, Sophia Antipolis, 06904 Valbonne, France; [email protected] (M.B.); [email protected] (V.B.); [email protected] (A.D.); [email protected] (O.H.F.d.); [email protected] (C.L.); [email protected] (A.M.)
7 CIMEL Électronique, 75011 Paris, France; [email protected] (D.C.); [email protected] (S.V.) 8 Hellenic Centre for Marine Research, HCMR, Institute of Oceanography, 19013 Anavyssos, Greece;
9 National Physical Laboratory, Teddington TW11 0LW, UK; [email protected] (A.B.); [email protected] (N.F.); [email protected] (S.H.)
10 Tartu Observatory, University of Tartu, 61602 Tõravere, Estonia; [email protected] (J.K.); [email protected] (K.L.)
11 Department of Chemistry, University of Crete, 71003 Heraklion, Greece; [email protected]
* Correspondence: [email protected] or [email protected]; Tel.: +61-8-9266-3572
Received: 15 April 2020; Accepted: 6 May 2020; Published: 12 May 2020
Abstract: The European Copernicus programme ensures long-term delivery of high-quality, global satellite ocean colour radiometry (OCR) observations from its Sentinel-3 (S3) satellite series carrying the ocean and land colour instrument (OLCI). In particular, the S3/OLCI provides marine water leaving reflectance and derived products to the Copernicus marine environment monitoring service, CMEMS, for which data quality is of paramount importance. This is why OCR system vicarious calibration (OC-SVC), which allows uncertainties of these products to stay within required specifications, is crucial. The European organisation for the exploitation of meteorological satellites (EUMETSAT) operates the S3/OLCI marine ground segment, and envisions having an SVC infrastructure deployed and operated for the long-term. This paper describes a design for such an SVC infrastructure, named radiometry for ocean colour satellites calibration and community engagement (ROSACE), which has been submitted to Copernicus by a consortium made of three European research institutions, a National Metrology Institute, and two small- to medium-sized enterprises (SMEs). ROSACE proposes a 2-site infrastructure deployed in the Eastern and Western Mediterranean Seas, capable of delivering up to about 80 high quality matchups per year for OC-SVC of the S3/OLCI missions.
Keywords: satellite ocean colour; system vicarious calibration; fiducial reference measurements; radiometry; SI-traceability; uncertainty budget; Mediterranean Sea; BOUSSOLE; MSEA
1. Introduction
As of 2020, a number of low-earth-orbit satellites together provide systematic coverage of ocean colour radiometry (OCR) observations over the world’s oceans and coastal zones. Two programmes among this constellation are operational, which means that they are expected to maintain delivery of their observations and products over the long-term, in order to sustain a variety of uses, from, e.g., science of the long-term, climate-driven trends of the marine ecosystem, to services to government and industry users, e.g., water quality monitoring. These two programmes are the joint polar satellite system (JPSS) of the US National Oceanographic and Atmospheric Administration (NOAA), and the European Copernicus programme. The JPSS satellites carry the visible infrared imaging radiometer suite (VIIRS), delivering OCR observations in eight spectral bands in the visible and near infrared (VisNIR) spectral region. The Copernicus Sentinel-3 (S3) satellites carry the ocean and land colour instrument (OLCI), delivering OCR observations in twenty spectral bands in the VisNIR.
For these and any other OCR missions to deliver products of the desired accuracy, a system vicarious calibration (SVC) programme has to run over their entire lifetime [1], which is also a requirement for other types of Earth observation missions that intend to address climate change related questions [2]. Ocean colour SVC (OC-SVC) consists of adjusting the prelaunch mission spectral calibration coefficients of the onboard radiometers through comparison of the top-of-atmosphere (TOA) radiance measured by the mission, to the same quantity derived from using high-quality radiometry data collected in the field and radiative transfer computations to propagate the bottom-of-atmosphere field measurements to TOA [3]. SVC therefore requires a sustained post-launch field programme to collect the necessary data, with the aim of maintaining the level of uncertainty of the derived satellite products within predefined requirements [4–7]. This need for SVC has been demonstrated since the early times of the satellite OCR era [8]. Modern satellite OCR observations must indeed provide the water-leaving radiance in the blue part of the electromagnetic spectrum with a < 5% accuracy over meso- to oligotrophic waters [9,10], which translates as an uncertainty of about 0.002 in reflectance at 443 nm [11] when reflectance is modelled from chlorophyll following [12]. Since the marine signal is generally < 10% of the TOA radiance measured by the spaceborne sensor, achieving this goal requires that the instruments be calibrated to better than 1% uncertainty. This cannot be reached using only onboard calibration devices such as sun diffusers, hence the need for OC-SVC. It is worth remembering that OC-SVC is not an absolute calibration of the sensor. It is an adjustment of the overall response of the sensor plus the atmospheric correction algorithm [1,8]. The goal is to absorb residual uncertainties in order to obtain final products, e.g., the normalized water-leaving reflectance or radiance with the desired accuracy.
Until now, two field programmes have provided space agencies with OC-SVC-quality field observations, both using a moored optical buoy. The marine optical buoy (MOBY [13,14]) has been in operation since 1995 off the island of Lanaï in the Hawaiian archipelago. It continuously delivers hyperspectral reflectance for SVC of the NASA and NOAA instruments (sea-viewing wide field-of-view sensor, SeaWiFS, moderate resolution imaging spectroradiometer, MODIS and VIIRS), and has also been used by international missions, e.g., the European Space Agency (ESA) medium resolution imaging spectrometer (ENVISAT/MERIS), and the Japan Aerospace Exploration Agency (JAXA) global change observation mission-climate, second generation global imager (GCOM-C/SGLI). Another SVC programme was set up to support European OCR missions, at that time the ESA ENVISAT/MERIS. This programme is named BOUSSOLE (“BOUée pour l’acquiSition d’une Série Optique à Long termE” [15,16]) and has been operating continuously since 2003 at an open ocean site in the Northwestern Mediterranean Sea. It is currently used for SVC of the Copernicus Sentinel-3A and -3B OLCI instruments and for the GCOM-C/SGLI. Data from both programmes
have also been used for the SVC of satellite sensors not specifically designed for ocean colour applications such as the thematic mapper (TM) on Landsat 5 and 7, the operational land imager (OLI) on Landsat 8, and the multispectral instrument (MSI) on Sentinel-2A&B [17–19].
The European Organisation for the Exploitation of Meteorological Satellites (EUMETSAT) is in charge of the S3/OLCI marine ground segment as part of Copernicus operations. As such, they envision having a fully independent European in situ OC-SVC infrastructure deployed and operated for the long-term, as has been recommended for the support of Copernicus ocean colour missions [20]. In order to properly set up this significant investment, they first commissioned a study in 2017 to summarize requirements for such an infrastructure [21]. They then called for ideas for what this European OC-SVC infrastructure could be through an invitation to tender (ITT) in 2018, from which they commissioned two studies that worked in parallel during 2019 and delivered their proposed preliminary designs by December of the same year.
This paper summarises the main characteristics of one of the proposed OC-SVC infrastructures, named ROSACE, which stands for “Radiometry for Ocean colour Satellites Calibration and community Engagement”. The high-level rationale for the proposed solution is presented first. The characteristics of the two sites that compose the field segment are then detailed along with the deployment platform, followed by the overall strategy and equipment for the optical system and its calibration. The methodology used to assess the preliminary uncertainty budget of the proposed system is then summarised and results presented. Finally the organisation of the ground segment and the infrastructure operations are outlined. In addition, an autonomous platform capable of hosting the optical system is presented as an option to improve the overall capacity of the infrastructure.
2. High-level Rationale for the Proposed ROSACE OC-SVC Infrastructure
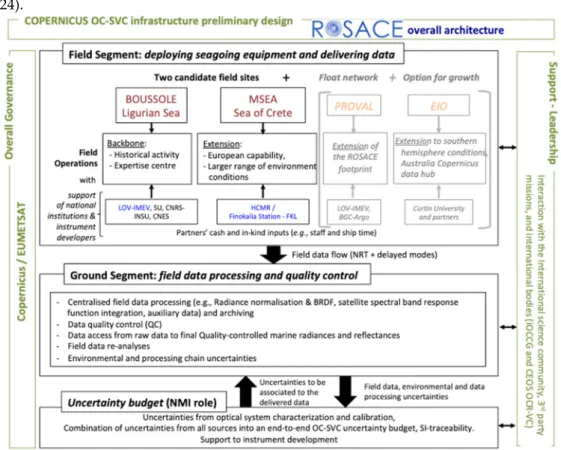
The high-level rationale underlying the ROSACE preliminary design (Figure 1) is to:
1. Take advantage as much as possible of existing European expertise in OC-SVC that has been developed in the past two decades under European (ESA in particular) and national funding, including field operations, SI-traceability and evaluation of uncertainties, associated data quality assurance and quality control and processing and generation of satellite matchups and OC-SVC gains.
2. Reinforce the above and, in addition, build a new European capability in the domain of OC-SVC field radiometry, in order to ensure long-term sovereignty and stability of the Copernicus SVC infrastructure. This includes two sites, collaboration with a national metrology institute (NMI), and new technology developments. The two field sites are in the Ligurian Sea (BOUSSOLE heritage) and the Cretan Sea (MSEA). They were selected by the ESA “Fiducial Reference Measurements For Satellite Ocean Colour” (FRM4SOC [22,23]) study as the two of the best European locations among those currently under evaluation, in part because significant logistical capabilities adapted to maintaining an OC-SVC infrastructure already exist at these sites.
3. Rely on strong national support in conjunction with the main Copernicus funding to ensure that the ROSACE OC-SVC infrastructure is backed by long-term sustainable staff, capability and logistical resources.
4. Be ready to incorporate additional partnerships in order to improve redundancy inside the OC-SVC infrastructure, to enlarge the database onto which the uncertainty budget is built, to improve, if needed, the methodological baseline used to compute the SVC gains, and to increase the matchup capacity of the OC-SVC infrastructure.
In this logic, collaboration with a possible third site in the Eastern Indian Ocean (EIO, off Western Australia) is envisaged, which has also been identified by the FRM4SOC study (see also [24]). This is an option for future extension of the infrastructure, only possible if the EIO site would have the technical capability. Additionally, included in the preliminary design is the possibility to increase the capacity of the infrastructure to deliver in situ data by deploying autonomous profiling floats [25].
5. Ensure close communication with international bodies that work on establishing OC-SVC requirements and fostering international collaboration (e.g., the International Ocean Colour Coordinating Group, IOCCG and the Committee on Earth Observation Satellites Ocean Colour Virtual Constellation, CEOS OCR-VC).
6. Maintain development activities that are vital to allow improvement in data acquisition and processing procedures and ultimately improve the data quality of the OC-SVC infrastructure, and also to better secure national support for this European infrastructure. The rationale supporting ROSACE is rather simple. It consists of leveraging the two-decade-long experience as well as previous European investments in order to be in a position to deliver an operational system meeting the Copernicus requirements in the time frame anticipated by EUMETSAT, i.e., likely in line with the launch of the Sentinel-3 C and D units and beyond (from 2023/2024).
Figure 1. Overall architecture proposed for radiometry for ocean colour satellites calibration and
community engagement (ROSACE).
That is why ROSACE capitalises on the single existing European OC-SVC infrastructure, i.e., the BOUSSOLE site and project, as the backbone that supports the development of a more European-integrated system, including a second European site in the best suited location of the European Seas for OC-SVC, i.e., the MSEA site. This strategy appears as the most robust approach to achieve, in a safely managed way, the full compliance with the stringent requirements of an operational programme like Copernicus/Sentinels, including lowering the uncertainties in OC-SVC. ROSACE also incorporates innovative solutions, in the development of specifically designed European instruments and calibration devices that will fully match the OC-SVC requirements and fulfils the need for modularity, and the possibility to integrate a network of autonomous profiling floats to complement the fixed sites.
The success of such a long-term service for the Copernicus programme also depends on adequate competence transfers and periodic training. This is one of the roles assigned to universities and public research institutions involved in ROSACE, i.e., to transfer knowledge, and it constitutes a fundamental task for building a long-term infrastructure that will operate across generations.
3. The Field Segment
3.1. Metrology Rationale
At the present time, SVC is the only means to achieve the uncertainties needed for remotely sensed OCR observations. It is well established that the SVC reference system (radiometry measurements) needs to be robustly tied to the International System of Units (SI) and be collected in meso- to oligotrophic waters, ideally from a location with stable oceanographic conditions [6,8]. Provided that there are enough reliable observations of the site from space for any given sensor to allow statistically reliable calibration, it could be argued that the SVC requirements can be achieved by a single infrastructure, in a single location. This would also require that the instrumentation, maintenance and recalibration, is unequivocal and guaranteed to be operational in this manner for the foreseeable future. In the case of climate monitoring and the Copernicus series of sensors this timescale must span many decades. This guarantee must stand irrespective of funding and unexpected events, either natural or manmade. The 2020 global pandemic [26] is an example where large numbers of assets had to be recovered from sea because their servicing or emergency recovery were no longer feasible during lockdown measures taken by many governments (e.g., [27]). Equipment or site redundancy and autonomous platforms can help in such circumstances.
It soon becomes clear that implementation of a single site infrastructure is of high risk and in engineering terms considered a single critical point of failure. Even if multiple spares are ready and waiting to be deployed, a single (non-independently checked) calibration route provides a risk that no metrology institute would safely rely upon for any measurement. Primary radiometric scales and ancillary measurements are regularly checked across international borders through formal comparison with peers to ensure consistency and avoidance of any potential errors, (standards/procedures/typographical). This comparison process is a fundamental requirement to ensure international consistency of measurements and trade.
It thus becomes apparent that a minimum requirement to ensure long term consistency and reliability of a reference measurement system for OC-SVC is two independently calibrated systems of similar performance and in different geographical locations. It is also clear that providing the two independent measurement systems always agree (within their uncertainties) then this strategy of two measurement systems can probably be relied upon. However, as anyone making comparative measurements knows, if the two references disagree then you are left with the question of which one do you believe?
For this reason it is normal practise, for any reference, e.g., a standard light source (FEL lamp) or detector, to consist of a group of a minimum of three entities, to provide redundancy and the likelihood of at least two being consistent and a probabilistic indicator of closeness to the truth. The recent redefinition of the kilogram for example was only considered reliable and acceptable once there were three independent measurements made that were consistent within their uncertainties (also below a prescribed minimum level) and that at least two of the measurements had to be from a completely different traceability route. A robust long-term reference for OC-SVC should follow the same minimal metrological rigour, i.e., at least three independent measurement infrastructures and at least two independent traceability paths. The ROSACE proposal of two linked European sites, when added to the existing North American MOBY infrastructure, meets both these metrological requirements.
There are many other benefits, such as a redundancy from unforeseen system failures, increased number of matchup opportunities, randomisation of environmental effects, etc. but fundamentally, a global system of just two sites would be metrologically and operationally high risk. Following the same metrological rationale, ROSACE will allow “built in” systematic round robin intercalibration exercises to validate 1) the calibration procedures between the two field sites and a third independent calibration system operated by the Tartu Observatory and 2) the consistency of measurements and uncertainties between the two sites with an independent transfer profiling radiometer (see also Section 7.1).
3.2. Practical Considerations, Specific Role of Each Site
Other elements, of a more practical type, have also been considered in selecting two sites to develop the ROSACE OC-SVC infrastructure. Essentially, what we proposed was not a simple doubling of identical (twin) sites. It rather takes advantage of specific aspects present at the two locations in order to leverage their complementarity. These elements are:
• Geophysical properties are similar yet different enough at the two sites, so that they are complementary, not simply redundant (see the sites descriptions in Sections 3.3 and 3.4). • Expertise in deploying and maintaining large oceanographic buoys is similar at the two sites,
i.e., the Laboratoire d’Océanographie de Villefranche from the Institut de la Mer de Villefranche (LOV-IMEV) and the Hellenic Centre for Marine Research (HCMR). However, a longer and more developed experience with optics, radiometry and OC-SVC exists at LOV-IMEV.
• BOUSSOLE buoys and instrumentation exist at LOV-IMEV, ready to be used (until improved versions become available) in continuation of the present effort and to host the new optical system for testing, and ensure continuity of the time series.
Therefore, the logic is to use the BOUSSOLE site not only for operational delivery of OC-SVC data, which certainly remains a main objective, but also as a development and test site, where: • Improvements in the buoy structure can be tested before new versions are built and
operationally deployed at MSEA and BOUSSOLE.
• The new optical system can be deployed in parallel to the one currently used (SeaBird HyperOCR radiometers). This is not to qualify the new radiometer system, which will be of superior radiometric quality to that of the current one, but rather is an opportunity to ensure continuity of the time series between MERIS and OLCI observations.
• Testing of new equipment or further improvement of the optical system, can be carried out on one site before being transitioned to permanent upgrades at both sites.
3.3. The BOUSSOLE Site
3.3.1. Location and General Characteristics
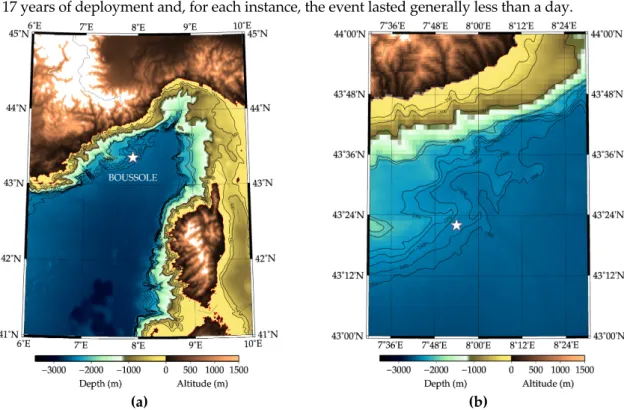
The BOUSSOLE site is located at 32 nmi (59 km) offshore from Nice (France) in the NW Mediterranean Sea (43°22’ N, 7°54’ E; Figure 2). Water depth at the site is about 2440 m. This site has been already described in detail in [28], which readers are referred to. Here we provide a summary of the features that are most relevant to OC-SVC. Time series, histograms and climatological values of a number of parameters can be found in [29].
3.3.2. Weather and General Hydrology
Wind speeds at BOUSSOLE are generally moderate (Figure 3Error! Reference source not found.a). Over the past 15 years, only 3% of recorded wind speeds were greater than 15 m s-1, and
16% of records were above 10 m s-1. These higher wind speeds, and the associated larger waves are
concentrated in the 5 months from November to March. Dominant wind directions are from the west to southwest and from the northeast sectors (Figure 3b). These are channelled into these two main directions on the one hand by the general atmospheric circulation of the region, and, on the other hand, by the topography formed by the Alps and Corsica.
Significant wave heights at BOUSSOLE were mostly less than 2 m, although values as high as 5 m could be occasionally recorded (Figure 3c). The wave period (not shown) was around 4–6 s, which is typical of the Mediterranean Sea.
This site was selected in particular because currents are extremely low. This peculiarity is due to the position close to the centre of the cyclonic circulation that characterizes the Ligurian Sea. The northern branch of this circulation is the Ligurian current, forming a jet flowing close to the shore in the NE to SW direction and creating a front whose position is seasonally varying, closer to the shore in winter than in summer. The southern branch is a SW to NE current flowing north of Corsica and the
eastern part of the circulation is simply imposed by the geometry of the basin. The 17 years of BOUSSOLE deployments have confirmed the low-current character of the site (high currents would have been identified as strong buoy tilts). Stronger currents have been very occasionally revealed through observing the buoy plunging unusually deep. This situation occurred only four times during the 17 years of deployment and, for each instance, the event lasted generally less than a day.
(a) (b) Figure 2. (a) The BOUSSOLE site location in the NW Mediterranean Sea (white star) including
bathymetry of the area and (b) zoom on the site itself showing more details of the bathymetry.
(a) (b)
Figure 3. (a) Wind speed and direction and (b) significant wave height, from data collected by the
Côte d’Azur meteorological buoy (Météo-France) located 2 nmi from BOUSSOLE.
The temperature and salinity conditions at BOUSSOLE are illustrated in Figure 4a. The minimum sea surface temperature (SST) was about 12.7 °C (associated with a salinity of 38.4 psu), which is a constant value reached in the coldest winters when the water mass was fully mixed down to the bottom. This deep mixing contributed to the formation of the bottom waters of the Western Mediterranean Sea.
The seasonality of the physical forcing drove the seasonal changes of nutrients and phytoplankton, as illustrated here by the surface nitrate and total chlorophyll-a concentrations
([TChl-a], Figure 4b). Oligotrophic conditions prevailed during the summer with undetectable nitrate levels
and [TChl-a] lower than 0.1 mg m−3 (with a minima around 0.05 mg m−3). The higher concentrations
are on average in the range 0.8-1.7 mg m−3 (with a maxima up to about 5 mg m−3), during the early
spring bloom (February to March or April) when surface waters are nitrate replete. Moderate
[TChl-a], between 0.1 and 0.2 mg m−3, characterize most of the other periods of the year. Interannual
variability of physical forcing, specifically the depth of the winter convection, determines the magnitude of the phytoplankton spring bloom [30].
(a) (b)
Figure 4. (a) Average seasonal cycles of sea-surface temperature (black symbols) and sea-surface
salinity (open symbols) at BOUSSOLE (depth < 10 m), from the buoy data collected from 2003 to 2019. (b) Average seasonal cycles of sea-surface [TChl-a] (black symbols) and nitrate concentrations (open symbols). Vertical bars are standard deviations of the displayed monthly means (slightly shifted between the two parameters for clarity).
An important consequence of the above characteristics, in particular water depth, circulation, and distance from shore, is that waters at the BOUSSOLE site are permanently of the Case-1 category (following [31]). This assertion is quantitatively evaluated by plotting the irradiance reflectance at 560 nm, determined from the buoy measurements, as a function of [TChl-a] (Figure 5), and superimposing on top of the data a theoretical upper limit of this reflectance for Case-1 waters [32]. With the exception of a few outliers, all data points are below the curve, demonstrating that waters permanently belong to the Case-1 type at the BOUSSOLE site.
Figure 5. Irradiance reflectance at 560 nm, R(560), as a function of [TChl-a]. The points are from 3
years of clear-sky quality-checked buoy measurements taken within one hour of solar noon. The curve is the upper limit for Case-1 waters [32] (adapted from [28]).
Inherent optical properties (IOPs) measured at the BOUSSOLE site include the particulate absorption coefficient (ap, from samples collected during monthly cruises), the particulate
backscattering coefficient, bbp, and the particulate beam attenuation coefficient, cp. Average seasonal
BOUSSOLE, consistent with the description already provided for [TChl-a]. This is expected for typical Case-1 waters.
(a) (b)
Figure 6. (a) Average seasonal cycles at BOUSSOLE of the particulate beam attenuation coefficient
at 650 nm and (b) the particulate backscattering coefficient at 550 nm, from the buoy data collected from 2003 to 2019 (depth < 10 m).
3.3.4. Remote-sensing Reflectance
Underwater downward and upward irradiances, upwelling nadir radiances and above-water downward irradiances have been measured continuously at BOUSSOLE since September 2003, initially with 7-band multispectral radiometers (Satlantic 200-series; wavelengths 412, 443, 490, 510, 560, 670 and 683 nm) and, from 2007, also using hyperspectral radiometers (Satlantic HyperOCR series; 350–850 nm with a 3 nm resolution). The multispectral instruments have been decommissioned at the end of 2017.
Apparent optical properties (AOPs) are derived from these measurements, such as the diffuse attenuation coefficient for downward irradiance or the remote sensing reflectance [16,28]. The latter is shown in Figure 7, for λ = 443 nm, as an example illustrating the seasonal signal as well as the quasi-systematic observations through the 14 years displayed here.
Figure 7. 2004–2017 time series of the remote sensing reflectance at 443 nm at BOUSSOLE. 3.3.5. Atmospheric Parameters
BOUSSOLE benefits from the general conditions prevailing in the Mediterranean Sea, which is known for being a rather clear-sky area. Seasonal cycles derived from the MODIS cloud fraction products are displayed in Figure 8a and they clearly illustrate these characteristics.
The aerosol optical depth (AOD) and aerosol Angstrom exponent have been derived both from measurements at a coastal AERONET site (Cap Ferrat; 43°41’ N, 7°20’ E; automatic CIMEL CE318 sun photometer) and from measurements at the BOUSSOLE site offshore, using a hand-held CIMEL CE317 sun photometer. These measurements reveal that AODs are actually extremely similar at both sites (Figure 8b), with seasonal values from around 0.05 to 0.1 at 865 nm. The Angstrom exponents, which are determined by the aerosol types and their size distribution, are however markedly different, with values steadily around 1.4 at the Cap Ferrat station and around
0.6 at the BOUSSOLE site. This is also expected, because coastal aerosols include a larger proportion of small particles of continental origin than marine aerosols, and therefore have a larger Angstrom exponent.
The total ozone content over BOUSSOLE varied from about 290 to 400 Dobson units (DU, not shown), with maxima generally in winter and minima at the end of summer. Average values in summer were around 340 DU. These values were derived from data of the NASA AIRS (Atmospheric Infrared Sounder), also indicating a decline of concentrations since around 2011.
(a) (b)
Figure 8. (a) Average seasonal cycles of the cloud fraction (moderate resolution imaging
spectroradiometer (MODIS) product [33], average from 2012 to 2015) for the four sites indicated. The curve for the southern hemisphere Eastern Indian Ocean (EIO) site is artificially shifted by 6 months. (b) Average seasonal cycles of the aerosol optical thickness at 865 nm (black symbols) and of the aerosol Angstrom exponent (open symbols), both at the Cap Ferrat coastal AERONET station (triangles) and at the offshore BOUSSOLE site (circles).
3.3.6. Spatial Homogeneity
In situ measurements have a horizontal sampling scale on the order of tens of metres, whereas satellite-derived quantities have sampling scales of hundreds of metres to 1 km. Therefore, when comparing parameters derived from both approaches, an important aspect to consider is the spatial homogeneity of the measurement site.
Spatial surveys have, therefore, been conducted during BOUSSOLE monthly cruises [34], by following a grid pattern of about one square nautical mile centred on the buoy site, during which along-track fluorescence measurements were performed. Changes of this small-scale spatial variability of the chlorophyll-a fluorescence are illustrated in Figure 9 (see also Figure 4 in [28]). They show that the variability is, as expected, low during the oligotrophic summer (around ±10%). The horizontal gradients can reach larger values during the spring bloom and during fall, with values from –70% to +35% (not shown).
A ±10% change of chlorophyll when chlorophyll was initially 0.1 mg m-3 (oligotrophic conditions at BOUSSOLE) translates into changes in reflectance at 443 nm of the order of 0.0015 (3.5%).
Figure 9. Example of grid surveys performed (a) in May and (b) in July 2019. The red dotted line
shows the ship track, and the black curves are the contours of the chlorophyll-a fluorescence (values are indicated on the contour lines).
3.3.7. Summary of the BOUSSOLE Site Characteristics Relevant to OC-SVC
The above sections have shown that BOUSSOLE is a fully characterised site in all aspects that are needed to define relevance for OC-SVC. Extremely few examples such as this exist globally, where hydrology, IOPs, AOPs, biogeochemical quantities (e.g., [TChl-a]) and atmospheric properties have been continuously sampled for nearly two decades.
The site’s main geophysical characteristics are: • Low currents.
• Moderate wind speed/wave height. • Case-1 waters throughout the year.
• [TChl-a] concentration < 0.1-0.2 mg m-3 in summer and fall.
• Characterised kilometre-scale spatial variability. • High occurrence of clear skies.
• Low atmospheric aerosol load throughout the year. As for the logistics:
• Well-established oceanographic institute (> 130 years) close to the site (LOV-IMEV, Villefranche-sur-Mer, France).
• Well-established expertise in marine optics (> 60 years). • Well-trained permanent staff.
• Ships and other necessary equipment all available. • Proven capacity to manage the BOUSSOLE platform.
• Proven record (> 16 years) of uninterrupted acquisition of OC-SVC-quality observations. • Field site identified on marine charts within an area identified for scientific work.
• Meteorological buoy managed by the French weather forecast agency 2 nmi from BOUSSOLE.
3.4. The MSEA Site
3.4.1. Location and General Characteristics
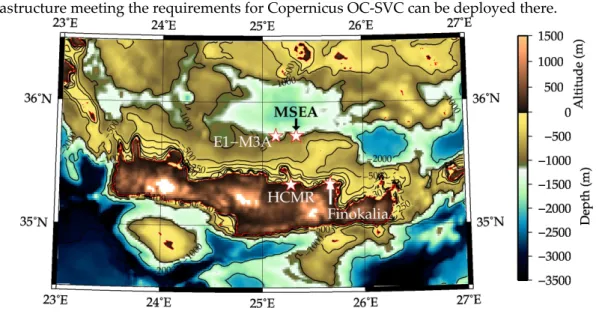
The MSEA site (Cretan Passage, South Sea of Crete; Figure 10) has been suggested by the global evaluation work of Zibordi and Melin [24], Zibordi et al. [20] and the FRM4SOC international OC-SVC workshop report [22] as the best region in the European Seas for OC-SVC. A more detailed analysis of available in situ oceanographic, optical, atmospheric and satellite data demonstrated very similar conditions in the Cretan Sea (north of Crete Island) and that a field infrastructure meeting the requirements for Copernicus OC-SVC can be deployed there.
Figure 10. The proposed location of the MSEA site offshore from the Island of Crete, including
bathymetry of the area.
When combined with logistical considerations, the best site in the Cretan Sea is in the vicinity of the HCMR operational physical and biogeochemical monitoring buoy (E1-M3A) [35]. This location, referred to as MSEA similarly to [24], is at 35°44’ N, 25°20’ E approximately 26 nmi (48 km) north of the HCMR headquarters in Crete. Specifically, it is 10 nmi east of the E1-M3A buoy to optimize the position with respect to Sentinel-3A and B overpasses.
The site has open ocean characteristics representative of a wider area of the Eastern Mediterranean [36], and a water depth of 1400–1500 m. HCMR has operated the E1-M3A buoy in this locale for over 20 years within the framework of the Monitoring, Forecasting and Information System for the Greek Seas (POSEIDON) network [37] and as part of the European contribution to the global ocean observing system (GOOS) ocean sites operational network [38]. From this buoy, a vast array of oceanographic and biogeochemical data has been, and continues to be, gathered for the area. Augmenting the data from the buoy itself are monthly sampling site visits, FerryBox data from the Athens-Crete ferry that passes to the west of the buoy, multiple deployment Argo profiler data of the local area and data from an AUV/glider that is autonomously and continuously operating on transects past the buoy [35].
The proximity of the 6000 m2 HCMR-Crete research centre to the buoy provides the extensive
support facilities, in terms of laboratories, human resources and research vessel support (62 m R/V Aegaeo; 24m R/V Philia), that are necessary for OC-SVC buoy operations. Furthermore, the waters surrounding the island of Crete, in the Eastern Mediterranean, are characterized by very low suspended particle concentrations, and correspond to a “no bloom” trophic regime according to [39]. The Eastern Mediterranean, including the Cretan Sea, is generally characterized by oligotrophy throughout the year making it very similar in this respect to the MOBY site near Hawaii [14]. The following sections further detail the site’s characteristics that support its prime suitability for Copernicus OC-SVC.
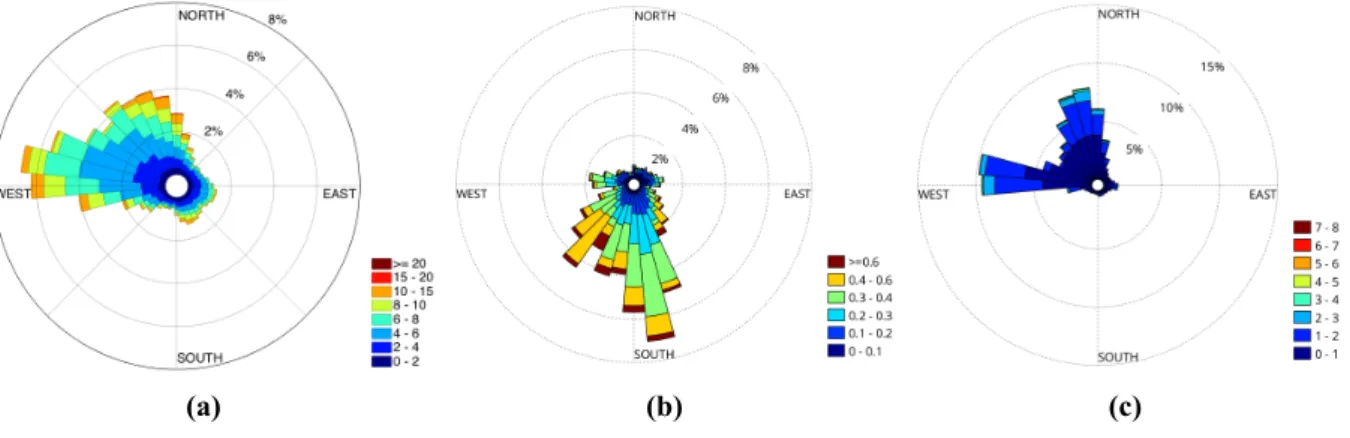
3.4.2. Weather and General Hydrology
In general, weather and circulation conditions at the MSEA site were calm and stable with very few extremes. Wind speeds at MSEA were generally lower and varied less than at the BOUSSOLE site. Over the 11-year period analysed (2007–2018) very few days were recorded with an established wind speed above 15 m s-1. The average wind speed at the site was only 5.3 m s-1 and the majority
were within the range 2–8 m s-1. High wind speeds (> 15 m s-1) and the associated large swells were
rare and might occur in the winter season from November to February. Dominant winds were from the W–NW (Figure 11a), and were channelled into this main direction by the general atmospheric circulation of the region. The Meltemi/Etesian N or NW winds are a repeating summer event for the Cretan Sea, occurring mainly in August. They are rarely very intense and average around 6 m s-1.
Air temperature and pressure 11 year averages were 20.09 °C (min. 2 °C; max. 32 °C; standard deviation (SD) 4.63 °C) and 1015.20 hPa (min. 995 hPa; max. 1035 hPa; SD 5.73 hPa).
Surface current data were collected from the MSEA site using an acoustic Doppler current profiler (ADCP) installed at 1 m over the last 11 years. The currents were extremely low, i.e., in the entire Cretan Sea the flows away from the coast were on the order of 0.1–0.3 m s-1, in contrast to the Levantine Basin, where the meso-scale circulation structures at the near-surface layers were characterized by higher velocities reaching 0.4–0.5 m s-1 [40]. Thus the majority of the currents at the MSEA site were of this low order with a measured average over the last 11 years of 0.23 m s-1. The dominant currents were from the NNW towards the SSE (Figure 11b) and this was dependent on the position of the semi-permanent slow-moving anticyclonic circulation feature in the Cretan Sea [41].
Wave direction generally follows the prevailing wind direction with a slight offset further west and further north. Significant wave heights also followed the wind strength of the area with nearly all waves under 3 m since 2007 and on average less than 1 m (Figure 11c). High swell and high
waves (4–7 m) were extremely rare and occurred sporadically in the winter season from November to February. The wave period for the majority of the 11 years analysed falls within the range of 2–6 s with an average of 3.96 s.
(a) (b) (c)
Figure 11. (a) Wind speed (m s-1) and direction, (b) current speed (m s-1) and direction and (c) significant wave height (m) and direction at the MSEA site (2007–2018). Data from the E1-M3A site.
Average surface water temperature and salinity levels at the MSEA site were 21.35 °C and 39.23 psu respectively. The minimum surface temperature was 15 °C (associated with a salinity of 38.6 psu), which was a constant value reached in winter when the water mass was fully mixed down to the bottom. This deep mixing contributes to the formation of the bottom waters of the Eastern Mediterranean Sea. During summer the maximum surface temperature was 29 °C (associated with a salinity of 39.65 psu). Assimilation of these data together with Ferrybox and glider measurements around MSEA into the POSEIDON models have also allowed a better description of the hydrodynamics of the site and the wider southern Aegean area [42].
3.4.3. Phytoplankton Chlorophyll-a, Water Type and Inherent Optical Properties
In the Cretan Sea, low concentration [TChl-a] maxima tended to occur during late winter to early spring, i.e., late February to March, associated with a very limited phytoplankton spring “bloom”. Monthly in situ sampling of essential biogeochemical variables since 2010 and the deployment of a sediment trap at the site contribute to the study of ecosystem functioning and carbon export potential at MSEA [35].
Phytoplankton surface values of [TChl-a] in the offshore Cretan Sea waters varied between < 0.05 and 0.2 mg m-3, during the stratified and mixing periods, with values < 0.1 mg m-3 being
dominant throughout the year. Subsurface maxima (around 20 m) may rarely reach 1 mg m-3
during the spring bloom while deep chlorophyll maxima (below 75 m) are consistently formed for most of the year [43] and annual primary production values yield < 25 g C m-2 [44]. This very low
level of surface chlorophyll was confirmed through the analysis of bottle samples collected from the location of the MSEA site since the end of 2012. The HPLC data were considered the most accurate and the triangles in Figure 12 confirmed that chlorophyll concentrations rarely rose above 0.2 mg m -3 and values < 0.1 mg m-3 dominate.
Based on productivity and light attenuation data, Ignatiades [44] found that the waters of the Cretan Sea have a deep blue colour and an average value of the spectral attenuation coefficient (Kd),
at 480 nm, of 0.040 m-1. During the EU-funded CINCS project (Pelagic-Benthic Coupling in the
oligotrophic Cretan Sea), five oceanographic cruises were conducted in the central Cretan Sea, focusing on the marine sector from the coast off Heraklion and up to 1700 m depth. Transmissometry profiles (at 660 nm) and bottle data from these revealed the presence of very faint nepheloid layers and very low suspended particulate matter concentrations (SPM <1.5 mg m-3) [45].
In terms of hyperspectral data of IOPs and AOPs a few unpublished profiles exist for the MSEA site. These were derived mostly from the EU FP7 project PERSEUS research cruises in the area in 2013. The first results from the analysis of the complete data set revealed that the Aegean,
including the Cretan Sea and MSEA site, has similar backscatter properties to the rest of the Eastern Mediterranean [46], with bbp at low levels across the visible spectrum (0.001–0.003 m-1). The CDOM
concentrations were also found to be insignificant with values of around 3–5 ppb. The data therefore shows that MSEA has oligotrophic clear oceanic waters that fit into Jerlov’s definition of the most transparent deep blue waters (Case-1) [47].
Figure 12. Total chlorophyll-a at various depths in the surface layer at the MSEA site (red: 2 m;
green: 10 m; blue: 20 m). Circles are for fluorometric [TChl-a] determinations and triangles for HPLC.
3.4.4. Remote-sensing Reflectance
HCMR runs a marine optics suite that has been taking profiles of underwater downward irradiance, upwelling nadir radiance and above-water downward irradiance, as well as IOPs, in the Eastern Mediterranean from various research cruises since 2012 [48–51]. Recently, a move towards fiducial reference measurements for Sentinel-3/OLCI validation from this optical suite has been made by HCMR, with high quality Rrs satellite matchup analysis carried out using the radiometry profiles taken in the waters around Crete from the PERLE-2 oceanographic cruise (February-March 2019) [52]. Furthermore, in the immediate area surrounding E1-M3A and MSEA a ProVal float was deployed between 26/09/2019 and 17/10/2019 and took potential OC-SVC quality radiance and irradiance profiles (see Section 8.1). Figure 13 shows an example of one of the upwelling radiance profiles down to 150 m depth and the average derived surface Rrs spectra from all the ProVal profiles. These results compare very well with the validation spectra and radiometry profiles of [53], all with low diffuse attenuation coefficients (Kd and Ku) and high penetration of light across
the visible spectrum, indicative of the oligotrophic and clear transparent waters at MSEA.
(a) (b) Figure 13. (a) A typical vertical profile of the spectral upwelling nadir radiance at MSEA (ProVal
data, 27/09/2019), (b) Average remote sensing reflectance spectrum at MSEA derived from 35 spectra derived from ProVal data collected in 2019 (note the very small standard deviation).
3.4.5. Atmospheric Parameters
Figure 8a (Section 3.3.4) emphasizes that outside of the winter months of November to February, where all sites suffer from overcast skies, MSEA had significantly more clear skies than all other sites. This is a significant advantage for MSEA as an OC-SVC site because atmospheric clarity is one of the key factors in enabling enough relevant in situ to satellite matchup data.
An AERONET station has been running at HCMR-Crete since 2003 [53]. As already mentioned this is on the northern coast of Crete approximately 26 nmi directly south from the proposed MSEA buoy site and therefore considered to be representative of the atmosphere above the site. In general the AERONET data indicate a typical clear marine atmosphere averaging 0.11 AOD at 870 nm with very occasional maxima above 0.4–0.5, which probably coincide with infrequent Saharan dust events that the entire Mediterranean basin experience [54]. Water vapour values are generally low, with maxima in summer (August) where clear skies and high levels of solar insolation lead to higher evaporation from the sea surface and the warmer air above the sea being able to hold more moisture. The value of the Angstrom exponent is also an indicator of aerosol particle size [55]. Values of α ≤ 1 indicate size distributions dominated by coarse mode aerosols (radii ≥ 0.5 μm) that are typically associated with marine aerosols, and values of α ≥ 2 indicate size distributions dominated by fine mode aerosols (radii ≤ 0.5 μm) that are usually associated with urban pollution and biomass burning [56–58]. For MSEA the average Angstrom exponent over the period 2003–2018 was 1.11 ranging between almost 0 (likely clouds or dust events) and 2 (probably due to the coastal location of the AERONET station and the fact that coastal aerosols include a larger proportion of small particles of continental origin than marine aerosols). Nevertheless, these aerosol figures were indicative that MSEA had a clean Mediterranean maritime environment where there was little to no urban pollution or biomass burning and the dominant aerosol was water vapour.
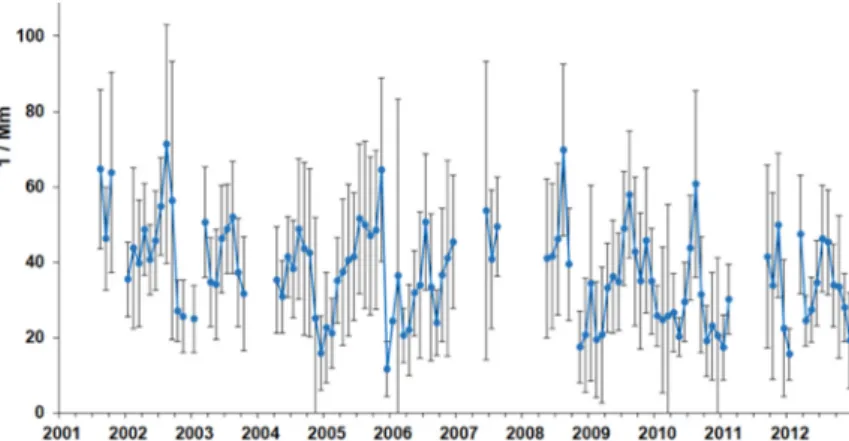
In 2017, the HCMR-Crete AERONET station was moved further east along the coast to Finokalia (35°20’ N, 25°40’ E) to be colocated with the rest of the international atmospheric monitoring equipment of this European supersite [59]. The Environmental Chemical Processes Laboratory (ECPL) of the University of Crete (UoC) has operated the Finokalia station since 1993, participating in the most important international research networks of atmospheric research such as ACTRIS [60], ICOS [61], GAW [62] and EMEP [63]. Ozone monitoring at Finokalia started by the end of 1997 [64–67] and continuous PM10 observations in 2004 [68], while several intensive campaigns have taken place at the site during the past 25 years. Thus, Finokalia observatory is now well characterized and documented as representative of the Eastern Mediterranean background and MSEA site atmosphere. In addition to AERONET and a fully equipped scientific weather station, its great range of atmospheric measurement equipment allows a detailed characterization and monitoring of the atmosphere over the MSEA site. For example, the aerosol scattering coefficient from Finokalia (Figure 14) shows an annual cycle with maximum values observed during summer, minima during winter, while during spring secondary maxima were observed, which were attributed to the infrequent dust transport towards the Eastern Mediterranean. The absorption coefficient presents minimum values during winter, a local maximum was observed in spring followed by a local minimum in June. Maximum values were observed during summer. The same trend was observed for elemental carbon (EC) concentrations, suggesting that EC determines the levels in the area [69].
Figure 14. Aerosol scattering based on wet nephelometer measurements at Finokalia indicate a
declining trend since 2001. Standard deviation shown as light grey bars. Data from [70].
In situ Finokalia and satellite observations show that dust events over the MSEA (Crete) site are infrequent and short-lived [69,71]. The frequency of desert dust events from 2000 to 2016 over the whole Mediterranean can be seen from [72,73]. On average over the MSEA site there were 1–3 dust events per year based on the data between 2000 and 2016. The results of these analyses for the Eastern Mediterranean were supported by the AOD data from the HCMR-Crete AERONET station. Furthermore, dust transport to this part of the Mediterranean region is rather a phenomenon of episodic nature with each event lasting no more than two days [69]. At the Finokalia station the dust events are well captured and identified from a variety of instruments and methods and therefore each event can be identified and characterized with high temporal resolution, which will facilitate their removal from the OC-SVC process. In addition to the ground-based observations at Finokalia, it is quite easy to identify the dust events from the satellite OCR observations themselves [74], and then to discard contaminated observations and not use them in the OC-SVC process.
Similarly, the air quality is very good over the MSEA site. Significant pollution from the oxides of nitrogen gases and other urban and industrial emissions that could adversely affect the clarity of the atmosphere for optical measurements were not evident at MSEA from satellite measurements, model simulations, or in situ measurements at Finokalia. Seasonal means varied between 0.20 ± 0.16 ppbv in winter and 0.56 ± 0.60 ppbv in summer, which agreed with the low tropospheric columns of NO2 seen by satellites (e.g., TROPOMI on Sentinel-5P) over the MSEA local area [75–77].
3.4.6. Spatial Homogeneity
Figure 15 indicates stable levels of top of the atmosphere radiance as measured by S3A/OLCI over the area of the MSEA site, both temporally and spatially. Through the 3-year analysis of the S3A/OLCI time series and across the area of interest around the MSEA site, a consistent median of 0.13 W m-2 sr-1 was found with an SD of only 0.03–0.045 W m-2 sr-1. Furthermore, the combined
spatio-temporal analysis also confirmed these stable levels with the standard deviation varying between similar levels of 0.03 and 0.04 W m-2 sr-1.
Figure 15. Spatial and temporal variability of top-of-atmosphere radiance (Ltoa) from S3A/ ocean and land colour instrument (OLCI; April 2016–May 019) over the MSEA site: (a) median of Ltoa (W m-2 sr -1)for entire time series; (b) standard deviation (SD) of Ltoa time series; (c) combined temporal and spatial (5 pixels × 5 pixels area) SD. (Locational coordinates (same for all panels): top left corner = 24.65° E, 36.30° N; top right = 25.85° E, 36.10° N; bottom right = 25.60° E, 35.20° N; bottom left = 24.40° E, 35.40° N).
Evidence for high spatial homogeneity has also been obtained from surface [TChl-a] estimations for the wider area around Crete Island, with a low spatial and temporal variability during an annual cycle [44,78].
3.4.7. Summary of the MSEA Site Characteristics Relevant to OCR-SVC
MSEA represents the most appropriate and stable open ocean calibration target in European Seas in terms of atmospheric clarity and in situ measurement conditions. This translates into the possibility of achieving a greater number of good matchups with the Copernicus OCR satellite sensors than at any other site in Europe. Furthermore, oligotrophic conditions like those at MOBY and MSEA facilitate very precise tracking of the calibration of in situ optical instruments, which is fundamental to accurate satellite ocean colour system vicarious calibration.
3.5. The Deployment Structure
3.5.1. General Architecture and Design
To the best of our knowledge there are no commercially available off-the-shelf solutions for deployment structures that fully answer the requirements that an OC-SVC infrastructure must meet. These requirements, as a minimum, include:
• Minimizing shading on underwater instruments.
• Maximizing stability (low tilt, no vertical movements), under the specific weather conditions encountered at the deployment site (in terms of currents, tides, wind and wave characteristics). • Being deployable on a deep-water site.
• Giving easy access to divers for handling and cleaning instruments.
• Keeping above-water radiometers far enough from the sea surface to minimize sea spray. • Installing in-water radiometers close enough to the sea surface to enable a proper extrapolation
of measured quantities to the “0-“ level and far enough from the sea surface to minimize possible impacts from storms and occasional yachting activity.
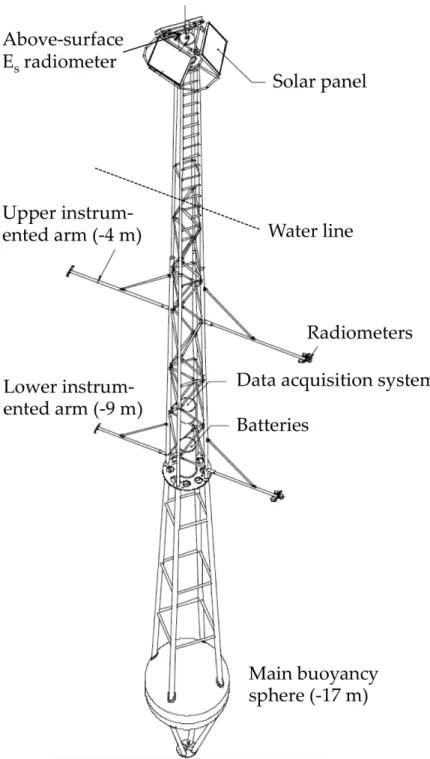
The BOUSSOLE mooring plus buoy [79] (Figure 16) was conceived precisely to meet these requirements. It was also designed to cope with the wave heights, wave periods and currents specific to BOUSSOLE, which a tethered buoy solution could not cope with. Readers are referred to [80] for a full description of the existing design and deployment procedures.
This design and construction have proven to be robust and efficient through (as of today) a 17-year uninterrupted deployment time series, providing adapted hosting conditions for high-quality radiometry measurements. Therefore, the reasons why it is recommended to continue using it in the frame of ROSACE are:
• The concept has been theoretically evaluated, then tested on a reduced-scale model, and then deployed successfully in real conditions.
• The concept has been further validated by external experts [80,81].
• The concept has been demonstrated to be successful. Maintenance procedures effectiveness has been proven over the long-term.
• Options for further improvement of the structure’s behaviour at sea (reducing tilt) have been identified (see the next section).
In addition, analyses of the buoy tilt under actual current conditions at BOUSSOLE combined with records of currents at MSEA also showed that this concept is suitable for deployment on both sites. The same superstructure design would therefore be used at both sites, with the only
difference being the length of the mooring line cable, allowing HCMR to capitalize on more than fifteen years of experience in the use and optimization of this European OC-SVC infrastructure. This is an additional justification of reusing the BOUSSOLE concept.
Furthermore, a strategy to further improve the appropriateness of the current BOUSSOLE structure design has been created for ROSACE, so as to increase the capacity to deliver OC-SVC matchups.
3.5.2. Upgrade of the BOUSSOLE Buoy
The design of the BOUSSOLE buoy has undergone some preliminary modifications for ROSACE in order to optimize stability and reduce tilt. Such improvements will increase the percentage of observations for which the uncertainty meets the requirements for OC-SVC matchups. The structural variables to be modified to increase the buoy stability are:
1. The overall buoyancy, which is primarily determined by the volume of the main buoyancy sphere (about 95% of the total buoyancy).
2. The distance between the centre of buoyancy of the entire buoy and the connection point to the mooring cable.
3. The platform plus payload mass.
4. The distance between the centre of gravity (determined by the distribution of masses) and the connection point of the buoy to the mooring cable.
Figure 16. Three-dimensional model of the BOUSSOLE buoy.
Improving stability and decreasing tilt is obtained by increasing either (1) or (2) or both and by decreasing either (3) or (4) or both.
By design, the BOUSSOLE buoy tilt is highly correlated with oceanic currents [81,82], through:
)
v
(
tan
=
tilt
−1α
2 (1)where v is the current speed (m s-1), and α is a constant specific to the buoy design, its volumes and
masses.
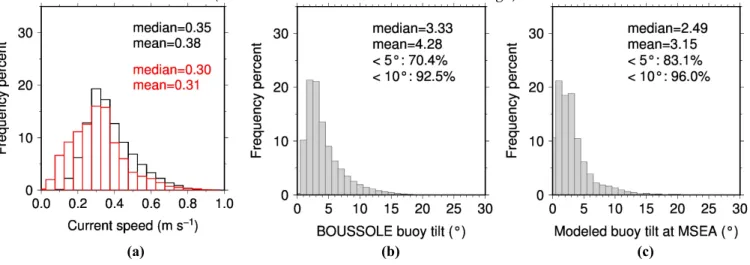
This equation has been used to derive surface currents from the entire record of the tilt at BOUSSOLE, because currents are not available there from direct measurements. This calculation showed that current speeds are similar at BOUSSOLE compared to MSEA, where they are directly measured (Figure 17a). This result supports the deployment of a BOUSSOLE-type buoy at MSEA.
Furthermore, using either the inferred (BOUSSOLE) or measured (MSEA) currents, we have calculated the tilt distribution that would be obtained on both sites with the improved design, i.e., where the distance between the centre of buoyancy and the connection point to the mooring cable is increased (which essentially ends up with the α constant in Equation (1) being lowered as compared to the current BOUSSOLE design). Results are displayed in Figure 17b, and show a modal buoy tilt of 2° and about 70% of data with a tilt < 5° at BOUSSOLE. The numbers for MSEA are even better with a modal value of 0.5° and 83% of data with a tilt < 5° (Figure 17c).
This exercise will be refined during a final design phase and confirmed through reduced-scale model tests in water tanks (as was done for the initial BOUSSOLE design).
(a) (b) (c)
Figure 17. Distribution of (a) the current speed at BOUSSOLE (modelled; black) and MSEA
(measured; red), the modelled buoy tilt at (b) BOUSSOLE, and (c) MSEA with the improved buoy design.
3.6. Matchup Potential of the Two Sites
Two complementary studies were performed with the aim of evaluating the matchup potential of both the BOUSSOLE and MSEA sites. By “matchup potential” we mean the potential number of collocations between a satellite overpass (here S3A) and a field measurement that both respect current criteria used for the determination of OC-SVC gains.
This potential was evaluated for the MSEA site for the first time here, and is somewhat known for BOUSSOLE, which is already used for the SVC of S3A&B/OLCI. We nevertheless included BOUSSOLE in this study because the improvements in the superstructure that we proposed for ROSACE have a great potential to improve the number of days where the field data are qualified for OC-SVC. The matchup potential of BOUSSOLE would be consequently increased as compared to its current status.
The first approach is similar to that of Zibordi and Mélin [24], except it used the S3A orbit characteristics and products, instead of SeaWiFS products. This approach gives a potential number of SVC-qualified matchups at both sites assuming that field data of the appropriate quality are available at the time of each of the selected satellite overpasses.
The second approach uses real field observations, i.e., eleven years of data collected at BOUSSOLE from 2007 to 2017, combined with typical overpass predictions of S3A. It allows analysing the impact on the number of matchups of various criteria related to the quality of the field data at both sites (such as the buoy tilt or the sun zenith angle, SZA).
3.6.1. Potential for OC-SVC Matchups: Satellite Approach
For this approach, all S3A overpasses for 2016, 2017 and 2019 were considered as potential matchups, regardless of the field measurement conditions (e.g., buoy tilt, wind). The year 2018 was not included due to technical issues delaying the access to S3A data. It should be noted that for the sake of comparison the MOBY site was also included in the exercise.
Satellite data might be used for OC-SVC when (see [3,4]): • The SZA is lower than 70°.
• There is no sun glint or saturation of the image.
• There is no cloud contamination in the image or whitecaps. • The viewing zenith angle (VZA) is lower than 56°.
Two additional criteria were also considered:
• Aerosol optical thickness (AOT) < 0.15 at 865 nm (low enough so that atmospheric correction has a chance to perform well).
• [TChl-a] concentration < 0.2 mg m-3 (meso- to oligo-trophic waters).
To estimate the most sensitive parameter at MSEA and at BOUSSOLE, these criteria were considered sequentially (e.g., one by one) and then globally when all were applied. The annual number of matchups satisfying the conditions was compared to the number of overpasses. To do that, the total number of matchups was divided by the number of months covered by this study (i.e., all months covered in 2016 + 2017 + 2019) and then multiplied by 12, to get an annual estimation. Results are summarized in Table 1. Note that the VZA criterion was not included because it did not eliminate any data.
Table 1. Impact of each selection criterion when taken individually, and when combined together
(last column) with the threshold values indicated in the text. The percentage reductions (rounded to integers) are calculated from the number of matchups after excluding the glint risk (so N = 123 for BOUSSOLE, 103 for MSEA and 81 for MOBY). GLO corresponds to the OC4ME algorithm and Med to the MedOC4ME algorithm.
N Overpass SZA Glint Cloud AOT [TChl-a] All Criteria
GLO Med GLO Med
BOUSSOLE N matchup 149 134 123 80 59 45 74 12 20 % reduction 10 17 46 60 70 50 92 87 MSEA N matchup 144 144 103 95 57 88 95 32 32 % reduction 0 28 34 60 39 34 78 78 MOBY N matchup 111 111 81 66 58 74 31 % reduction 0 27 40 48 33 72
Considering all OC-SVC requirements, adding MSEA to BOUSSOLE allows increasing the number of matchups by a factor of 3 as compared to a BOUSSOLE-only scenario. Therefore, 44 potential matchups per year might be expected when both sites are combined.
Both sites appeared to be strongly affected by the criterion on the AOT, which eliminated 60% of matchups on average for MSEA and BOUSSOLE. This was actually inconsistent with the field measurements of AOT at BOUSSOLE and MSEA, which showed average values at 865 nm generally < 0.1, with very few situations where it was >0.15. This clearly indicates an overestimation of AOT by OLCI. Therefore, the AOT criterion has to be considered with caution.
The second most influencing criterion was the total chlorophyll-a concentration. It was somewhat less critical for MSEA, with 39% of matchups eliminated compared to BOUSSOLE with 70%. This estimation was obtained with the global chlorophyll algorithm (OC4Me, [82]), however, which was known to significantly overestimate the chlorophyll concentration in the Mediterranean Sea, in particular for low-chlorophyll waters (e.g., [83]). Performing the same exercise using the MedOC4ME regional algorithm [84] greatly decreased the impact of the [TChl-a] criterion, ending up with only 50% of discarded matchups at BOUSSOLE and 34% at MSEA (i.e., comparable to MOBY where the percentage was 31%), for a total of 52 potential matchups for the whole infrastructure. These numbers were confirmed by the study using the BOUSSOLE field
measurement (see the subsequent section). The MSEA site was also clearly shown as the one where clear skies most often occurred.
3.6.2. Potential for OC-SVC Matchups: Field Data Approach
For this study, we used the actual 2017 S3A overpasses over BOUSSOLE and MSEA, and we matched these times with the field observations at BOUSSOLE for each and every one of the eleven years from 2007 to 2017. This means that for the MSEA site we assumed that a buoy would have been deployed there and would have provided the same in situ time series as BOUSSOLE, except for the [TChl-a] and buoy tilt. The total chlorophyll-a was replaced by the MODIS chlorophyll-a at MSEA for the period 2007–2017. The tilt was computed from the measured current speeds at MSEA using the tilt vs. current equation. The same method was applied for both the current and improved buoy designs. Performing the analysis in this way, we did not take into account the slight shift that occurs year after year in the overpass times, yet this was not critical inasmuch as we used 11 years of field observations, which allowed the calculation of a relevant average of how many field observations would qualify for a matchup.
The parameters that were considered to determine whether a matchup pair (overpass and field observation) is suitable for OC-SVC were the sun zenith angle at the time of the overpass, the satellite view angle, whether there is a glint risk, the buoy tilt, a clear sky index (corresponding to the cloud elimination with the satellite approach), the wind speed and the total chlorophyll-a concentration. The last four parameters were taken from the field measurement closest to the satellite overpass (maximum allowed time difference is 3 hours). Note that, by virtue of the buoy design, the wind speed and tilt criteria were somewhat redundant because the wind speed largely determines the surface currents at BOUSSOLE and MSEA. For BOUSSOLE, the clear-sky index was calculated as the absolute value of one minus the ratio of the measured above-water downward irradiance to its value modelled for a clear sky [85]. Therefore, values lower than, e.g., 0.1, mean that downward irradiance is within 10% of its theoretical clear sky value. For MSEA, this index was calculated using AERONET data and a radiative transfer model.
The following thresholds were used [3,4]: • No glint risk.
• SZA at the time of the satellite overpass < 70°. • VZA < 56°.
• Clear-sky index < 0.1 at BOUSSOLE and MSEA, as in [3]. • [TChl-a] < 0.2 mg m-3.
• Buoy tilt < 5°.
• Wind speed < 7.5 m s-1.
These thresholds are the ones currently used for OC-SVC or recommended here for selecting data with the lowest uncertainties. For both sites, we evaluated the matchup numbers using both the observed buoy tilt and the modelled buoy tilt that the proposed design adaptations would provide (see Section 3.5.2). Results are displayed in Figure 18 and in the following we only refer to results obtained with the modelled tilt for brevity.
With such a selection, the average number of matchups was 29 at BOUSSOLE and 42 at MSEA (Table 2). These numbers were obtained with the actual BOUSSOLE time series, during which the buoy collected data on average during 83% of the time (was 90%–100% in many years, and down to a minimum of 58% in 2008 when a ship collision occurred). If we assume a fully operational system working 100% of the time, the number of matchups increases to 36 at BOUSSOLE and 52 at MSEA.
Therefore, a conservative estimate of the matchup potential for the ROSACE infrastructure was of about 70 matchups every year and about 90 matchups for a fully operational infrastructure.
Figure 18. Potential number of valid system vicarious calibration (SVC) matchups at BOUSSOLE
and MSEA. The open symbols are for the current buoy design and tilt values. The dark symbols are for tilt values that would be observed with the improved buoy design. The larger symbols on the left side of each panel show the average values for each time series.
Table 2. Statistics of matchups reduction following quality criteria. Elimination Criteria
Colloc ation
Satellite
Measurements Field Measurements All
Glint SZA Clear-sky [TChl-a] Buoy Tilt Wind Speed 83% rate 100% rate
BOUSSOLE
N matchups 175 133 120 55 88 89 96 29 36 % reduction 24 10 58 34 34 28 78 73 MSEA N matchups 168 115 115 52 109 98 84 42 52 % reduction 30 0 54 6 14 28 63 55Table 2 shows the impact of each criterion when taken individually. Accounting for the "glint risk" eliminated about 24% of all satellite overpasses at BOUSSOLE, and 32% at MSEA. This difference is a direct effect of MSEA being at a lower latitude, making it slightly more prone to sun glint than BOUSSOLE. This criterion determines a fixed starting point in terms of the number of potentially usable matchups, before other criteria are taken into account.
Table 2 also shows that the observation and sun geometries were not critical. All matchups at MSEA were below the thresholds for the SZA and VZA at the time of the satellite overpass. Only 10% of matchups were eliminated at BOUSSOLE for the SZA being larger than 70° and none at MSEA.
The parameter with the strongest impact on the number of matchups was the clear-sky index. Note, however, that it was set to a rather low value here so the estimate is conservative. The
[TChl-a], wind speed and tilt criteria had roughly the same impact at BOUSSOLE. For MSEA, [TChl-a]
was not a significant criterion at that site as it was low throughout the year. The analysis was not repeated for Sentinel-3B because similar, actually probably identical, numbers can be anticipated inasmuch as the orbit characteristics are globally the same as those for S3A.
It should be remembered that this exercise uses thresholds on various parameters for the selection of in situ data. This is not what is eventually recommended for the future Copernicus OC-SVC infrastructure, where the selection should be driven by the uncertainty associated with each measurement. It is foreseeable that data not included here, on the sole basis of how they compare to thresholds on selected parameters, could actually be selected if their uncertainty was accounted for (i.e., because it was revealed to be low). The rather stringent criteria (thresholds) we have used here

![Figure 8. (a) Average seasonal cycles of the cloud fraction (moderate resolution imaging spectroradiometer (MODIS) product [33], average from 2012 to 2015) for the four sites indicated](https://thumb-eu.123doks.com/thumbv2/123doknet/14797056.604322/11.892.117.777.243.429/figure-average-seasonal-fraction-moderate-resolution-spectroradiometer-indicated.webp)