HAL Id: hal-00316418
https://hal.archives-ouvertes.fr/hal-00316418
Submitted on 1 Jan 1998
HAL is a multi-disciplinary open access
archive for the deposit and dissemination of sci-entific research documents, whether they are pub-lished or not. The documents may come from teaching and research institutions in France or abroad, or from public or private research centers.
L’archive ouverte pluridisciplinaire HAL, est destinée au dépôt et à la diffusion de documents scientifiques de niveau recherche, publiés ou non, émanant des établissements d’enseignement et de recherche français ou étrangers, des laboratoires publics ou privés.
Analysis of the effect of the coastal discontinuity on
near-surface flow
S. C. Pryor, R. J. Barthelmie
To cite this version:
S. C. Pryor, R. J. Barthelmie. Analysis of the effect of the coastal discontinuity on near-surface flow. Annales Geophysicae, European Geosciences Union, 1998, 16 (7), pp.882-888. �hal-00316418�
Analysis of the eect of the coastal discontinuity
on near-surface ¯ow
S. C. Pryor1, R. J. Barthelmie1; 2
1Climate and Meteorology Program, Department of Geography, Indiana University, Bloomington, IN 47405, USA Fax: +1 812 855 1661; e-mail: [email protected]
2Department of Wind Energy and Atmospheric Physics, Risù National Laboratory, Roskilde, Denmark Received: 23 May 1997 / Revised; 28 November 1997 / Accepted: 5 December 1997
Abstract. Conditional sampling is used herein to exam-ine the eect of fetch, stability, and surface roughness changes on wind speeds in the coastal zone. Using data from an oshore wind farm it is shown that at a distance of 1.2±1.7 km from the coast, up to a height of 20 m above the surface, dierences in wind speed distribu-tions from onshore and oshore masts are statistically signi®cant for ¯ow moving oshore under all stability conditions. In contrast, dierences between the distri-bution of wind speeds at 38 and 48 m at masts located at the coast and in the coastal zone are not signi®cant for ¯ow moving oshore, indicating that ¯ow at these heights is not fully adjusted to the change in surface roughness (land to sea). These ®ndings are in accor-dance with calculations of the internal boundary layer (IBL) height which indicate that the IBL would frequently be below the two upper measurement heights at 1.2±1.6 km from the coast. The analyses presented here indicate that the wind speed distribution at a potential oshore wind farm site is not solely dependent on fetch (distance from the coast) but also depends on the stability climate.
Key words. Meteorology and atmospheric dynamics á Mesoscale meteorology á Ocean-atmosphere
interaction á Marine meteorology
1 Introduction and objectives
Modi®cation of ¯ow in the coastal zone occurs as a result of stability and roughness changes, and has implications for applications such as oshore wind energy production and atmospheric dispersion and
deposition in coastal regions. Because of the relative lack of in situ measurements in the coastal zone, measurements from nearby land sites are often extrap-olated to produce estimates for oshore sites (Hsu, 1988); however, ¯ow at dierent heights moving o-shore is dierentially in¯uenced by roughness and stability changes introduced by the surface discontinuity (Barthelmie et al., 1996), and assumptions regarding conditions over sea (e.g., near-neutral stability) may be frequently violated.
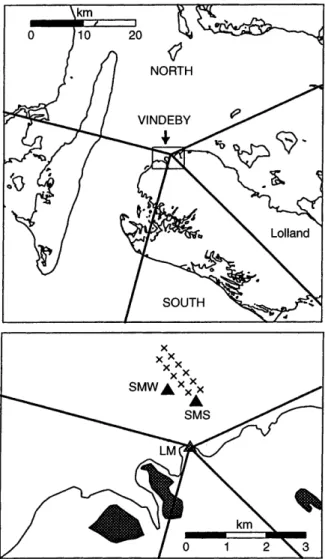
Data used herein were collected at an oshore wind farm located at Vindeby, Denmark, on three masts shown in Fig. 1; one located at the coast (LM) and two located at minimum distances from the coast of 1270 and 1630 m (SMS and SMW, respectively). As shown in Fig. 1, the wind farm, which is located in a relatively enclosed sea north of the island of Lolland, comprises 11 turbines arranged in two parallel rows oriented north-west-southeast. As described in Barthelmie et al. (1997), the sea masts are placed in such a way that they take the position of an additional turbine located to the south (SMS) and west of the turbines (SMW) at a distance of 300 m from the closest turbine. Each meteorological mast is equipped with a minimum of four cup anemom-eters (at 7, 20, 38 and 48 m), and two wind vanes. Additional instrumentation is comprehensive and in-cludes thermistors, sonic anemometers, pressure, hu-midity and wave height sensors (Barthelmie et al., 1994). Data presented herein are half-hourly averages from January to December 1994.
The objectives of this paper are to use conditional sampling of observed data from the Vindeby project in order:
1. To elucidate relationships between dierences in wind speeds measured on- and oshore and ¯ow direction (onshore or oshore), fetch (distance from the coastal discontinuity), stability (classes de®ned using the Monin-Obukhov length), and surface roughness changes (z0 over land and z0 over sea). Data from
Vindeby indicate that on average wind speeds at the sea masts are 5% higher than those at the land mast.
Herein, we examine whether higher wind speeds over sea are consistent across the entire wind speed distributions (over land and sea), evident at all measurement heights (up to 48 m above the surface), and dependent on stability and fetch conditions. 2. To examine whether oshore ¯ow at a distance of
1.2±1.7 km from the coast and a height of up to 48 m from the surface is fully adjusted subsequent to the coastal discontinuity. Speci®cally to examine whether the upper measurement heights are frequently within the internal boundary layer (IBL) generated by the surface discontinuity as ¯ow moves oshore. This analysis has direct implications for siting of wind farms in the coastal zone to maximize power output. 2 Data analyses
2.1 Meteorological data
Herein, wind speed data are conditionally sampled by wind direction sector and stability. Two wind direction
sectors are used: a north sector from 285° to 65° (¯ow directly over sea to all three masts) and a south sector from 135° to 195° [¯ow is over at least 10 km of land prior to observation at LM and then has a sea fetch of between 1 and 2 km before reaching the sea masts (SMS and SMW)]. These two wind direction sectors are shown in Fig. 1. Stability is characterized using the Monin-Obukhov length, L, determined using parameterizations given in Beljaars et al. (1989) and applied in Van Wijk et al. (1990).
Monin-Obukhov lengths at LM were calculated using wind speed at a height of 20 m, temperature dierence DT(16±8 m) and absolute temperature at 8 m. Monin-Obukhov lengths at the sea masts were calculat-ed using wind specalculat-ed at a height of 20 m, DT(21±8 m) and absolute temperature at 8 m. Using the parameterization of Beljaars et al. (1989), the sign of the Monin-Obukhov length is determined by the temperature pro®le. The magnitude is determined by an iterative process where an initial value is estimated assuming that the wind speed pro®le is close to neutral and determining the friction velocity based on wind speed and roughness length [assigned for land (Barthelmie et al., 1994) and calculated for sea according to the Charnock equation (Charnock, 1955)]. The value of the Monin-Obukhov length is proportional to the cube of the friction velocity. Hence, in this case, the nominal height to which the Monin-Obukhov length is assigned is the height of the wind speed measurement. Stability classes used herein are de®ned on the basis of Van Wijk et al. (1990) where |L| >1000 m indicates near-neutral con-ditions, )1000 < L < 0 m indicates unstable condi-tions, and 1000 > L > 0 m indicates stable conditions. 2.2 Conditional sampling of wind speed data
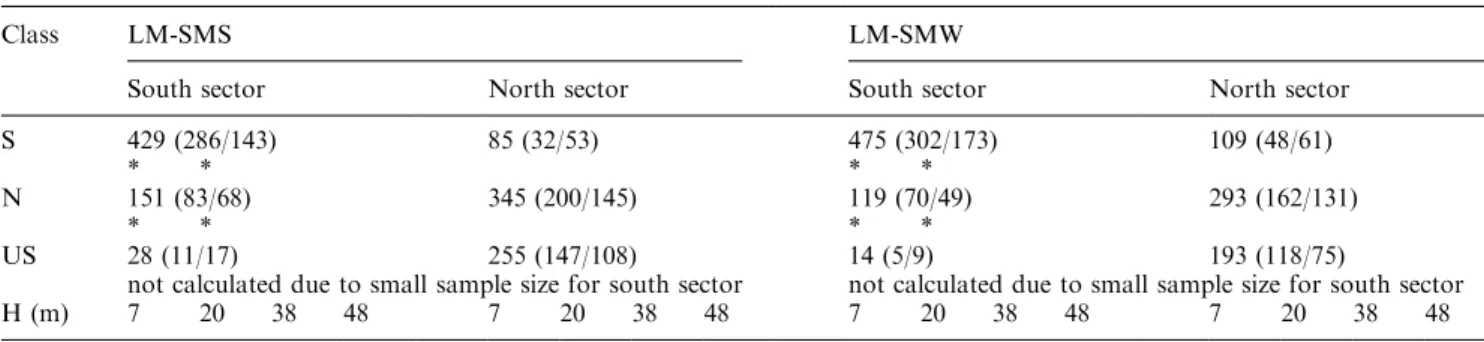
Using conditional sampling, wind speed data at each measurement height (7, 20, 38, and 48 m) were selected by directional sector (north or south as de®ned by wind direction at 20 m at LM) and stability class for all cases when stability conditions at the two masts (LM and SMS or LM and SMW) were in the same class (i.e., stable, near-neutral, or unstable as de®ned by L). Wind speed data from all three masts and L and wind direction from LM are concurrently available for 8309 time-periods. As shown in Table 1, the data selection criteria reduce the number of observations available for analysis particularly for the unstable case with ¯ow from the south sector.
Figure 2 shows wind speed distributions from SMS and LM by stability class and wind direction sector at 7 m. In accordance with a priori knowledge, with ¯ow from the north sector wind speed distributions at all masts and all heights show similar behavior regardless of stability class. However, an exception is at 7 m in the near-neutral class when wind speeds are slightly higher at the sea masts (Fig. 2). The dierence between wind speeds at the oshore mast and LM (lower wind speeds at LM) for near-neutral conditions with a north fetch are most pronounced at higher wind speeds and may re¯ect:
Fig. 1. Map of the Vindeby monitoring location. The crosses indicate the location of wind turbines. The measurement masts are indicated by the solid triangles and the identi®ers: LM = land mast, SMS = sea mast south, SMW = sea mast west
distributions by stability class (S = stable, N = near-neutral, US = unstable) and wind direction [NORTH = ¯ow over sea to all masts (wind direction: 285°±65°), SOUTH = ¯ow over land to LM and then over sea to SMS and SMW (wind direction: 135°± 195°)]. The ®rst row for each stability class shows the total number of observations in that stability class by directional sector (e.g., there are 151 observations with near-neutral stability at both SMS and LM with ¯ow from the south sector). The second row indicates the results of Kolmogorov-Smirnov test for the equality of
mast (LM) and the respective sea mast (SMS or SMW) (e.g., the wind speed observations with near-neutral stability and ¯ow from the south sector exhibit dierent distributions at the LM and SMS at the 99.9% con®dence level). H (m) indicates the height of the measurements above the surface. The numbers in parentheses after the total counts indicate the number of observations in each stability - direction category from the nighttime hours / (de®ned as 7:01 p.m. ± 7:00 a.m.) / the number of observations in each category from the daytime hours (de®ned as 7:01 a.m ± 7:00 p.m.)
Class LM-SMS LM-SMW
South sector North sector South sector North sector
S 429 (286/143) 85 (32/53) 475 (302/173) 109 (48/61)
* * * *
N 151 (83/68) 345 (200/145) 119 (70/49) 293 (162/131)
* * * *
US 28 (11/17) 255 (147/108) 14 (5/9) 193 (118/75)
not calculated due to small sample size for south sector not calculated due to small sample size for south sector
H (m) 7 20 38 48 7 20 38 48 7 20 38 48 7 20 38 48
(* = signi®cant at the 99.9% con®dence level)
Fig. 2. Wind speed distributions (m/s) at 7 m height from LM and SMS by directional sector (wind direction) and stability class. Because of the low number of observations in the unstable class the entire distribution may not be characterized, and so the data for the 30th, 50th, and 70th percentiles are shown in the box (note: Perc. = percentile)
1. propagation of the eect of the surface discontinuity upwind of the island,
2. the eect of displacement of the mast from the coastal discontinuity (LM is 16 m from the coast),
3. the eect of enhanced surface roughness at the coast due to the growth of reeds in summer (which would lead to higher momentum ¯ux to the surface).
The distribution of wind speeds from the sea masts may incorporate the in¯uence of wake and obstacle eects when the masts are in the lee of the wind turbines. Wake eects are de®ned here as deceleration in wind speed and increase in turbulence in the ¯ow downwind of an operating wind turbine. To investigate the potential role of wake eects in inducing dierence in the wind speed distributions measured at the sea and land masts
for ¯ow from the north sector, 5° directional sectors associated with a primary wake eect (i.e., a turbine directly upstream of the mast at a distance of 300±500 m from the mast) were omitted from the data set and the wind speed distribution was recalculated for each mea-surement height at SMS and SMW. An example of the results of this reanalysis compared to the wind distribu-tion characterized with the full data set is shown in Table 2 for SMS at the 7 m measurement height. The data contained in this table indicate that wake eects are associated with a decrease in wind speeds in near-neutral conditions of up to 5% relative to the sector 30th, 50th, and 70th percentile wind speed values, and at higher wind speeds under unstable and stable conditions. Similar results were found for the other measurement heights and for data from SMW. However, wake eects
Table 2. Investigation of wake eects. Variations in wind speed at SMS at 7 m measurement height for the north sector (285°±65°) using all observations and excluding wind directions subject to wake eects based on the wind farm orientation (excluded sectors: 20°±
25°, and 315°±325°). Note: The data contained in this table dier from those in Table 1 because here the wind direction is de®ned based on observations at SMS
Unstable Near-neutral Stable
North North excl. North North excl. North North excl.
wake directions wake directions wake directions
# of obs 143 111 333 293 77 72
30 th percentile 2.99 3.04 6.94 7.18 2.63 2.64
50 th percentile 3.46 3.50 9.11 9.32 4.22 4.28
70 th percentile 4.08 4.24 10.73 11.25 5.02 5.07
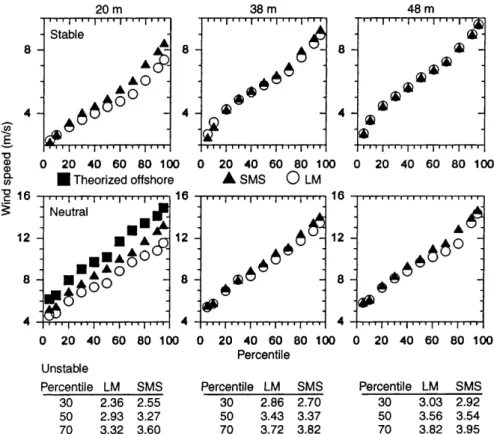
Fig. 3. Wind speed distributions (m/s) at 20, 38, and 48 m height from LM and SMS by s tability class for ¯ow from the south sector. Also shown is a wind speed distri-bution at 20 m for near-neutral conditions derived theoretically, using the methodology described in the text. Because of the low number of observations in the unstable class the entire distribution may not be charac-terized and so the data for the 30th, 50th, and 70th percentiles are shown in the box (note: Perc. = percentile)
north sector wind speeds at the sea masts and LM because of the relatively low number of observations in sectors associated with direct turbine wakes.
Figure 3 shows wind speed distributions from LM and SMS at 20, 38, and 48 m for ¯ow from the south sector only. For oshore ¯ow under near-neutral and stable conditions, higher winds are observed at SMS at 7 m (Fig. 2) and 20 m over the entire wind speed distribution. This is consistent with observations that sea surface roughness is between two and three orders of magnitude lower than that of a typical land surface. Frictional dissipation of momentum at the sea surface is signif-icantly lower, hence in the absence of horizontal stability gradients near-surface ¯ow accelerates in response to the change in roughness when ¯ow moves oshore. The absolute magnitude of the dierences in wind speed distributions are smaller in stable conditions because wind speeds are lower and thermal strati®cation inhibits momentum transfer from aloft and thus reduces the vertical propagation of the eects of reduced frictional dissipation of momentum over sea. Detailed interpretat-ion of unstable cases with ¯ow from the south sector is not possible due to the low number of observations; though the data also show evidence of higher wind speeds at SMS than LM under these conditions. At 38 and 48 m the upper quartile of the wind speed distributions under near-neutral and stable conditions show some evidence of higher wind speeds over sea. However, the dierences are small, suggesting that at this distance from the coast wind speeds at these heights are not fully adjusted to the change in surface roughness.
2.3 Quantitative analyses of the wind speed distributions In order to examine the dierences in wind speed distributions at the on- and oshore masts by stability class and wind direction which are described qualita-tively in the preceding text, three statistical techniques are employed: a Wilcoxon matched-pairs signed ranks test, the Kolmogorov-Smirnov equality of distributions test, and quantile-quantile plots. The Wilcoxon matched-pairs signed ranks test (Kennedy and Neville, 1986) is used to test the equality of matched pairs of observations (in this case the wind speed of observations from the LM and SMS and SMW conditionally sampled by sector and stability) using the following methodol-ogy. The dierence score for each matched pair (coincident wind speed observations) is calculated for the data set and then ranked (from largest dierence to smallest dierence) regardless of sign. The rank scores for all positive values are summed and compared to the summed rank scores for the negative dierences. If the two series (wind speed data sets) are drawn from the same population then each matched pair has the same probability of being positive or negative, if not the value of the actual rank score dierences can be used to determine the con®dence with which one can assert that the data sets are dierent. The Kolmogorov-Smirnov equality of distributions test (Kennedy and Neville,
wind speed distributions at each measurement height sampled by stability class and fetch is statistically dierent at the land and sea masts. The Kolmogorov-Smirnov equality of distributions test is used to evaluate whether two distributions drawn from continuous (not categorical) data series dier and at what signi®cance level. The two cumulative frequency distributions are compared by assuming that one conforms to an idealized distribution and then evaluating whether the other distribution shows similar (identical) form. Em-pirical quantile-quantile plots (Karl, 1978) are used herein to examine the dierences in wind speed distri-butions from the two sea masts. In quantile-quantile plots, the data value for a given quantile are plotted against the data value for the same quantile from another data set. If the distributions are identical then the plotted data will form a straight line of slope equal to 1 and intercepting zero. These plots permit compar-ison of wind speeds across the entire distributions and their use does not require any assumptions about the form of the underlying data distribution.
In accordance with qualitative assessment of Figs. 2 and 3, a Wilcoxon matched-pairs signed ranks test applied to compare the magnitude of observations from the LM and SMS and SMW conditionally sampled by wind direction and stability, indicates that wind speeds are signi®cantly and consistently higher at the sea masts when the ¯ow is from the south sector, but are not consistently higher with ¯ow from the north sector except at 7 m height. The Kolmogorov-Smirnov equality of distributions test (Kennedy and Neville, 1986) was then used to examine whether the form of the wind speed distributions at each measurement height sampled by stability class and fetch are statistically dierent at the land and sea masts. The results are shown in Table 1 and indicate that at 7 and 20 m height the form of the distributions from the LM are statistically dierent from those at SMS and SMW, but not at 38 and 48 m. Note, in the unstable case, due to the small number of observations, only the equality of median values was tested and was found to indicate signi®cant dierences at the two lower measurement heights (7 and 20 m). The change in the form of the distributions (as indicated by the Kolmogorov-Smirnov test) indicates a nonlinear response to the surface forcing which is ampli®ed at high wind speeds.
For applications such as oshore wind energy it is important to assess at what distance from the coast will ¯ow moving oshore be fully adjusted to the reduced surface friction and hence attain maximum wind speeds subsequent to passing over the coastal discontinuity. To examine whether ¯ow has attained equilibrium subse-quent to the surface discontinuity at the oshore masts at the Vindeby wind farm, theoretical wind speeds over sea at 20 m height were derived using the following meth-odology. Theoretical wind speeds are derived for a land surface through iterative solution of the geostrophic drag law (Garratt, 1992) and the logarithmic wind speed pro®le with a roughness length of 0.05 m [appropriate for Vindeby (Barthelmie et al., 1997)]. Over sea, the same
procedure is used except that roughness is calculated using the Charnock equation (Charnock, 1955). Thus, the theoretically derived oshore wind speeds shown in Fig. 3 were calculated from the wind speed over land using the assumptions that the geostrophic wind speed has the same value in both cases, of near-neutral stability, and that ¯ow is at equilibrium with the respective surfaces (land or sea) (Barthelmie, 1998). These values can therefore be considered theoretical maximal increases in wind speed moving oshore due to surface roughness change alone. According to this logic, comparison of the observed wind speed at SMS and theorized wind speeds indicate that even at 1270 m from the coastal discontinuity the ¯ow is not fully adjusted to the surface roughness change at 20 m height (Fig. 3).
For a number of applications it is also important to consider vertical propagation within the atmosphere of changes caused by a discontinuity in surface character-istics. Internal boundary layers are a theoretical tool used to describe the depth of the adjusted ¯ow layer subse-quent to passing over a discontinuity (Bergstrom et al., 1988). The height of the internal boundary layer (IBL) is assumed to increase as a function of roughness and stability conditions downwind of the discontinuity and to indicate the height at which the ¯ow is at equilibrium with the `new' surface conditions. From Fig. 3 and Table 1 it appears that wind speed distributions with ¯ow from the south sector at 48 m and to a lesser extent at 38 m are unaected by the lower surface roughness over sea, which implies that at these distances from the coast the ¯ow at these heights is not fully adjusted to the `new' surface, and hence that the IBL height is frequently lower than 48 m. This hypothesis was tested by calculating the IBL height for each data record according to the Monin-Obukhov length over sea [based on Bergstrom et al. (1988)], where h = 0.2x(0.78)0.33z/L), x = fetch, z = height at which L is
de®ned (20 m). The results of these calculations indicate a median IBL height of 48 and 57 m for SMS and SMW, respectively, indicating that on average the 48-m level would be above or near to the IBL height and hence only weakly aected by the reduction in surface roughness over sea. Further support for this hypothesis is obtained from analysis presented in Fig. 4, which shows empirical quantile-quantile plots for SMS and SMW at 38 and 48 m under near-neutral conditions for ¯ow from the south sector. These plots indicate that across the entire distri-bution of wind speeds, wind speed values associated with speci®c quantiles are slightly lower at SMS than at SMW.
This is in accordance with the observation that SMW is located further from the coast and that the IBL height should be higher at this location.
3 Discussion and conclusions
Conditional sampling of data collected at Vindeby in Denmark was used to examine the relationships between wind speed distributions at multiple heights at on- and oshore locations. Wind speed distributions from oshore masts located over 1 km from the coast indicate that whilst near-surface ¯ow is at least partially adjusted to the change in surface roughness (land-sea) over this distance from the coast, on average, the ¯ow is not at equilibrium with the sea surface. Flow at 38 and 48 m above the surface exhibits little evidence of acceleration due to decreased roughness as the ¯ow moves oshore regardless of stability conditions. This is in accordance with calculations of the IBL height (based on Monin-Obukhov length) which show that the IBL is frequently below the height of observation.
As shown in Table 1 there is a dierence between the daytime and nighttime frequency of ¯ow from dierent wind direction sectors and stability classes. It has been
Fig. 4. Empirical quantile-quantile plots from wind speeds (m/s) at SMS and SMW at 38 and 48 m under near-neutral conditions with ¯ow from the south sector
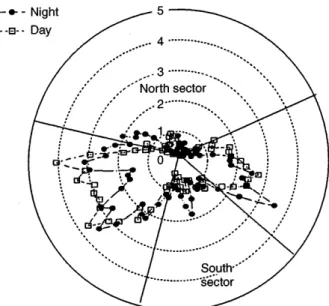
Fig. 5. The relative frequency (expressed in percent) of ¯ow from 5° sectors at LM for the night hours (de®ned as 7:01 p.m.±7:00 a.m.) and the daytime hours (de®ned as 7:01 a.m.±7:00 p.m.)
mesoscale circulation (speci®cally a seabreeze-land-breeze circulation). However, wind-roses generated for ¯ow in 5° sectors for the daytime (de®ned as 7:01 a.m.±7:00 p.m.) and nighttime (de®ned as 7:01 p.m. ±7:00 a.m.) hours do not appear to indicate a dominant seabreeze-landbreeze circulation generated by the island of Lolland. With regard to the north and south sectors used herein, as shown in Fig. 5, the wind-roses indicate relatively similar wind directions in the day- and nighttime hours. The implication is that the diurnal dierences evident in Table 1 and related analyses are due to diurnal variability of stability and that the diurnal bias is due to the criteria that onshore and oshore stability are in the same class (stable, near-neutral, or unstable as de®ned by the Monin-Obukhov length). Hence, although thermally generated eects are clearly impacting the analyses presented here, it appears to be due primarily to stability eects and not a thermally driven mesoscale circulation.
The analyses presented here indicate that the wind speed distribution in the coastal zone is not solely dependent on fetch (distance from the coast) but also depends on the stability climate. Future work will focus on quantifying the roles of roughness and stability changes on momentum transfer in the coastal zone and the spatial and temporal scales of ¯ow adjustment.
Acknowledgements. We are grateful to our colleagues at Risù National Laboratory who collected the data presented herein, and to Dr. Branko Grisogono for his helpful comments and sugges-tions. This paper was conceived whilst the ®rst author was on leave at Risù National Laboratory on a Presidents Award from Indiana University, and was substantially improved by the comments of two anonymous reviewers.
Topical Editor G.-P. Duvel thanks H. Bergstrom and another referee for their help in evaluating this paper.
Barthelmie, R. J., The eects of atmospheric stability on coastal wind climates, Meteorol. Appl., in press, 1998.
Barthelmie, R. J., M. S. Courtney, J. Hùjstrup, and P. Sanderho, The Vindeby Project: a description, Risù-R-741(EN), Risù National Laboratory, Denmark, 1994.
Barthelmie, R. J., B. Grisogono, and S.C. Pryor, Observations and simulations of diurnal cycles of near-surface wind speeds over land and sea. J. Geophys. Res., 101, 21 327±21 337, 1996. Barthelmie, R. J., M. S. Courtney, J. Hùjstrup, and S. E. Larsen,
Meteorological aspects of o-shore wind energyÐobservations from the Vindeby wind farm. J. Wind Eng. Ind. Aerodyn., 62, 191±211, 1997.
Beljaars, A. C. M., A. A. M. Holtslag, and R. M. van Westrhenen, Description of a software library for the calculation of surface ¯uxes. Tech. Rep. TR-112, KNMI, De Bilt, Netherlands, 1989. Bergstrom, H., P. -E. Johansson, and A. -S. Smedman, A study of wind speed modi®cation and internal boundary-layer heights in a coastal region. Boundary-Layer Meteorol., 42, 313±335, 1988. Charnock, H., Wind stress on a water surface. Q. J. R. Meteorol.
Soc., 81, 639, 1955.
Garratt, J. R., The atmospheric boundary layer, Cambridge atmospheric and space science series, Cambridge University Press, Cambridge, 1992.
Hsu, S. A., Coastal meteorology, Academic Press, San Diego, 1988. Karl, T. R., Day-of-the-week variations of photochemical pollu-tants in the St. Louis area, Atmos. Environ. 12, 1657±1667, 1978. Kennedy, J. B., and A. M. Neville, Basic statistical methods for
engineers and scientists, Harper and Row, New York, 1986. Van Wijk, A. J. M., A. C. M. Beljaars, A. A. M. Holtslag, and
W. C. Turkenburg, Evaluation of stability corrections in wind speed pro®les over the North Sea. J. Wind Eng. Ind. Aerodyn., 33, 551±566, 1990.