HAL Id: hal-00303997
https://hal.archives-ouvertes.fr/hal-00303997
Submitted on 28 Feb 2008HAL is a multi-disciplinary open access
archive for the deposit and dissemination of sci-entific research documents, whether they are pub-lished or not. The documents may come from teaching and research institutions in France or abroad, or from public or private research centers.
L’archive ouverte pluridisciplinaire HAL, est destinée au dépôt et à la diffusion de documents scientifiques de niveau recherche, publiés ou non, émanant des établissements d’enseignement et de recherche français ou étrangers, des laboratoires publics ou privés.
Reconstruction of the solar spectral UV irradiance for
nowcasting of the middle atmosphere state on the basis
of LYRA measurements
T. Egorova, E. Rozanov, Jean-François Hochedez, W. Schmutz
To cite this version:
T. Egorova, E. Rozanov, Jean-François Hochedez, W. Schmutz. Reconstruction of the solar spectral UV irradiance for nowcasting of the middle atmosphere state on the basis of LYRA measurements. Atmospheric Chemistry and Physics Discussions, European Geosciences Union, 2008, 8 (1), pp.4099-4116. �hal-00303997�
ACPD
8, 4099–4116, 2008Reconstruction of the solar UV irradiance
from LYRA data T. Egorova et al. Title Page Abstract Introduction Conclusions References Tables Figures ◭ ◮ ◭ ◮ Back Close Full Screen / Esc
Printer-friendly Version Interactive Discussion
Atmos. Chem. Phys. Discuss., 8, 4099–4116, 2008 www.atmos-chem-phys-discuss.net/8/4099/2008/ © Author(s) 2008. This work is distributed under the Creative Commons Attribution 3.0 License.
Atmospheric Chemistry and Physics Discussions
Reconstruction of the solar spectral UV
irradiance for nowcasting of the middle
atmosphere state on the basis of LYRA
measurements
T. Egorova1, E. Rozanov1,2, J.-F. Hochedez3, and W. Schmutz1
1
Physikalisch-Meteorologisches Observatorium Davos and World Radiation Center, Dorfstrasse 33, 7260 Davos Dorf, Switzerland
2
Institute for Atmospheric and Climate Science, ETH Z ¨urich, Universit ¨atsstr. 16, 8092 Z ¨urich, Switzerland
3
Royal Observatory of Belgium, Circular Avenue 3, 1180 Brussels, Belgium
Received: 3 January 2008 – Accepted: 9 January 2008 – Published: 28 February 2008 Correspondence to: E. Rozanov (e.rozanov@pmodwrc.ch)
ACPD
8, 4099–4116, 2008Reconstruction of the solar UV irradiance
from LYRA data T. Egorova et al. Title Page Abstract Introduction Conclusions References Tables Figures ◭ ◮ ◭ ◮ Back Close Full Screen / Esc
Printer-friendly Version Interactive Discussion
Abstract
The LYRA instrument onboard ESA PROBA2 satellite will provide 6-hourly solar ir-radiance at the Lyman-alpha (121.6 nm) and the Herzberg continuum (∼200–220 nm wavelength range). Because the nowcasting of the neutral and ionic state of the middle atmosphere requires the solar irradiance for the wide spectral area (120–680 nm) we
5
have developed the statistical tool for the reconstruction of the full spectrum from the LYRA measurements. The accuracy of the reconstructed irradiance has been evalu-ated with 1-D transient radiative-convective model with neutral and ion chemistry using the daily solar spectral irradiance measured with SUSIM and SOLSTICE instruments onboard UARS satellite. We compared the results of transient 1-yr long model
simula-10
tions for 2000 driven by the observed and reconstructed solar irradiance and showed that the reconstruction of the full spectrum using linear regression equation based on the solar irradiance in two LYRA channels can be successfully used for nowcasting of the middle atmosphere. We have also defined some conditions when the proposed approach does not provide reasonable accuracy.
15
1 Introduction
The nowcasting and short-term forecasting of the space weather driven by the differ-ent observational data gained recdiffer-ently a lot of attdiffer-ention, because the Solar activity variations are able to induce substantial changes in the Earth environment, which turn out to be important for the space operations (Wilkinson, 1994), radio-wave
propaga-20
tion, GPS functioning and many other aspects of the mankind activity (Jansen et al., 2000). Among other elements of the space weather it is of interest to understand and predict the response of the neutral and charged species in the middle atmosphere to the variability of the Sun activity. An important aspect of this issue is an evaluation and prediction of the response of the middle atmosphere to the solar ultraviolet
irra-25
ACPD
8, 4099–4116, 2008Reconstruction of the solar UV irradiance
from LYRA data T. Egorova et al. Title Page Abstract Introduction Conclusions References Tables Figures ◭ ◮ ◭ ◮ Back Close Full Screen / Esc
Printer-friendly Version Interactive Discussion
middle atmosphere via the perturbation of the photolysis, photoionization and heating rates (Brasseur and Solomon, 2005). On the other hand the response of the middle atmosphere to the solar variability can be modulated by complicated non-linear dy-namics, advective and turbulent transport of heat and species. Therefore, nowcasting of the middle atmosphere state requires application of appropriate models and detailed
5
knowledge of the solar spectral irradiance in real time.
High quality solar UV irradiance observation data are available from a variety of the past (Floyd et al., 1998; Rottman et al., 1993) and ongoing (Rottman et al., 2006) satellite experiments. The solar irradiance measurements by the SORCE experiment (http://earthobservatory.nasa.gov/Library/SORCE) being available in real-time could
10
provide a solid basis for the nowcasting of the neutral and ion composition of the stratosphere and mesosphere. More near real-time solar irradiance data will be avail-able in the future. The LYRA instrument onboard PROBA-2 satellite will provide the solar irradiance for several wavelengths important for the middle atmosphere in real time (Hochedez et al., 2006). LYRA will specifically monitor the solar irradiation in four
15
wavelength bands that are essential for the Sun-Earth connection: Lyman-alpha (115– 125 nm), Herzberg (200–220 nm), Zirconium (1–20 nm) and Aluminium (17–70 nm) in-cluding He II at 30.4 nm. It will be the first space assessment of the pioneering UV detectors from the BOLD program (http://bold.oma.be). Its concepts take advantage of wide-band-gap materials instead of silicon. Another instrument PREMOS on the
20
French satellite PICARD will monitor the solar irradiance in two UV channels at 270 nm and in the Herzberg band, and in one visual channel at 535 nm and one near IR chan-nel at 782 nm. The LYRA and PREMOS observations can be used as input data for global climate-chemistry-ionosphere models in order to evaluate the response of the terrestrial atmosphere to the solar UV irradiance variability. These results are
indis-25
pensable for space whether and global climate applications.
However, while it is necessary to have full solar spectrum to drive a nowcasting, the observational data by LYRA and PREMOS cover only several spectral intervals. Therefore, to apply LYRA and PREMOS data it is necessary to reconstruct the solar
ACPD
8, 4099–4116, 2008Reconstruction of the solar UV irradiance
from LYRA data T. Egorova et al. Title Page Abstract Introduction Conclusions References Tables Figures ◭ ◮ ◭ ◮ Back Close Full Screen / Esc
Printer-friendly Version Interactive Discussion
UV spectrum. The attempts to reconstruct solar irradiance have been made by several groups (e.g. by Krivova et al. 2006; Dudok de Wit et al., 2005) on the basis of statistical approaches. Krivova et al. (2006) applied for the solar UV irradiance reconstruction an empirical model assuming all irradiance variations are due to the evolution of the solar surface magnetic features and showed that this approach performs well for the
wave-5
lengths longer than ∼220 nm. For the shorter wavelengths Krivova et al. (2006) used regression equations based on the correlation with the solar UV irradiance at 220– 240 nm. Dudok de Wit et al. (2005) used statistical approach based on the singular value decomposition analysis and showed that all spectral lines can be conveniently represented on a 2-D map according to the similarities in their temporal evolution. They
10
showed that a subset of 5 to 8 of these lines is sufficient for reconstructing the spec-trum with a relative error below 0.25%. These efforts suggested that the full specspec-trum could be successfully retrieved from the limited number of spectral channels.
The main goal of the paper is to show that the solar UV irradiance can be recon-structed from the LYRA measurements using regression analysis with reasonable
ac-15
curacy. Because LYRA is not yet operational we use UARS SUSIM and SOLSTICE daily solar UV irradiance for the year 2000. From these data it is possible to calculate the solar irradiance for the LYRA channels and apply it to reconstruct the full solar UV spectrum using linear regression technique, which can be then evaluated against the reference solar UV spectrum. Because we are interested mostly in the accuracy of
20
the final product (i.e., state of the middle atmosphere) it is worthwhile to apply goal-oriented approach and compare the temperature and specie distributions simulated with a model driven by the reference and reconstructed solar UV irradiance. This ap-proach allows us to filter out the difference in the solar irradiance, which is not really important for the simulation of the atmospheric state. It is also of interest to look at
25
some other available in real time proxies and estimate their potential for the UV irradi-ance reconstruction. In case of success they can be considered as auxiliary input for the regression model. In the paper we considered the following additional proxies (so-lar UV irradiance at 205 nm; total so(so-lar irradiance; so(so-lar radio flux at 10.7 cm; neutron
ACPD
8, 4099–4116, 2008Reconstruction of the solar UV irradiance
from LYRA data T. Egorova et al. Title Page Abstract Introduction Conclusions References Tables Figures ◭ ◮ ◭ ◮ Back Close Full Screen / Esc
Printer-friendly Version Interactive Discussion
monitor data).
The structure of the paper is the following. The applied 1-D model is described in Sect. 2. The results of the regression analysis are presented in Sect. 3. In Sect. 4 we discuss the results of the goal-oriented evaluation. Conclusions and outlook are presented in Sect. 5.
5
2 Model description
For this study we applied 1-D radiative-convective model with interactive photochem-istry (RCMP) described by Rozanov et al. (2002) and extended to take into account chemistry of the charged species in the middle atmosphere. The 1-D RCMP con-sists of the radiation, chemistry, convective adjustment and vertical diffusion modules.
10
The model spans the atmosphere from the ground to 100 km. For the calculation of long wave cooling rates we have applied the radiation scheme of Frolkis and Rozanov (1992) for the atmosphere below 1 hPa and of Fomichev et al. (1998) to treat non-LTE processes in the mesosphere. For the calculation of the photolysis and solar heating rates we also use modified scheme of Frolkis and Rozanov (1992). The heating and
15
photolysis rate calculation scheme spans the spectral region from 120 to 750 nm. The entire spectral region is divided into 73 spectral intervals.
The photochemical part of the model includes neutral and ion chemistry. It cal-culates the distribution of 43 neutral chemical species of the oxygen, nitrogen, hy-drogen, carbon, chlorine and bromine groups with 173 reactions. The ion chemistry
20
includes 48 ions (31 Positive and 17 negative) with 278 reactions. The main posi-tive ions are O+, O+2, N+2, NO+, and O+4. The main negative ions are O−, O−
2, O − 3, O− 4, OH −, CO− 3, CO − 4, NO − 2, NO − 3, and HCO −
3. Also it takes into account proton
hy-drates H+(H2O)n, n=1. . . 7, NO+ hydrates NO+(H2O)n, n=1,2,3, NO+(H2O)nN2 and
NO+(H2O)nCO2 , where n=1,2. Other included ion clusters are NO+(N2), NO+(CO2),
25
O+2(H2O), and H3O+(OH). The sources of ionization are galactic cosmic rays (GCR),
ACPD
8, 4099–4116, 2008Reconstruction of the solar UV irradiance
from LYRA data T. Egorova et al. Title Page Abstract Introduction Conclusions References Tables Figures ◭ ◮ ◭ ◮ Back Close Full Screen / Esc
Printer-friendly Version Interactive Discussion
For GCR we utilize the parameterization by Heaps (1978), for SPEs we use database of solar proton fluxes (http://www.geo.fu-berlin.de/en/met/ag/strat/research/SOLARIS/
Input data/index.html). The chemical solver utilizes pure implicit iterative Newton-Raphson scheme (Rozanov et al., 1999). The reaction coefficients are taken from Sander et al. (2003) for neutral atmosphere and from Koop (1996) and Kazil (2002)
5
for ionosphere. The convective adjustment is treated according Egorova et al. (1997) and vertical transport of species is calculated using typical annually mean values of the diffusion coefficient.
3 Regression analysis
As the input for the model we use spectral solar irradiance obtained with SUSIM and
10
SOLSTICE instruments on board UARS satellite (Woods et al., 1996), which are pub-licly available from the NASA ftp site: disc.sci.gsfc.nasa.gov. For the present study we used daily average data for 2000, which is appropriate for the solar maximum.
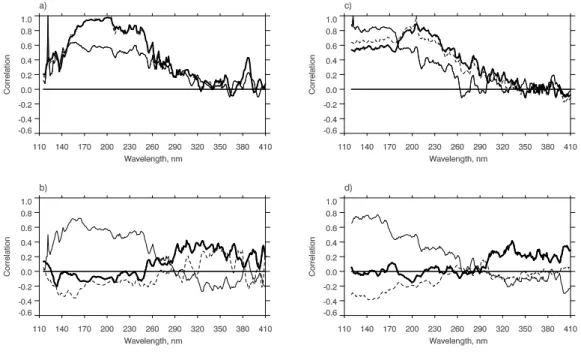
First of all we calculated the correlation coefficients between of the observed with SUSIM and SOLTICE solar spectral UV irradiance and considered proxies. Ly-α proxy
15
is the solar irradiance in Lyman-alpha line (121–122 nm). 205 nm proxy is the solar irradiance in the 204–205 nm spectral bin. HERZ proxy is the solar irradiance in the Herzberg channel of the LYRA instrument. The latter has been constructed from the LYRA Herzberg continuum channel taking into account responsivity of LYRA instrument detectors provided by I. Dammasch (ROB, Belgium). These three proxies have been
20
calculated for the both SUSIM and SOLSTICE data sets. TSI proxy is the total so-lar irradiance from the VIRGO experiment (ftp://ftp.pmodwrc.ch/pub/virgo/data). F10.7 proxy is the solar radio flux at 10.7 cm (www.ngdc.noaa.gov/stp/SOLAR/ftpsolarradio.
html) and NMD proxy is the neutron monitor data (www.ngdc.noaa.gov/stp/ SO-LAR/ftpcosmicrays.html). The smoothed correlation coefficients are shown in the
25
Fig. 1.
be-ACPD
8, 4099–4116, 2008Reconstruction of the solar UV irradiance
from LYRA data T. Egorova et al. Title Page Abstract Introduction Conclusions References Tables Figures ◭ ◮ ◭ ◮ Back Close Full Screen / Esc
Printer-friendly Version Interactive Discussion
havior. Their correlation with SUSIM spectral irradiance is rather low for the wavelength shorter than ∼160 nm, but it becomes quite high (>0.8) between 160 nm and 250 nm. For the longer wavelengths the correlation is steadily decreasing. For the SOLSTICE data the main difference appears below 170 nm. In this area the correlation with 205 nm is much higher (∼0.5) than for SUSIM data. Ly-α proxy also works much better in this
5
spectral region for SOLTICE data, while for longer wavelengths (>170 nm) this proxy has very week correlation with spectral irradiance. It is also evident from the Fig. 1 (a, c) that the spectral solar irradiance in the spectral regions shorter and longer ∼260 nm are not well connected at least for the applied considered daily time scale. This fact was also mentioned previously by Krivova et al. (2006). The correlation of the solar
10
spectral irradiance with F10.7 proxy is higher for the short-wave bands (120–250 nm), but even in this case it hardly reaches 0.5. The TSI and NMD proxies have almost no correlation with solar irradiance between 120 and 270 nm, while for the rest of the UV spectrum TSI has better correlation (∼0.4) than the other proxies. In general, the reconstructions of the solar irradiance using Ly-α, 205 nm and HERZ proxies are more
15
accurate than the reconstructions based on the F10.7 proxy. According to our analysis the TSI and NMD proxies do not allow realistic reconstruction of the solar UV irradiance variability. The best correlation can be reached using a combination of the HERZ and Ly-α proxies. These two quantities will be measured by LYRA instrument and hereafter this combined proxy will be called LYRA.
20
The difference in the results of the correlation analysis for the spectral range 110– 170 nm with UARS SUSIM and UARS SOLSTICE data sets most probably has instru-mental nature. This issue was discussed in detail by Woods et al. (1996). They pointed out that the sensor degradation and instrumental noise can deteriorate the quality of the data in these spectral intervals, which leads in our case to severely different
corre-25
lations for two considered UARS instruments.
Using above described proxies we have reconstructed solar UV irradiance for spec-tral interval 120–750 nm required by the model applying linear regression analysis. We
ACPD
8, 4099–4116, 2008Reconstruction of the solar UV irradiance
from LYRA data T. Egorova et al. Title Page Abstract Introduction Conclusions References Tables Figures ◭ ◮ ◭ ◮ Back Close Full Screen / Esc
Printer-friendly Version Interactive Discussion
use the following regression equation for the reconstruction:
Fi
λ = Aλ+ Bλ× P i
(1) where F is solar spectral UV irradiance; λ is wavelength; i is a day number; P is solar irradiance proxy: Ly-α, 205 nm, HERZ, TSI, F10.7, or NMD; A and B are wavelength dependent regression coefficients. For the combined LYRA proxy we calculate the solar
5
irradiance from Eq. (1) for all wavelengths using LYRA Herzberg channel irradiance as
P, except Ly-α line, where the observed values are used.
4 Accuracy evaluation
From the correlation analysis presented in the Sect. 3 it is hard to conclude how ac-curate would be the simulation of the atmospheric state driven by the reconstructed
10
solar irradiance, because the solar irradiance at different wavelengths has different in-fluence on the atmospheric state (e.g., Rozanov et al., 2002) and it well could be that a substantial error in the solar irradiance would not affect some of the simulated atmo-spheric quantities. Therefore, the accuracy of the reconstruction should be evaluated by the comparison of the atmospheric state variability simulated with a model driven
15
by the observed and reconstructed daily spectral solar UV irradiance. We performed several 1-year long runs with the 1-D RCMP described in Sect. 2. Two reference runs were driven by the observed solar irradiance from UARS SUSIM and UARS SOLSTICE instruments. The other twelve runs have been performed with the solar irradiance re-constructed from different proxies: Ly-α, 205 nm, LYRA, TSI, F10.7, and NMD for the
20
both instruments.
To characterize the accuracy of the reconstruction we calculated the correlation co-efficients and relative RMS difference between the daily temperature, ozone, hydroxyl and total positive ions concentration simulated with the observed and reconstructed solar spectral UV irradiance. The analysis of these quantities shows which proxy is
25
ACPD
8, 4099–4116, 2008Reconstruction of the solar UV irradiance
from LYRA data T. Egorova et al. Title Page Abstract Introduction Conclusions References Tables Figures ◭ ◮ ◭ ◮ Back Close Full Screen / Esc
Printer-friendly Version Interactive Discussion
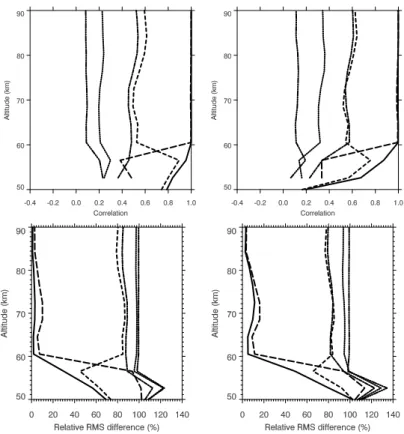
coefficient and RMS differences for the total positive ions concentration are shown in Fig. 2. The ionization rates for our model are defined mostly by the photoionization of NO and by galactic cosmic rays (GCR). The photoionization of NO occurs by the soft solar UV irradiance (Brasseur and Solomon, 2005), therefore its concentration in the mesosphere should be well defined there by the solar irradiance in Lyman-α. In the
5
stratosphere, where the influence of GCR is noticeable the total number of positive ions also depends on the atmospheric temperature and neutral species. Due to the former process the accuracy of the solar irradiance reconstruction using Ly-α and LYRA prox-ies is very good in the mesosphere above 60 km. The correlation coefficients are close to 1.0 and RMS difference is less than 10%. Between 50 and 60 km 205 nm and LYRA
10
proxies provide the best accuracy. It confirms the importance of the temperature and neutral species, which are defined (see below) for the most part by the solar irradiance in Herzberg continuum.
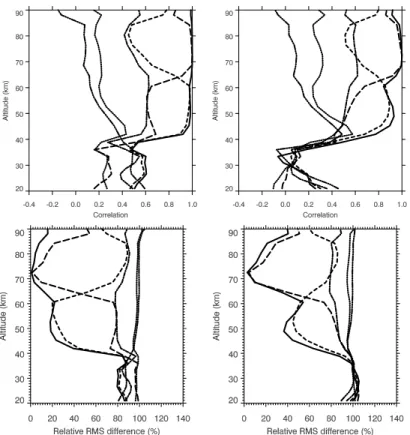
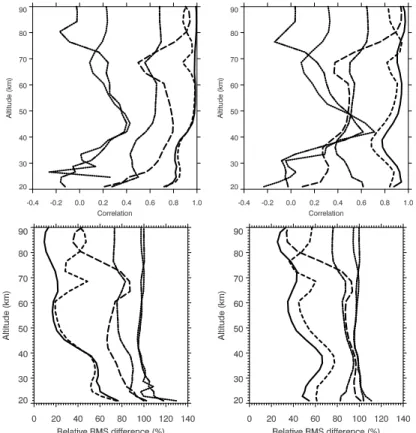
The vertical profiles of the correlation coefficient and RMS differences for the hy-droxyl are shown in Fig. 3. Hyhy-droxyl behavior is very complicated and is defined by
15
multitude of physical and chemical processes in the atmosphere (e.g., Brasseur and Solomon, 2005). In the mesosphere, however, the dominant source of hydroxyl is pho-tolysis of the water vapor in Lyman-α line; therefore above 60 km the best accuracy is provided by Ly-α and LYRA proxies. The correlation coefficients are close to 1.0 and RMS difference does not exceed 20%. From 20 to 60 km the production of hydroxyl
20
depends on the ozone and excited atomic oxygen concentrations, which are better represented by 205 nm and LYRA proxies. For these altitudes the correlation is still high (∼0.5) for SUSIM data set, but for the SOLTICE reasonable accuracy cannot be achieved. The RMS difference are large (∼100%) below 40 km for both data set, which means that none of considered proxies are able to provide satisfactory accuracy for the
25
hydroxyl between 20 and 40 km.
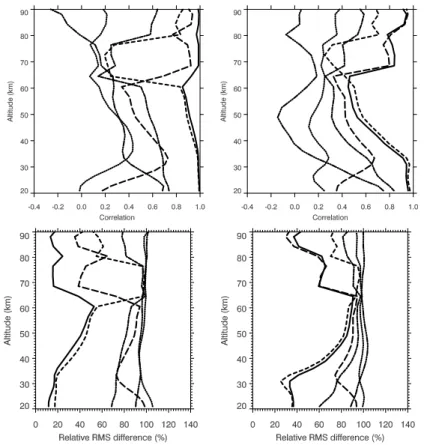
The vertical profiles of the correlation coefficient and RMS differences for the ozone are shown in Fig. 4. The ozone sensitivity to the solar spectral UV irradiance variabil-ity has been considered in many publications (see Brasseur and Solomon, 2005 and
ACPD
8, 4099–4116, 2008Reconstruction of the solar UV irradiance
from LYRA data T. Egorova et al. Title Page Abstract Introduction Conclusions References Tables Figures ◭ ◮ ◭ ◮ Back Close Full Screen / Esc
Printer-friendly Version Interactive Discussion
references therein). Rozanov et al. (2002) found out that the observed enhancement of solar UV irradiance in the spectral region 170–240 nm leads to the ozone increase between 20 and 90 km due to additional molecular oxygen photolysis and subsequent increase of the ozone production, while the enhancement of the solar irradiance in Hartley band (240–300 nm) results in the ozone decrease from 40 to 70 km due to
5
elevated ozone destruction rates by the enhanced ozone photolysis. Therefore the accuracy of the ozone simulation depends on the accuracy of the solar UV reconstruc-tion in rather wide spectral area and also on the variability of the reference solar UV irradiance. In case of SUSIM data the accuracy of the ozone prediction is very high with LYRA and 205 nm proxies below 60 km and LYRA and Ly-α proxies above 60 km.
10
For the SOLTICE data the ozone simulation has much lower accuracy in the 40–65 km level. This effect is caused by the fact that the variability of the solar UV irradiance in Hartley band in SOLTICE data is higher than in SUSIM data (e.g., Rozanov et al., 2008). As it is clear from Fig. 1 our proxies do not properly reproduce the solar irradi-ance in the Hartley band, which results in unaccounted ozone variability in the case of
15
the SOLTICE data. This effect is not so pronounced for the SUSIM data because the variability of the solar irradiance in Hartley band is much smaller.
The vertical profiles of the correlation coefficient and RMS differences for the tem-perature are shown in Fig. 5. The temtem-perature sensitivity to the solar spectral UV irradiance variability has been analyzed by Rozanov et al. (2002). They found out
20
that the observed enhancement of solar UV irradiance results in the warming of the stratosphere due to absorption of additional energy by ozone and oxygen. The oxygen Schumann-Runge band is responsible for the heating of the mesosphere, while the ozone absorption in Herzberg continuum and part of the ozone Hartley band (260– 300 nm) warms up the stratosphere. It should be noted that the contribution of the
25
Hartley band is slightly smaller in comparison with Herzberg continuum, and the ab-sorption in Lyman-α is noticeable only in the upper mesosphere. Because the solar irradiance in Schumann-Runge band and Herzberg continuum is well correlated with LYRA and 205 nm proxies, the accuracy of the temperature simulation is rather high
ACPD
8, 4099–4116, 2008Reconstruction of the solar UV irradiance
from LYRA data T. Egorova et al. Title Page Abstract Introduction Conclusions References Tables Figures ◭ ◮ ◭ ◮ Back Close Full Screen / Esc
Printer-friendly Version Interactive Discussion
especially above 40 km. Below 40 km the influence of Hartley band is noticeable and the accuracy of the temperature simulations drops down. The results also demon-strated that the other proxies (including F10.7) do not provide sufficient accuracy for the simulation of all considered quantities.
5 Conclusions
5
In the paper we evaluate the applicability of the data from the future LYRA experiment onboard ESA PROBA2 satellite for the nowcasting of the middle atmosphere state. The LYRA instrument onboard ESA PROBA2 satellite will provide 6-hourly solar ir-radiance at the Lyman-alpha (121.6 nm) and the Herzberg continuum (∼200–220 nm wavelength range). To reconstruct the solar irradiance for the wide spectral area (120–
10
680 nm) needed for nowcasting models we have applied the statistical tool based on the correlation of the solar spectral UV irradiance with different proxies using the daily solar spectral irradiance measured with SUSIM and SOLSTICE instruments onboard UARS satellite. To estimate the accuracy of the reconstructed solar irradiance we have applied 1-D transient radiative-convective model with neutral and ion chemistry. We
15
compared the results of transient 1-year long model simulations for 2000 driven by the observed and reconstructed solar irradiance and showed that the reconstruction of the full spectrum using linear regression equation based on the solar irradiance in two LYRA channels can be successfully used for nowcasting of the middle atmosphere state above 40 km. Some problem with ozone simulation between 40 and 70 km has
20
been encountered when the SOLSTICE solar irradiance is used as the reference. This problem is caused by the enhanced variability of the SOLSTICE solar irradiance in the ozone Hartley band. At the moment it is hard to say whether this problem is real or it is just instrumental error. Probably, further study with different reference solar irradiance data set (SORCE, Rottman et al., 2006) would help to solve this problem. Lower
ac-25
curacy has been obtained using Ly-α, HERZ and 205 nm proxies. Ly-α proxy can be successfully used in the mesosphere and HERZ and 205 nm proxies give reasonable
ACPD
8, 4099–4116, 2008Reconstruction of the solar UV irradiance
from LYRA data T. Egorova et al. Title Page Abstract Introduction Conclusions References Tables Figures ◭ ◮ ◭ ◮ Back Close Full Screen / Esc
Printer-friendly Version Interactive Discussion
accuracy in the stratosphere, but the accuracy of the combined LYRA proxy is superior. The solar irradiance reconstructed from F10.7, TSI and NMD proxies does not provide reasonable accuracy. It is important to emphasize that all conclusions are valid for daily time scale. The correlation between solar irradiance and considered proxies can be rather different for the monthly and annual time scales.
5
Acknowledgements. This work has been supported by Swiss National Science Foundation
(grant N 200020-101848/1) and Swiss COST-724 (grant C04.0106).
References
Brasseur, G. and Solomon, S.: Aeronomy of the middle atmosphere: Chemistry and physics of the stratosphere and mesosphere, 3. Edition, Springer, Dordrecht, the Netherlands, 2005.
10
Dudok de Wit, T., Lilensten, J., Aboudarham, J., Amblard, P.-O., and Kretzschmar, M.: Re-trieving the solar EUV spectrum from a reduced set of spectral lines, Ann. Geophys., 23, 30 055–30 069, 2005.
Egorova, T. A., Karol, I. L., and Rozanov, E. V.: The influence of ozone content loss in the lower stratosphere on the radiative balance of the troposphere, Physics of atmosphere and ocean
15
(Russian Academy of Sciences), 33, N4, 492–499, 1997.
Floyd, L. E., Reiser, P. A., Crane, P. C., Herring, L. C., Prinz, D. K., and Brueckner, G. E.: Solar cycle 22 UV spectral irradiance variability:current measurements by SUSIM UARS, Solar Phys., 177, 79–87, 1998.
Fomichev, V. I., Blanchet, J.-P., and Tuner, D. S.: Matrix parameterization of the 15 micro
20
CO2 band cooling in the middle and upper atmosphere for variable CO2 concentration, J.Geophys. Res., 103, 11 505–11 528, 1998.
Frolkis, V. A. and Rozanov, E.V.: Radiation code for climate and general circulation models, IRS’92: Current problems in atmospheric radiation, Tallin, Estonia, 3–8 August, 176–179, 1992.
25
Jansen, F., Pirjola, R., and Favre, R.: Space weather: Hazard to the Earth?, Swiss Re Publish-ing, Zurich, 39 pp., 2000.
Heaps, M. Parameterization of the cosmic ray ion-pair production rate above 18 km, Planet Space Sci., 26, 513–517, 1978.
ACPD
8, 4099–4116, 2008Reconstruction of the solar UV irradiance
from LYRA data T. Egorova et al. Title Page Abstract Introduction Conclusions References Tables Figures ◭ ◮ ◭ ◮ Back Close Full Screen / Esc
Printer-friendly Version Interactive Discussion
Hochedez, J.-F.,Schmutz, W., Stockman, Y. et al.: LYRA: the Solar UV radiometer aboard the ESA Proba-2, LYRA, a solar UV radiometer on Proba2, Adv. Space Res., 37, 303–312, 2006.
Kazil. J.: The University of Bern Atmospheric Ion Model: Time-Dependent Ion Modeling in the Stratosphere, Mesosphere and Lower Thermosphere, PhD Thesis, University of Bern,
5
Switzertland, 2002.
Koop. E.: Electron and ion dencities, in: The Upper Atmosphere,edited by: Dieminger, W., Hartman, G. K., and Leitinger, R., Springer, 1996.
Krivova, N. A, Solanki, S. K., and Floyd, L.: Reconstruction of solar UV irradiance in cycle 23, Astron. Astropys., 452, 631–639, 2006.
10
Rozanov, E. V., Zubov, V. A., Schlesinger, M. E., Yang, F., and Andronova N. G.: The UIUC 3-D Stratospheric Chemical Transport Model: Description and Evaluation of the simulated Source Gases and Ozone, J. Geophys. Res., 104, 11 755–11 781, 1999.
Rozanov, E., Egorova, T., Fr ¨ohlich, C., Haberreiter, M., Peter, T., and Schmutz, W.: Estimation of the Ozone and Temperature Sensitivity to the Variation of Spectral Solar Flux, in: SOHO
15
11 Symposium From Solar Min to Max: Half a Solar Cycle with SOHO, edited by: Wilson, A., ESA SP-508, ESA Publications Division, Noordwijk, The Netherlands, 181–185, 2002. Rozanov, E., Egorova, T., and Schmutz, W.: Response of the Earth’s Atmosphere to the Solar
Irradiance Variability, In the book: Climate Variability and Extremes during the Past 100 Years, edited by: Br ¨onnimann, S., Luterbacher, J., Ewen, T., Diaz, H. F., Stolarski, R. S.,
20
Neu, U., Adv. Global Change Res., 33, 317–331, Springer, 2008.
Sander, S. P., Friedl, R., Golden, D. et al.: Chemical kinetics and photochemical data for use in atmospheric studies: Evaluation number 14, Tech. Rep. JPL Publ. 02-25, Jet Propulsion Laboratory, 2003.
Wilkinson, D.C.: National Oceanic and Atmospheric Administration’s spacecraft anomaly data
25
base and examples of solar activity affecting spacecraft, J. Spacecraft Rockets, 31, March– April, 1994.
Woods, T. N., Prinz, D. K., Rottman, G. J., et al.: Validation of the UARS solar ultraviolet irradiances: Comparison with ATLAS 1 and 2 measurements, J. Geophys. Res., 101, 9541– 9569, 1996.
ACPD
8, 4099–4116, 2008Reconstruction of the solar UV irradiance
from LYRA data T. Egorova et al. Title Page Abstract Introduction Conclusions References Tables Figures ◭ ◮ ◭ ◮ Back Close Full Screen / Esc
Printer-friendly Version Interactive Discussion
Fig. 1. The correlation of the spectral SUSIM ((a),(b)) and SOLSTICE ((c),(d)) solar irradiance with different proxies: Ly-α (thin line), 205 nm (dashed line), Herz (thick line) ((a), (c)) and TSI (thick line), F10.7(thin line), and NMD (dashed line) ((b), (d)) for the year 2000.
ACPD
8, 4099–4116, 2008Reconstruction of the solar UV irradiance
from LYRA data T. Egorova et al. Title Page Abstract Introduction Conclusions References Tables Figures ◭ ◮ ◭ ◮ Back Close Full Screen / Esc
Printer-friendly Version Interactive Discussion
Fig. 2. Positive ions: Vertical profiles of the correlation (upper row) and relative RMS difference (lower row) of daily variations of the total positive ions for SUSIM (left column) and SOLSTICE (right column) with different proxies: Ly-α (long dashed line), 205 nm (dashed line), LYRA (solid line), TSI (dash-dot-dot-dot line), F10.7(dash-dot line), and NMD (dotted line).
ACPD
8, 4099–4116, 2008Reconstruction of the solar UV irradiance
from LYRA data T. Egorova et al. Title Page Abstract Introduction Conclusions References Tables Figures ◭ ◮ ◭ ◮ Back Close Full Screen / Esc
Printer-friendly Version Interactive Discussion
Fig. 3. Hydroxyl: Vertical profiles of the correlation (upper row) and relative RMS difference (lower row) of daily variations of the hydroxyl for SUSIM (left column) and SOLSTICE (right column) with different proxies: Ly-α (long dashed line), 205 nm (dashed line), LYRA (solid line), TSI (dash-dot-dot-dot line), F10.7(dash-dot line), and NMD (dotted line).
ACPD
8, 4099–4116, 2008Reconstruction of the solar UV irradiance
from LYRA data T. Egorova et al. Title Page Abstract Introduction Conclusions References Tables Figures ◭ ◮ ◭ ◮ Back Close Full Screen / Esc
Printer-friendly Version Interactive Discussion
Fig. 4. Ozone: Vertical profiles of the correlation (upper row) and relative RMS difference (lower row) of daily variations of the ozone for SUSIM (left column) and SOLSTICE (right column) with different proxies: Ly-α (long dashed line), 205 nm (dashed line), LYRA (solid line), TSI (dash-dot-dot-dot line), F10.7(dash-dot line), and NMD (dotted line).
ACPD
8, 4099–4116, 2008Reconstruction of the solar UV irradiance
from LYRA data T. Egorova et al. Title Page Abstract Introduction Conclusions References Tables Figures ◭ ◮ ◭ ◮ Back Close Full Screen / Esc
Printer-friendly Version Interactive Discussion
Fig. 5. Temperature: Vertical profiles of the correlation (upper row) and relative RMS difference (lower row) of daily variations of the temperature for SUSIM (left column) and SOLSTICE (right column) with different proxies: Ly-α (long dashed line), 205 nm (dashed line), LYRA (solid line), TSI (dash-dot-dot-dot line), F10.7(dash-dot line), and NMD (dotted line).