HAL Id: hal-00302760
https://hal.archives-ouvertes.fr/hal-00302760
Submitted on 10 May 2007HAL is a multi-disciplinary open access
archive for the deposit and dissemination of sci-entific research documents, whether they are pub-lished or not. The documents may come from teaching and research institutions in France or abroad, or from public or private research centers.
L’archive ouverte pluridisciplinaire HAL, est destinée au dépôt et à la diffusion de documents scientifiques de niveau recherche, publiés ou non, émanant des établissements d’enseignement et de recherche français ou étrangers, des laboratoires publics ou privés.
Formation of large (?100 ?m) ice crystals near the
tropical tropopause
E. J. Jensen, L. Pfister, T. V. Bui, P. Lawson, B. Baker, Q. Mo, D.
Baumgardner, E. M. Weinstock, J. B. Smith, E. J. Moyer, et al.
To cite this version:
E. J. Jensen, L. Pfister, T. V. Bui, P. Lawson, B. Baker, et al.. Formation of large (?100 ?m) ice crystals near the tropical tropopause. Atmospheric Chemistry and Physics Discussions, European Geosciences Union, 2007, 7 (3), pp.6293-6327. �hal-00302760�
ACPD
7, 6293–6327, 2007Formation of large crystals near the tropical tropopause E. J. Jensen et al. Title Page Abstract Introduction Conclusions References Tables Figures ◭ ◮ ◭ ◮ Back Close
Full Screen / Esc
Printer-friendly Version
Interactive Discussion
EGU Atmos. Chem. Phys. Discuss., 7, 6293–6327, 2007
www.atmos-chem-phys-discuss.net/7/6293/2007/ © Author(s) 2007. This work is licensed
under a Creative Commons License.
Atmospheric Chemistry and Physics Discussions
Formation of large (≃100 µm) ice crystals
near the tropical tropopause
E. J. Jensen1, L. Pfister1, T. V. Bui1, P. Lawson2, B. Baker2, Q. Mo2,
D. Baumgardner3, E. M. Weinstock4, J. B. Smith4, E. J. Moyer4, T. F. Hanisco4, D. S. Sayres4, J. M. St. Clair4, M. J. Alexander5, O. B. Toon6, and J. A. Smith6
1
NASA Ames Research Center, Moffett Field, CA, USA
2
SPEC Inc., Boulder, CO, USA
3
Centro de Ciencias de la Atmosfera, Universidad Nacional Autonoma de Mexico, Circuito Exterior, Mexico
4
Harvard University, Cambridge, MA, USA
5
Colorado Research Associates, Boulder, CO, USA
6
University of Colorado, Boulder, CO, USA
Received: 27 March 2007 – Accepted: 23 April 2007 – Published: 10 May 2007 Correspondence to: E. J. Jensen (eric.j.jensen@nasa.gov)
ACPD
7, 6293–6327, 2007Formation of large crystals near the tropical tropopause E. J. Jensen et al. Title Page Abstract Introduction Conclusions References Tables Figures ◭ ◮ ◭ ◮ Back Close
Full Screen / Esc
Printer-friendly Version
Interactive Discussion
Abstract
Recent high-altitude aircraft measurements with in situ imaging instruments indicated the presence of relatively large (≃100 µm length), thin (aspect ratios of ≃6:1 or larger) hexagonal plate ice crystals near the tropical tropopause in very low concentrations (<0.01 L−1). These crystals were not produced by deep convection or aggregation.
5
We use simple growth-sedimentation calculations as well as detailed cloud simulations to evaluate the conditions required to grow the large crystals. Uncertainties in crystal aspect ratio leave a range of possibilities, which could be constrained by knowledge of the water vapor concentration in the air where the crystal growth occurred. Un-fortunately, water vapor measurements made in the cloud formation region near the
10
tropopause ranged from <2 ppmv to ≃3.5 ppmv. The higher water vapor concentra-tions correspond to very large ice supersaturaconcentra-tions (relative humidities with respect to ice of about 200%). If the aspect ratios of the hexagonal plate crystals are as small as the image analysis suggests (6:1, see companion paper Lawson et al., 2007) then growth of the large crystals before they sediment out of the supersaturated layer would
15
only be possible if the water vapor concentration were on the high end of the range indicated by the different measurements (>3 ppmv). On the other hand, if the crystal aspect ratios are quite a bit larger (≃14), then H2O concentrations toward the low of the
measurement range (≃2–2.3 ppmv) would suffice to grow the large crystals. Gravity-wave driven temperature and vertical wind perturbations only slightly modify the H2O
20
concentrations needed to grow the crystals. We find that it would not be possible to grow the large crystals with water concentrations less than 2 ppmv, even with assump-tions of a very high aspect ratio of 15 and steady upward motion of 2 cm s−1 to loft the crystals in the tropopause region. These calculations would seem to imply that the measurements indicating water vapor concentrations less than 2 ppmv are
implausi-25
ble, but we cannot rule out the possibility that higher humidity prevailed upstream of the aircraft measurements and the air was dehydrated by the cloud formation. Sim-ulations of the cloud formation with a detailed model indicate that the large crystals
ACPD
7, 6293–6327, 2007Formation of large crystals near the tropical tropopause E. J. Jensen et al. Title Page Abstract Introduction Conclusions References Tables Figures ◭ ◮ ◭ ◮ Back Close
Full Screen / Esc
Printer-friendly Version
Interactive Discussion
EGU probably nucleated on very effective ice nuclei. Also, growth of the large crystals would
not have been possible if homogeneous freezing of aqueous aerosols and subsequent ice crystal growth had rapidly depleted vapor in excess of saturation, implying either very slow cooling during cloud formation or that the aerosol physical state was differ-ent from those used in homogeneous freezing laboratory experimdiffer-ents, such that the
5
vast majority of aerosols present did not freeze even at very high ice supersaturations. Improvements in our understanding of detailed cloud microphysical processes require resolution of the water vapor measurement discrepancies in these very cold, dry re-gions of the atmosphere.
1 Introduction
10
Widespread, optically thin, laminar cirrus clouds prevalent near the cold tropical tropopause have attracted considerable interest over the past several years due to their potential role in controlling the water vapor concentration in the stratosphere. Sev-eral modeling studies have suggested that these clouds can effectively freeze-dry air crossing the tropical tropopause to the observed lower stratospheric water vapor
con-15
centrations (Jensen et al.,1996;Holton and Gettelman,2001;Gettelman et al.,2002; Jensen and Pfister,2004;Fueglistaler et al.,2005). Stratospheric humidity ultimately affects polar stratospheric cloud formation and polar ozone destruction (Toon et al., 1989; Solomon et al., 1986), as well as gas-phase ozone destruction (Dvorstov and Solomon, 2001). In addition, thin cirrus near the tropopause may significantly affect
20
the Earth’s radiation budget as well as the local thermal budget near the tropopause (Comstock et al.,2002).
The inaccessibility of the tropical tropopause region (≃16–18 km altitude) has lim-ited microphysical measurements of these thin cirrus in the past. During the 2006 CRAVE (Costa Rica Aura Validation Experiment) mission, subvisible cirrus near the
25
tropical tropopause were sampled extensively with an unprecedented array of micro-physical instrumentation on-board the NASA WB-57 aircraft. The hydrometeor imaging
ACPD
7, 6293–6327, 2007Formation of large crystals near the tropical tropopause E. J. Jensen et al. Title Page Abstract Introduction Conclusions References Tables Figures ◭ ◮ ◭ ◮ Back Close
Full Screen / Esc
Printer-friendly Version
Interactive Discussion instruments indicated the presence of relatively large (≃80–110 µm) ice crystals only
a few hundred meters below the tropopause on multiple flights. (We use the term “tropopause” to refer to the cold point in the vertical temperature profile.)
In this study, we use numerical simulations of crystal growth and sedimentation to investigate the conditions required to form such large crystals. We find that even if the
5
ice concentrations in these clouds were low enough to prevent depletion of vapor due to crystal growth, it is challenging to model the growth of the large crystals, and large ice supersaturations may be required. The degree of supersaturation required to grow the large hexagonal plate crystals depends on their aspect ratios, which appear to be about 6:1 based on analysis of the crystal images presented in a companion paper
10
(Lawson et al.,2007). However, uncertainty associated with blur in the crystal images allows the possibility of somewhat larger aspect ratios. Multiple combinations of water vapor concentrations and aspect ratios would allow growth of the large crystals. We discuss these results with respect to the wide range of TTL water vapor concentrations indicated by the different instruments used in CRAVE. We also evaluate nucleation
sce-15
narios that can produce the observed ice crystal size distributions while still resulting in formation of a small number of large crystals.
In Sect. 2 we describe the measurements indicating large crystals in the TTL cirrus as well as the CRAVE water vapor measurements. Next, we present simple growth-sedimentation calculations used to understand the formation of the observed crystals
20
(Sect. 3). The influence of wave-driven temperature and vertical wind perturbations is discussed in Sect. 4. Simulations of entire vertical profiles of ice crystals and in-teractions with water vapor are then presented (Sect. 5). Lastly, we present various scenarios for consistency between the range of water vapor concentrations indicated by the measurements and the existence of the large ice crystals (Sect. 6).
ACPD
7, 6293–6327, 2007Formation of large crystals near the tropical tropopause E. J. Jensen et al. Title Page Abstract Introduction Conclusions References Tables Figures ◭ ◮ ◭ ◮ Back Close
Full Screen / Esc
Printer-friendly Version
Interactive Discussion
EGU 2 Ice crystal and water vapor measurements
Given the heights of clouds within the TTL (15–18 km), direct sampling is only possible with specialized, high-altitude aircraft. Only a few such measurements have been made in the past, and only one of these included actual images of the ice crystals. Heyms-field (1986) reported in situ measurements of thin cirrus near the tropical tropopause,
5
using a formvar replicator onboard a WB-57 during the mid-1970s. The ice crystals were mostly trigonal or columnar, with sizes up to 50 µm.McFarquhar et al.(2000) re-ported Axially Scattering Spectrometer Probe (ASSP, 2–30 µm) and One-Dimensional Cloud (1DC, 20–330 µm) measurements from the same flight. Crystals larger than 17 µm were not detected by the ASSP, but the 1DC occasionally detected crystals with
10
maximum dimensions as large as 50 µm. However, as discussed by Lawson et al. (2007), these instruments were likely to be incapable of properly sizing crystals in the size range from about 30 to 150 µm. Peter et al. (2003) reported Forward Scattering Spectrometer (FSSP-300) measurements in an extremely thin cirrus cloud sampled near the tropical tropopause by the Geophysica aircraft. The measurements indicated
15
a distinct mode in the size distribution at about 10–12 µm diameter, but there was no instrumentation to detect crystals larger than 23 µm.
Here we present measurements indicating unexpectedly large crystals near the trop-ical tropopause. Instrumentation on-board the WB-57 during CRAVE for measuring ice crystal sizes and habits included the Cloud Particle Imager (CPI) (Lawson et al.,2001),
20
the 2-Dimensional Stereo probe (2D-S) (Lawson et al.,2006), and the Cloud Aerosol and Precipitation Spectrometer (CAPS) (Baumgardner et al.,2001). The CPI records digital images (2.3 µm pixel size) of crystals that pass through the sample volume. The 2D-S probe captures two-dimensional images of crystals that pass through the sample volume. The 2D-S is an improvement over older optical imaging probes that suffered
25
from slow time response and missed most crystals smaller than 100 µm at the air-speeds of jet aircraft. The 2D-S provides actual 10 µm particle size resolution at the nominal WB-57F airspeed of 170 m s−1 (Lawson et al., 2006). CAPS consists of two
ACPD
7, 6293–6327, 2007Formation of large crystals near the tropical tropopause E. J. Jensen et al. Title Page Abstract Introduction Conclusions References Tables Figures ◭ ◮ ◭ ◮ Back Close
Full Screen / Esc
Printer-friendly Version
Interactive Discussion instruments: the Cloud Aerosol Spectrometer (CAS) retrieves particle sizes by
mea-suring light scattered off the particles and has an effective size range of 0.5–50 µm; the Cloud Imaging Probe (CIP) is similar to 2D-S except that it has a resolution of 25 µm and a slightly slower electronic response time that may limit its size range from 50 to 1550 µm.
5
During the CRAVE time period (14 January–11 February, 2006) tropical tropopause temperatures were anomalously cold, particularly during the first three weeks of the mission. Tropopause temperatures measured by the meteorological measurement sys-tem (MMS) on the WB-57 were typically around 186 K or less, and the minimum sys- tem-perature measured was 180.5 K. As a result of these cold temtem-peratures, the TTL was
10
often highly supersaturated with respect to ice and optically thin cirrus were sampled on several flights. Lawson et al.(2007) provide a detailed description of the subvisible cirrus properties. On at least four of these flights, relatively large (>65 µm), ice crystals were apparent in the CPI, 2D-S, and CIP images. The large crystals were most preva-lent on the flight south from Costa Rica on 1 February while the aircraft was porpoising
15
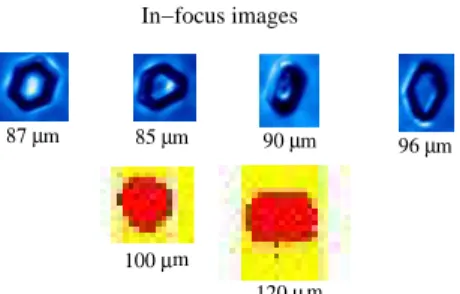
through the TTL. Low concentrations (<0.01 L−1) of crystals larger than 65 µm were detected during this time period. Four CPI crystals larger than 85 µm and 12 2D-S im-ages larger than 100 µm were detected (see Fig.1). One would expect to detect more of the large crystals with 2D-S than with CPI given the larger sample volume of the former (about 10 L s−1). These large crystals were at pressure levels between about
20
87 and 90 hPa, which was only about 500 m below the tropopause (see Fig.2).
Most of the 2D-S large-crystal images are out of focus and appear as donuts. The sizes reported for these images have been corrected based on diffraction theory ( Law-son et al.,2007; Korolev,2007). The lengths of the in-focus 2D-S crystals shown in Fig.1are 100 and 120 µm, and the lengths of the CPI images range from 85 to 96 µm;
25
however, the CPI crystals with dimensions ≥90 µm were sampled at a somewhat lower altitude (≃95 hPa). The uncertainty in the sizing of the CPI images is at most 5 µm. Even for the in-focus 2D-S images, the sizing uncertainty is much larger than for the CPI because the pixel size is larger and it is possible that the images are somewhat
ACPD
7, 6293–6327, 2007Formation of large crystals near the tropical tropopause E. J. Jensen et al. Title Page Abstract Introduction Conclusions References Tables Figures ◭ ◮ ◭ ◮ Back Close
Full Screen / Esc
Printer-friendly Version
Interactive Discussion
EGU out of focus without a blank spot appearing in the middle. In a worst-case scenario, the
120 µm in-focus image could be a crystal as small as about 90 µm. On the other hand, the digitization error in some cases could lose elements on both sides of the image so that we could be underestimating the size by as much as 20 µm.
The sizing uncertainty for the out-of-focus 2D-S images is more difficult to quantify.
5
Comparisons between size distributions based on only the in-focus images and only the out-of-focus images that were resized using the Korolev algorithm indicates that the algorithm is doing a reasonable job statistically, with at worst about 20% overestimate in the corrected sizes (Lawson et al.,2007). The uncertainty for individual crystals could be larger, but one would not expect it to necessarily be systematic (beyond the apparent
10
high bias of up to 20%). We do have 10 out-of-focus images here with corrected sizes greater than 100 µm and 7 with sizes ≥115 µm. We conclude from this analysis that the 2D-S images provide strong evidence for the existence of large (90–100 µm) crystals in the TTL cirrus, and it appears likely that crystals as large as 110 µm were present.
As discussed by Lawson et al.(2007), the largest CPI crystal images appear to be
15
hexagonal plates, and analysis of the images indicates that the aspect ratios are about 6:1, with the possibility of somewhat larger aspect ratios due to uncertainty resulting from blur in the CPI images (Lawson et al.,2007).
The altitude at which these large crystals are observed is surprising since they must fall as they grow by deposition of water vapor. Given the single-crystalline habits
indi-20
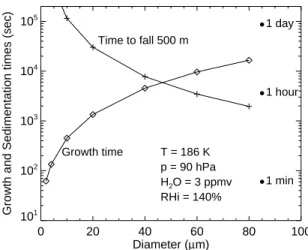
cated by the images (see Fig.1), it is implausible that these crystals are aggregates. Analysis of back trajectories from the flight path and infrared satellite imagery indicates that the air sampled had not been influenced by convection for several days. Since the residence time of these large crystals in the TTL is on the order of hours, they definitely were not produced by deep convection. Figure3shows the times to grow spherical ice
25
crystals of different sizes as well as the time to fall 500 m. We have chosen this dis-tance for the sedimentation times because some of the large crystals were no more than about 500 m below ≃18.2 km where temperature increases rapidly with height. For crystals larger than about 40–50 µm, the growth times exceed the sedimentation
ACPD
7, 6293–6327, 2007Formation of large crystals near the tropical tropopause E. J. Jensen et al. Title Page Abstract Introduction Conclusions References Tables Figures ◭ ◮ ◭ ◮ Back Close
Full Screen / Esc
Printer-friendly Version
Interactive Discussion times (for the assumed humidity and RHI of 3 ppmv and 140%, respectively). These
calculations suggest that growth of the large crystals may require large supersatura-tions.
The time and altitude averaged ice crystal size distribution for the TTL cirrus layer observed on 1 February is shown in Fig. 4. The WB-57 was porpoising in and out
5
of the narrow, patchy cloud layer. To avoid averaging clear and cloudy air, we have only included times when the 2D-S ice concentrations were greater than 0.01 L−1. The simulated size distribution shown is discussed in Sect. 5. The total ice surface area densities in the cloud are typically less than 10 µm2cm−3. The time required to quench supersaturation is much longer than the lifetime of the large crystals estimated to be
10
several hours at most based on the simulations presented below.
Water vapor was measured with multiple instruments on the WB-57 during the CRAVE flights. The Harvard water vapor instrument (HWV) photodissociates H2O
molecules with 121.6 nm (Lyman-α) radiation and detects the resulting OH photofrag-ment fluorescence at 315 nm (Weinstock et al.,1994). Accuracy and precision for HWV
15
on the 1 February flight were ±5% and 0.13 ppmv (for H2O concentrations less than
10 ppmv), respectively. The Harvard ICOS (Integrated Cavity Output Spectroscopy) instrument uses a mid-infrared quantum cascade laser at 1484 cm−1 to obtain mea-surements of H2O, as well water vapor isotopes, with an effective path length of nearly
4 km (Sayres,2006). The accuracy and precision of the ICOS instrument are 5% and
20
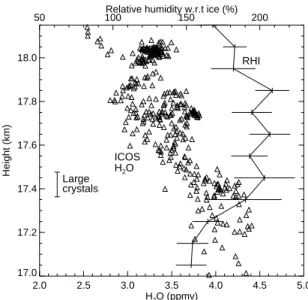
0.14 ppmv, with a potential bias of ±0.25 ppmv. Figure5shows vertical profiles of water vapor and RHI from the ICOS instrument for the time-period on 1 February when the large ice crystals were detected. (The HWV water vapor concentrations were about 0.5 ppmv higher than the ICOS values for the 1 February flight.) At altitudes above about 17.4 km where the ice crystal growth must have occurred, the ICOS
measure-25
ments indicate water vapor concentrations of about 3–4 ppmv, corresponding to RHI values around 200% given the low temperatures.
The measurements of RHI values of ≃200% within cirrus clouds should not be taken as evidence the ice crystals are in quasi-equilibrium with the large supersaturations.
ACPD
7, 6293–6327, 2007Formation of large crystals near the tropical tropopause E. J. Jensen et al. Title Page Abstract Introduction Conclusions References Tables Figures ◭ ◮ ◭ ◮ Back Close
Full Screen / Esc
Printer-friendly Version
Interactive Discussion
EGU As noted above, these are extremely tenuous cirrus clouds, and the time-scale for
quenching of supersaturation is many hours. Also, if the ice crystals were in quasi-equilibrium with the large ambient supersaturation, then the growth of the large crystals would simply not be possible.
A longstanding discrepancy between the aircraft water measurements and frostpoint
5
balloon measurements in the stratosphere (with the aircraft instrument water concen-trations considerably larger than the frostpoint values; Oltmans and Rosenlof,2000) has yet to be resolved. One of the CRAVE objectives was to make extensive com-parisons between balloon-borne frostpoint hygrometer measurements and the WB-57 water vapor measurements. Nearly every WB-57 flight ended with the aircraft
spiral-10
ing down over the airport, coordinated with frostpoint balloon sonde launches, such that they were sampling the tropopause region at approximately the same location and time. The frostpoint and aircraft water vapor measurements from the 1 February spiral are shown in Fig. 6. The discrepancy is quite large, with the HWV and ICOS instruments indicating ≃3–4 ppmv near the tropopause, and the frostpoint instrument
15
indicating 1–2 ppmv. Comparisons from other flights indicate that the frostpoint mea-surements systematically indicate that the TTL is about 1–2 ppmv drier than do the Harvard measurements.
The unresolved discrepancy between the various in situ instruments measuring wa-ter vapor in the upper troposphere and lower stratosphere presents a problem for
val-20
idation of satellite water vapor measurements. Included in Fig.6are Aura Microwave Limb Sounder (MLS) water vapor retrievals (version 1.5) within 24 h of the spiral de-scent and ±10◦latitude/longitude of the San Jose airport. The MLS H2O retrievals are in much better agreement with the frostpoint balloon measurements than with the HWV and ICOS measurements.
ACPD
7, 6293–6327, 2007Formation of large crystals near the tropical tropopause E. J. Jensen et al. Title Page Abstract Introduction Conclusions References Tables Figures ◭ ◮ ◭ ◮ Back Close
Full Screen / Esc
Printer-friendly Version
Interactive Discussion
3 Growth-sedimentation calculations
We begin by using simple growth-sedimentation calculations to investigate the forma-tion of the large crystals. Our approach is to start with the observed crystal size and location and integrate backwards in time. Thus, the crystals get smaller (due to re-verse deposition of ice) and ascend (due to rere-verse sedimentation) as the calculation
5
proceeds. We continue until the particle size goes to zero, which would be the location and time where nucleation occurred, or until the crystal ascends into the stratosphere where the temperature is high enough such that the RHI drops below 100% and the crystal begins to get larger (in reverse time). In the latter case, the crystal would indefi-nitely rise and grow in the subsaturated stratosphere, thus we argue that the calculation
10
failed to explain the existence of the crystal.
For sedimentation and growth rate calculations, we assume the crystals are ran-domly oriented plates with aspect ratios of 6:1 or larger (Lawson et al., 2007). At the Reynolds numbers for the largest crystals considered here of ≃0.1, the crystals would not be preferentially oriented (Fuchs,1964). Shape corrections for fallspeeds based
15
on oblate spheroids given byFuchs(1964) are used. These expressions indicate fall-speeds as much as 33% lower than those for equivalent-volume spheres for aspect ratios as large as 10.
Ice crystal deposition growth rates are calculated followingToon et al. (1989). For crystal sizes larger than about 10 µm at TTL temperatures and pressures, the growth
20
rate is limited by diffusion of vapor toward the crystal. We model the crystal growth of the hexagonal plates using the traditional capacitance analogy to electrostatic theory. Capacitances for the growth calculations are taken from recent numerical calculations for growth of hexagonal plates (Chiruta and Wang,2005).
Calculation of capacitance involves solving the Laplace equation for vapor density
25
around the ice crystal and vapor flux to the ice crystal with the boundary conditions of
pvap=psat at the crystal surface and pvap=pvap,∞ at a large distance from the crystal,
ACPD
7, 6293–6327, 2007Formation of large crystals near the tropical tropopause E. J. Jensen et al. Title Page Abstract Introduction Conclusions References Tables Figures ◭ ◮ ◭ ◮ Back Close
Full Screen / Esc
Printer-friendly Version
Interactive Discussion
EGU vapor pressure. These boundary conditions imply an assumption that water molecules
impinging anywhere on the crystal have equal probability of getting incorporated into the ice lattice before desorption. In the case of an extremely thin plate, growth is primarily only occurring on the prism faces, and the above assumption implies that water molecules adsorbing on the basal faces can rapidly diffuse (up to 10s of microns)
5
on the surface before they desorb. Hence, the capacitance model provides an upper limit for the linear growth rate of high aspect ratio crystals. If, in reality, water molecules did not readily diffuse across ice crystal surfaces before desorbing, the growth rate would be slower.
It is worth noting here that if growth only occurred via molecules adsorbing on the
10
prism faces, then the rate of increase of the crystal maximum dimension would be approximately the same as it would be for an equidimensional crystal. Based on the calculations presented below, growth of the large crystals would not be possible if they were equidimensional. The implication here is that water molecules must readily diffuse across the crystal surfaces.
15
In addition to using the capacitance model for calculating crystal growth rates, we make several other assumptions here that should maximize crystal growth (see Ta-ble 1). The deposition coefficient is assumed to be unity regardless of the ice super-saturation. Using a substantially lower deposition coefficient would slow crystal growth. Also,Wood et al. (2001) argued that using the capacitance model for calculations of
20
hexagonal crystals overestimates the growth rate by about 10–15%. We assume the crystal temperature is equal to the ambient temperature. In reality, the crystals could be warmer than the environment due to absorption of infrared radiation from the warm surface below. If the crystals were substantially warmer, then the equilibrium vapor pressure would be higher, thus limiting growth. We assume water vapor is not
de-25
pleted by the growing crystals. We do not impose any supersaturation threshold for nucleation of the crystals, thus maximizing the depth of the layer in which they can grow. We assume the crystals are composed of hexagonal ice instead of cubic ice. (The vapor pressure over cubic ice is about 10% higher than that over hexagonal ice;
ACPD
7, 6293–6327, 2007Formation of large crystals near the tropical tropopause E. J. Jensen et al. Title Page Abstract Introduction Conclusions References Tables Figures ◭ ◮ ◭ ◮ Back Close
Full Screen / Esc
Printer-friendly Version
Interactive Discussion
Shilling et al.,2006, thus cubic ice will grow slower than hexagonal ice.) If we did not make these assumptions, it would be more difficult to grow the large crystals, and even more water vapor would be required to grow them.
We assume a temperature profile based on the measured temperature versus alti-tude on the 1 February flight (green curve in Fig.2). For altitudes above those sampled
5
during the TTL cirrus sampling period, we use the highest cold-point tropopause (at ≃77 hPa) on the 1 February flight. We assume here that the temperature profile does not change upstream of the observation location. National Centers for Environmental Prediction (NCEP) analyses do not suggest that the tropopause was higher and colder upstream (to the west) of the flight track. The impact of gravity wave driven temperature
10
and vertical wind perturbations are addressed in Sect. 4. Simulations are run assuming vapor mixing ratios (constant in altitude) ranging from 1 to 6 ppmv. The corresponding ice relative humidities can be quite large (>200% for mixing ratios greater than about 3 ppmv).
Examples of the reverse-time growth-sedimentation calculations are shown in Fig.7.
15
For this case, we assume a 90-µm hexagonal plate and an aspect ratio of 6:1. Again, since we are tracing the observed crystal back toward its origin, deposition growth and sedimentation are reversed: the crystal rises and shrinks (while in supersaturated air) as the calculation proceeds. For this particular crystal, the calculated size shrinks to zero (the point of nucleation) before it rises into subsaturated air in the stratosphere
20
only if the water vapor mixing ratio is at least ≃2.9 ppmv. We argue that, given the assumptions made about temperature profile, vertical wind (w=0 in this case), and crystal aspect ratio = 6:1, the existence of this 90-µm crystal implies that the water vapor mixing ratio in the tropopause region must have been at least about 2.9 ppmv. The peak RHI reached in the simulation with 2.9 ppmv of H2O is about 190%.
25
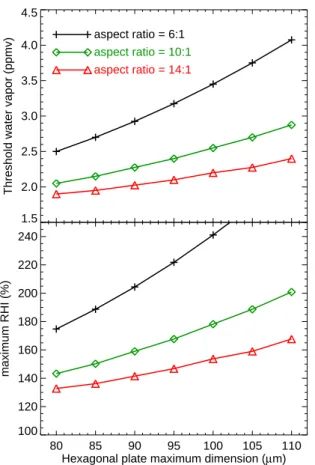
The threshold water vapor concentrations and maximum RHIs are very sensitive to the crystal aspect ratio assumed (see Fig.8). If the aspect ratios are on the low end indicated by the image analysis (≃6:1) (Lawson et al., 2007), then growth of the 90– 100 µm crystals would require TTL water vapor concentrations of about 3–3.5 ppmv
ACPD
7, 6293–6327, 2007Formation of large crystals near the tropical tropopause E. J. Jensen et al. Title Page Abstract Introduction Conclusions References Tables Figures ◭ ◮ ◭ ◮ Back Close
Full Screen / Esc
Printer-friendly Version
Interactive Discussion
EGU that are in good agreement with the ICOS measurements. Growth of a 110 µm crystal
would require more water (≃4 ppmv) than even the ICOS measurements indicated, and the corresponding maximum relative humidity would be in excess of saturation with respect to liquid water. If the aspect ratios are as large as 10:1, then the large crystals could be grown with water vapor mixing ratios somewhere between the ICOS and
5
frostpoint values (≃2.5 ppmv). On the other hand, if the aspect ratios are much larger (≥14:1), then water vapor concentrations closer to the low end of the measurement range (≃2.0–2.3 ppmv) would suffice to grow the large crystals. Note that this analysis only provides a lower limit to the water concentrations.
4 Influence of gravity waves
10
Since the size of crystals near the tropopause is limited by a competition between deposition growth and sedimentation, it seems likely that upward vertical motion could allow larger crystals to grow by lofting them in the narrow supersaturated layer. The mean upward motion in balance with radiative heating near the tropopause is very weak (≃0.3 mm s−1 (Rosenlof,1995)) and has negligible effect on the growth of large
15
crystals. However, gravity waves are commonly observed near the tropical tropopause and can drive substantial vertical motions as well as temperature perturbations (Pfister et al.,1993;Alexander and Pfister,1995;Tsuda et al.,2000).
We investigate the impact of waves on formation of the large TTL crystals by re-peating the growth-sedimentation calculations with superimposed wave-driven
tem-20
perature and vertical wind perturbations using a plausible range of wave amplitudes and frequencies. We use intrinsic periods ranging from 4 to 32 h and net vertical dis-placements up to ≃450 m. The corresponding vertical wind speed and temperature perturbations are at most about 10 cm s−1and 4 K, respectively. Even though very little convection was present near the flight track, the group velocity of the low-frequency
25
waves is inclined 80–90 degrees from the zenith; hence, they can propagate long hor-izontal distances.
ACPD
7, 6293–6327, 2007Formation of large crystals near the tropical tropopause E. J. Jensen et al. Title Page Abstract Introduction Conclusions References Tables Figures ◭ ◮ ◭ ◮ Back Close
Full Screen / Esc
Printer-friendly Version
Interactive Discussion The vertical wind and temperature perturbations are simply represented as a
sinu-soidal function of time and altitude, with temperature leading vertical velocity by one quarter cycle. For each intrinsic frequency and amplitude, we run the simulations for a range of phases between 0 and 2π. The greatest enhancement of crystal growth oc-curs when the maximum upward motion from the wave corresponds to the time when
5
the crystal is largest and is falling the fastest.
For this analysis we use a crystal with a length of 100 µm, and we assume an as-pect ratio of 8:1. Table 2 shows the results of growth-sedimentation calculations for the range of wave frequencies and amplitudes assumed. The threshold water vapor concentrations and peak relative humidities correspond to the simulation with the wave
10
phase that results in minimum threshold water vapor. The wave-driven temperature perturbations superimposed on an already cold temperature profile result in very large relative humidities. We consider relative humidity with respect to liquid water sub-stantially exceeding 100% to be non-physical because numerous water drops would rapidly activate and freeze followed by rapid depletion of vapor in excess of ice
sat-15
uration. Hence, we exclude simulations for which the wave temperature perturbation drives substantial supersaturation with respect to liquid water. For the vapor pressure with respect to liquid water, we use the expression given byClegg and Brimblecombe (1995). Given the uncertainty in the saturation vapor pressure of water at these low temperatures, we only exclude simulations for which the peak relative humidity exceeds
20
120%. At 185 K, this limit corresponds to an RHI of about 240%.
High-frequency gravity waves have little impact on the threshold water vapor con-centration. However, as discussed above, these waves do increase the maximum RHIs experienced by the crystals as they fall through the TTL. For example, superim-posing a 4-h wave with a 1.1-K temperature amplitude increases the maximum RHI
25
from 210% (with no wave) to 240%. Increasing the wave amplitude further would re-sult in relative humidities with respect to liquid water above the 120% limit discussed above. The longest period (32 h) waves considered do decrease the threshold water vapor and maximum relative humidity (i.e., to 2.8 ppmv and 181% for wave amplitudes
ACPD
7, 6293–6327, 2007Formation of large crystals near the tropical tropopause E. J. Jensen et al. Title Page Abstract Introduction Conclusions References Tables Figures ◭ ◮ ◭ ◮ Back Close
Full Screen / Esc
Printer-friendly Version
Interactive Discussion
EGU of 1.1–2.1 K). However, if we increase the wave amplitude further, then, again, we start
to get larger peak relative humidities. At optimum phase, the 32-h wave essentially represents slow ascent throughout the lifetime of the crystal. Hence, one could ar-gue that the wave-driven temperature perturbation is already included in the observed temperature profile. If we impose the 32-h wave with a 2.5 cm s−1 amplitude without
5
any temperature perturbation, then the threshold H2O and peak RHI are reduced to
2.7 ppmv and 189%, respectively.
We find that regardless of assumptions about aspect ratio and vertical wind, it would be impossible to grow the crystals as large as 90 µm if the TTL water vapor in the crystal growth region were less than 2 ppmv. Even with an assumed aspect ratio
10
of 14:1 and a constant upward motion of 2 cm s−1, at least 2 ppmv H2O is required to grow the 90-µm crystals. However, it is possible that the water vapor concentration was higher upstream and growth of the TTL cirrus ice crystals removed vapor in excess of saturation. This issue is discussed further below.
5 Implications for ice nucleation
15
The growth-sedimentation calculations in the previous sections suggest that if the crys-tals are not extremely thin plates (aspect ratios >10:1) then ice supersaturations within the TTL cirrus must be surprisingly large (RHI≥180%) to allow the ≃100 µm crystal formation. Past modeling studies (e.g.Jensen and Pfister,2004) have generally as-sumed that the primary mechanism for nucleation of ice crystals in the upper
tropo-20
sphere is homogeneous freezing of aqueous sulfate aerosols. Within this context, such large supersaturations in clouds defy expectations. Laboratory investigations of aerosol freezing indicate that ice nucleation occurs very rapidly when the RHI exceeds about 160–170% (Koop et al.,2000). An ample supply of aerosols (presumed to be aqueous sulfate) is always present in the upper troposphere, and freezing of these
25
aerosols followed by deposition of vapor on the ice crystals would prevent the su-persaturation from exceeding the RHI threshold for freezing by more than several %
ACPD
7, 6293–6327, 2007Formation of large crystals near the tropical tropopause E. J. Jensen et al. Title Page Abstract Introduction Conclusions References Tables Figures ◭ ◮ ◭ ◮ Back Close
Full Screen / Esc
Printer-friendly Version
Interactive Discussion (K ¨archer and Lohmann,2002). Modeling studies have shown that the concentration of
ice crystals produced by homogeneous freezing of aqueous aerosols is primarily con-trolled by cooling rate (Jensen and Toon, 1994;K ¨archer and Lohmann, 2002). Even with relatively slow, synoptic-scale cooling, ice concentrations should far exceed those observed in the CRAVE TTL cirrus (Jensen et al.,2005b;K ¨archer and Lohmann,2002),
5
and the deposition of water vapor on the numerous crystals would rapidly deplete the supersaturation to values well below those required to grow the large crystals.
The existence of very large ice supersaturations and the apparent discrepancy with laboratory measurements of aerosol freezing was discussed byJensen et al.(2005b). Brief measurements of RHI values exceeding 200% from WB-57 flights out of Costa
10
Rica during January 2004 were presented, and three possible explanations were dis-cussed: (1) the expressions used for calculating vapor pressure over supercooled wa-ter at low temperatures give values that are at least 20% too low, (2) organic films on the aerosol surfaces reduce their accommodation coefficient for uptake of water, re-sulting in aerosols with more concentrated solutions when moderate-rapid cooling
oc-15
curs and correspondingly inhibited homogeneous freezing, and (3) if surface freezing dominates, organic coatings may increase the surface energy of the ice embryo/vapor interface resulting in suppressed ice nucleation. The potential impact of organics on aerosol freezing was also discussed byK ¨archer and Koop(2005).
For investigation of potential scenarios permitting growth of large crystals, we use
20
detailed simulations of ice nucleation, growth, sedimentation, and exchange of wa-ter between the vapor and condensed phases to quantify the constraints on nucle-ation imposed by the existence of large crystals. Specifically, we use the Lagrangian model described byJensen and Pfister (2004) that tracks the growth and sedimenta-tion of thousands of individual ice crystals in a vertical column. For calculasedimenta-tion of water
25
vapor concentrations, we use an Eulerian vertical grid with potential temperature as the vertical coordinate. The vertical domain and grid spacing are θ=360–440 K and
d θ=0.2 K. This model was previously used to simulate TTL cirrus sampled in the
ACPD
7, 6293–6327, 2007Formation of large crystals near the tropical tropopause E. J. Jensen et al. Title Page Abstract Introduction Conclusions References Tables Figures ◭ ◮ ◭ ◮ Back Close
Full Screen / Esc
Printer-friendly Version
Interactive Discussion
EGU crystal growth rates. As in the calculations above, sedimentation is modeled assuming
the crystals are thin plates hexagonal plates (aspect ratio = 10:1). Ice crystal aggre-gation is neglected, but as discussed above, the hexagonal plate crystals observed are apparently not aggregates. The Koop et al. (2000) parameterization is used to calculate aerosol freezing ice nucleation rates as a function of water activity.
5
Following the approach previously used (Jensen et al., 2005b), we run idealized simulations with a specified cooling rate and a final profile as specified in Fig.2. We use an initial H2O mixing ratio of 3 ppmv, and we start the simulation far enough upstream such that the initial RHI is everywhere less than 100%.
We first investigate the typically assumed scenario in which ice nucleation occurs
10
due to homogeneous freezing of aqueous sulfate aerosols. The initial aerosol size distribution in the simulation is based on the mean of the size distributions measured by the Nucleation-Mode Aerosol Size Spectrometer (N-MASS) (Brock et al.,2000) and Focused Cavity Aerosol Spectrometer (FCAS) (Jonsson et al.,1995) instruments for the time period on 1 February. The results given here are not sensitive to the assumed
15
aerosol size distribution. The mass accommodation coefficient for uptake of water by the aqueous aerosols is assumed to be 0.1, such that the aerosols essentially stay in equilibrium with the environmental water vapor.
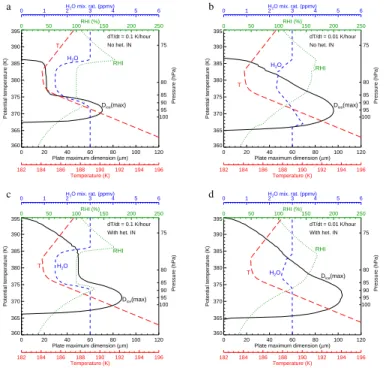
With a moderate cooling rate of 0.1 K h−1, homogeneous freezing of sulfate aerosols produces ice concentrations of ≃50–80 L−1. Growth of these ice crystals drives down
20
the RHI to near saturation (corresponding to H2O concentrations as low as about 1.5 ppmv near the temperature minimum) within the cloud, effectively limiting the growth of large crystals. The maximum crystal size in this simulation is 71 µm (see Fig.9a), which is considerably smaller than the observed crystal lengths of 90–110 µm. Assuming slower cooling rates results in fewer ice crystals nucleating and less
com-25
petition for vapor. With a very slow cooling rate of 0.01 K h−1, ice concentrations are limited to no more than about 5 L−1. Growth of these crystals limits the RHI to about 170%, but does not drive it down to ice saturation (see Fig. 9b). Water vapor con-centrations are only depleted by about 0.5 ppmv. As a result, at pressures lower than
ACPD
7, 6293–6327, 2007Formation of large crystals near the tropical tropopause E. J. Jensen et al. Title Page Abstract Introduction Conclusions References Tables Figures ◭ ◮ ◭ ◮ Back Close
Full Screen / Esc
Printer-friendly Version
Interactive Discussion 88 hPa (i.e., altitudes at or above where the large crystals were observed), the crystals
grow as large as 88 µm. This size is still less than the crystal sizes indicated by the 2D-S images.
A further assumption we can make is that the large crystals were produced by very effective heterogeneous ice nuclei (IN) active at low ice supersaturation. Given the very
5
low concentrations of large crystals in the TTL cirrus, this assumption is not unreason-able. DeMott et al. (2003) showed that low concentrations (1–10 L−1) of ice nuclei active at RHIs as low as 115% are typically present in the Northern Hemisphere mid-latitude free troposphere. Allowing a small number of ice crystals to nucleate on effec-tive ice nuclei essentially deepens the layer in which the crystals can grow. Figures9c
10
and d show the results of including 0.1 L−1 ice nuclei that activate at RHI of about 108% in simulations with cooling rates of 0.1 and 0.01 K h−1, respectively. Growth of the 0.1 L−1 ice crystals nucleated does not substantially deplete the water vapor. In the simulation with faster cooling, aerosol homogeneous freezing still occurs when the temperature gets cold enough, and the resulting depletion of vapor still limits the growth
15
of the larger crystals to ≃90 µm even though the largest crystals were heterogeneously nucleated at high altitudes. On the other hand, in the simulation with slower cooling, the crystals heterogeneously nucleated at pressures below 75 hPa grow to >100 µm by the time they sediment to 88 hPa where the large crystals were observed. In this simulation, the cloud only reduces the water vapor concentration near the temperature
20
minimum by <0.4 ppmv.
Figure 4 shows the simulated ice crystal size distribution as well as the 2D-S size distribution. We constructed the simulated size distribution by averaging vertically over the depth of the cloud and over a time period of about 18 h that includes the time when the maximum crystal was reached as well as some time after homogeneous freezing
25
nucleation has occurred. We end up with a somewhat bimodal size distribution that is in reasonable agreement with the 2D-S measurements. The largest crystals are those originally generated by heterogeneous nucleation at the top of the cloud, and the small mode consists primarily of crystals generated by homogeneous freezing.
ACPD
7, 6293–6327, 2007Formation of large crystals near the tropical tropopause E. J. Jensen et al. Title Page Abstract Introduction Conclusions References Tables Figures ◭ ◮ ◭ ◮ Back Close
Full Screen / Esc
Printer-friendly Version
Interactive Discussion
EGU Consistent with the growth-sedimentation calculations discussed above, if we start
the simulation with only 2 ppmv of water vapor, the heterogeneously nucleated ice crystals only grow to about 62 µm, and we cannot explain the larger observed crystals. In this simulation, the RHI never gets large enough for homogeneous freezing, and there is no significant depletion of vapor.
5
6 Conclusions
We have used simple growth-sedimentation calculations as well as full cloud simula-tions to investigate the formation of relatively large crystals at the tropical tropopause. We now discuss the implications of these calculations in the context of the discrep-ancies in TTL water vapor measurements amongst the various CRAVE instruments.
10
As discussed in Sect. 2, the Harvard Water Vapor and ICOS instruments indicate 3– 4 ppmv H2O concentrations in the TTL for the 1 February flight we are focusing on,
whereas the frostpoint and MLS measurements indicate <2 ppmv. The uncertainty in the hexagonal plate aspect ratios leaves a range of possibilities. If the aspect ratios are comparable to the lower limits indicated by analysis of the CPI images (≃6:1) then
15
water vapor concentrations on the high end of the measurement range (>3 ppmv) are required to grow the large crystals. On the other hand, if the aspect ratios are consider-ably larger (≥ 14:1), then water vapor concentrations (≃2–2.3 ppmv) that are closer to the lower values indicated by the frostpoint and MLS measurements would be sufficient to grow the large crystals.
20
We find that it would not be possible to grow the large crystals if the water vapor concentration in the crystal growth region were <2 ppmv. Even with aspect ratios of 15 and 2 cm s−1upward motion to loft the crystals, we still need more than 2 ppmv to grow the crystals. We cannot rule out the possibility that upstream of the location where the crystals were observed, higher water vapor mixing ratios prevailed, and the TTL
25
humidity was reduced by growth of the TTL cirrus crystals. The mean ice water content in the cirrus layer observed on 1 February was ≃0.25 ppmv, but the cloud could have
ACPD
7, 6293–6327, 2007Formation of large crystals near the tropical tropopause E. J. Jensen et al. Title Page Abstract Introduction Conclusions References Tables Figures ◭ ◮ ◭ ◮ Back Close
Full Screen / Esc
Printer-friendly Version
Interactive Discussion contained more water at an earlier time. Also, the cloud was very patchy, and the peak
ice water content was >2 ppmv. However, we are able to reproduce the observed ice size distribution in a simulation with 3 ppmv water and relatively little dehydration, and in simulations with significant dehydration, we are not able to grow the large crystals. An important caveat is that the crystals grew in a sheared, three-dimensional flow.
5
Hence, it is possible that the airmass that the crystals grew in had very different water vapor concentrations than the airmass sampled by the WB-57.
Detailed simulations of the TTL cirrus formation indicate two requirements for growth of the large crystals: (1) relatively slow cooling (≃0.01 K h−1 or less) such that large numbers of ice crystals are not generated by homogeneous freezing of aqueous
10
aerosols followed by rapid depletion of vapor in excess of saturation, and (2) a small number of very effective ice nuclei such that the crystals can nucleate at low ice super-saturation and high altitude, providing them a deep layer within which they can grow and fall. The cooling rate at the time of ice nucleation cannot be well constrained by meteorological analyses. If the cooling were indeed moderately fast, then our analysis
15
would suggest that the vast majority of aerosols present did not homogeneously freeze even at supersaturations beyond those where laboratory evidence suggests aqueous aerosols should freeze.
As discussed by Jensen and Pfister (2005), the possibility that substantial ice su-persaturation can be maintained within cold TTL cirrus has implications for our
un-20
derstanding of dehydration as air ascends through the TTL into the stratosphere. In particular, the in-cloud supersaturation would allow about 0.5–1 ppmv higher H2O
con-centrations in air entering the stratosphere than if the clouds could dehydrate air down to ice saturation. If the threshold for ice nucleation on TTL aerosols is indeed higher than is generally assumed in modeling studies (as the water vapor concentrations on
25
the high end of the CRAVE measurements would suggest), the result will be that air parcel trajectories with very high peak supersaturation can pass through the TTL with-out dehydration. This scenario contrasts sharply with the general assumption made in trajectory modeling studies that all vapor in excess of ice saturation gets removed as
ACPD
7, 6293–6327, 2007Formation of large crystals near the tropical tropopause E. J. Jensen et al. Title Page Abstract Introduction Conclusions References Tables Figures ◭ ◮ ◭ ◮ Back Close
Full Screen / Esc
Printer-friendly Version
Interactive Discussion
EGU air passes through the cold tropopause region. Hence, a better understanding of the
cloud processes is required to develop a quantitative relationship between tropopause temperatures and the concentration of water vapor in air entering the stratosphere.
Acknowledgements. This work was supported by NASA’s Radiation Science Program and the
Aura Validation Program. We are grateful for helpful discussions with D. Murphy and R.-S. Gao. 5
We also thank B. Read for providing the MLS water vapor data.
References
Alexander, M. and Pfister, L.: Gravity wave momentum flux in the lower stratosphere over convection, Geophys. Res Lett., 22, 2029–2032, 1995. 6305
Baumgardner, D., Jonsson, H., Dawson, W., Connor, D. O., and Newton, R.: The cloud, aerosol 10
and precipitation spectrometer (CAPS): A new instrument for cloud investigations, Atmos. Res., 59, 59–60, 2001. 6297
Brock, C. A., Schr ¨oder, F., K ¨archer, B., Petzold, A., Busen, R., and Fiebig, M.: Ultrafine parti-cle size distributions measured in aircraft exhaust plumes, J. Geophys. Res., 105, 26 555– 26 567, 2000.6309
15
Chiruta, M. and Wang, P. K.: The capacitance of solid and hollow hexagonal ice columns, Geophys. Res. Lett., 32, L05803, doi:10.1029/2004GL021771, 2005.6302
Clegg, S. L. and Brimblecombe, P.: Application of a multicomponent thermodynamic model to activities and thermal properties of 0–40 mol kg−1aqueous sulfuric acid from <200 to 328 K, J. Chem. Eng. Data, 40, 43–64, 1995. 6306
20
Comstock, J. M., Ackerman, T. P., and Mace, G. G.: Ground based remote sensing of tropical cirrus clouds at Nauru Island: Cloud statistics and radiative impacts, J. Geophys. Res., 107, 4714, doi:10.1029/2002JD002203, 2002. 6295
DeMott, P. J., Cziczo, D. J., Prenni, A. J., Murphy, D. M., Kreidenweis, S. M., Thomson, D. S., and Borys, R.: Measurements of the concentration and composition of nuclei for cirrus for-25
mation, Proc. National Acad. Sci., 100, 14 655–14 660, 2003. 6310
Dvorstov, V. L. and Solomon, S.: Response of the stratospheric temperatures and ozone to past and future increases in stratospheric humidity, J. Geophys. Res., 106, 7505–7514, 2001.
ACPD
7, 6293–6327, 2007Formation of large crystals near the tropical tropopause E. J. Jensen et al. Title Page Abstract Introduction Conclusions References Tables Figures ◭ ◮ ◭ ◮ Back Close
Full Screen / Esc
Printer-friendly Version
Interactive Discussion
Fuchs, N. A.: The mechanics of aerosols, General Publishing Company, 1964.6302
Fueglistaler, S., Bonazzola, M., Haynes, P. H., and Peter, T.: Stratospheric water vapor pre-dicted from the Lagrangian temperature history of air entering the stratosphere in the tropics, J. Geophys. Res., 110, D08107, doi:10.1029/2004JD005516, 2005.6295
Gettelman, A., Randel, W. J., Wu, F., and Massie, S. T.: Transport of water vapor in the tropical 5
tropopause layer, Geophys. Res. Lett., 29, D10, doi:10.1029/2001GL013818, 2002. 6295
Heymsfield, A. J.: Ice particles observed in a cirroform cloud at –85◦C and implications for polar stratospheric clouds, J. Atmos. Sci., 43, 851–855, 1986.6297
Holton, J. and Gettelman, A.: Horizontal transport and dehydration of the stratosphere, Geo-phys. Res. Lett., 28, 2799–2802, 2001.6295
10
Jensen, E. J. and Pfister, L.: Transport and freeze-drying in the tropical tropopause layer, J. Geophys. Res., 109, D02207, doi:10.1029/2003JD004022, 2004. 6295,6307,6308
Jensen, E. J. and Pfister, L.: Implications of Persistent Ice Supersaturation in Cold Cirrus for Stratospheric Water Vapor, Geophys. Res. Lett., 32, L01808, doi:10.1029/2004GL021125, 2005. 6312
15
Jensen, E. J. and Toon, O. B.: Ice nucleation in the upper troposphere: Sensitivity to aerosol number density, temperature, and cooling rate, Geophys. Res. Lett., 21, 2019–2022, 1994.
6308
Jensen, E. J., Toon, O. B., Pfister, L., and Selkirk, H. B.: Dehydration of the upper troposphere and lower stratosphere by subvisible cirrus clouds near the tropical tropopause, Geophys. 20
Res. Lett., 23, 825–828, 1996. 6295
Jensen, E. J., Pfister, L., Bui, T.-P., Weinheimer, A., Weinstock, E., Smith, J., Pittmann, J., Baumgardner, D., and McGill, M. J.: Formation of a Tropopause Cirrus Layer Observed over Florida during CRYSTAL-FACE, J. Geophys. Res., 110, D03208, doi:10.1029/2004JD004671, 2005a.6308
25
Jensen, E. J., Smith, J. B., Pfister, L., Pitman, J. V., Weinstock, E. M., Sayres, D. S., Herman, R. L., Troy, R. F., Rosenlof, K., Thompson, T. L., Fridlind, A. M., Hudson, P. K., Cziczo, D. J., Heymsfield, A. J., Schmitt, C., and Wilson, J. C.: Ice supersaturations exceeding 100% at the cold tropical tropopause: implications for cirrus formation and dehydration, Atmos. Chem. Phys., 5, 851–862, 2005b.6308,6309
30
Jonsson, H. H., Wilson, J. C., Brock, C. A., Knollenberg, R. G., Newton, R., Dye, J. E., Baum-gardner, D., Borrmann, S., Ferry, G. V., Pueschel, R., Woods, D. C., and Pitts, M. C.: Per-formance of a focused cavity aerosol spectrometer for measurements in the stratosphere of
ACPD
7, 6293–6327, 2007Formation of large crystals near the tropical tropopause E. J. Jensen et al. Title Page Abstract Introduction Conclusions References Tables Figures ◭ ◮ ◭ ◮ Back Close
Full Screen / Esc
Printer-friendly Version
Interactive Discussion
EGU
particle size in the 0.06–2.0 µm diameter range, J. Technol., 12, 115–129, 1995. 6309
K ¨archer, B. and Koop, T.: The role of organic aerosols in homogeneous ice formation, Atmos. Chem. Phys., 5, 703–714, 2005,
http://www.atmos-chem-phys.net/5/703/2005/. 6308
K ¨archer, B. and Lohmann, U.: A parameterization of cirrus cloud formation: Homogeneous 5
freezing of supercooled aerosols, J. Geophys. Res., 107, 4010, doi:10.1029/2001JD000470, 2002. 6308
Koop, T., Luo, B., Tsias, A., and Peter, T.: Water activity as the determinant for homogeneous ice nucleation in aqueous solutions, Nature, 406, 611–614, 2000.6307,6309
Korolev, A.: Reconstruction of the sizes of spherical particles from their shadow images. Part I: 10
Theoretical considerations, J. Atmos. Ocean. Technol., 24, 376–389, 2007. 6298
Lawson, R. P., Baker, B. A., Schmitt, C. G., and Jensen, T. L.: An overview of microphysical properties of Arctic clouds observed in May and July during FIRE ACE, J. Geophys. Res., 106, 14 989–15 014, 2001. 6297
Lawson, R. P., O’Connor, D., Zmarzly, P., Weaver, K., Baker, B. A., Mo, Q., and Jonsson, 15
H.: The 2D-S (Stereo) probe: Design and preliminary tests of a new airborne, high-speed, high-resolution imaging probe, J. Atmos. Ocean. Technol., 23, 1462–1477, 2006. 6297
Lawson, R. P., Baker, B. P. B. A., Mo, Q., Baumgardner, D., and Jensen, E. J.: Micropysical properties of subvisible cirrus clouds, Atmos. Chem. Phys. Discuss., 7, 6255–6292, 2007,
http://www.atmos-chem-phys-discuss.net/7/6255/2007/. 6296,6297,6298,6299
20
McFarquhar, G. M., Heymsfield, A. J., Spinhirne, J., and Hart, B.: Thin and subvisual tropopause cirrus: Observations and radiative impacts, J. Atmos. Sci., 57, 1841–1853, 2000.
6297
Oltmans, S. J. and Rosenlof, K. H.: Data Quality, in: SPARC Assessment of Upper Tropospheric and Stratospheric Water Vapour, edited by: Kley, D., Russell, J. M., and Phillips, C., World 25
Climate Research Program, 2000.6301
Peter, T., Luo, B. P., Wenrli, H., Wirth, M., Kiemle, C., Flentje, H., Yushkov, V. A., Khattatov, V., Rudakov, V., asd S. Boormann, A. T., Toci, G., Mazzinghi, P., Beuermann, J., Schiler, C., Cairo, F., Don-francesco, G. D., Adriani, A., Volk, C. M., Strom, J., Noone, K., Mitev, V., MacKenzie, R. A., Carslaw, K. S., Trautmann, T., Santacesaria, V., and Stefanutti, L.: 30
Ultrathin Tropical Tropopause Clouds (UTTCs): I. Cloud morphology and occurrence, Atmos. Chem. Phys., 3, 1557–1578, 2003,
ACPD
7, 6293–6327, 2007Formation of large crystals near the tropical tropopause E. J. Jensen et al. Title Page Abstract Introduction Conclusions References Tables Figures ◭ ◮ ◭ ◮ Back Close
Full Screen / Esc
Printer-friendly Version
Interactive Discussion
Pfister, L., Chan, K. R., Bui, T. P., Bowen, S., Legg, M., Gary, B., Kelly, K., Proffitt, M., and Starr, W.: Gravity waves generated by a tropical cyclone during the STEP tropical field program: a case study, J. Geophys. Res., 98, 8611–8638, 1993. 6305
Rosenlof, K. H.: Seasonal cycle of the residual mean meridional circulation in the stratosphere, J. Geophys. Res., 100, 5173–5191, 1995. 6305
5
Sayres, D. S.: New techniques for accurate measurement of water and water isotopes, Ph. D. Thesis, Harvard University, Cambridge, MA, 2006. 6300
Shilling, J. E., Tolbert, M. A., Toon, O. B., Jensen, E. J., Murray, B. J., and Bertram, A. K.: Measurements of the vapor pressure of cubic ice and their implications for atmospheric ice clouds, Geophys. Res. Lett., 33, L17801, doi:10.1029/2006GL026671, 2006.6304
10
Solomon, S., Garcia, R. R., Rowland, F. S., and Wuebbles, D. J.: On the depletion of Antarctic ozone, Nature, 321, 755–758, 1986.6295
Toon, O. B., Turco, R. P., Jordan, J., Goodman, J., and Ferry, G.: Physical processes in polar stratospheric ice clouds, J. Geophys. Res., 94, 11 359–11 380, 1989. 6295,6302
Tsuda, T., Nishida, M., and Rocken, C.: A global morphology of gravity wave activity in the 15
stratosphere revealed by the gps occultation data (gps/met), J. Geophys. Res., 105, 7257– 7274, 2000. 6305
Weinstock, E. M., Hintsa, E. J., Dessler, A. E., Oliver, J. F., Hazen, N. L., Demusz, J. N., Allen, N. T., Lapson, L. B., and Anderson, J. G.: New fast response photofragment fluorescence hygrometer for use on the NASA ER-2 and the Perseus remotely piloted aircraft, Rev. Sci. 20
Instrum., 22, 3544–3554, 1994. 6300
Wood, S. E., Baker, M. B., and Calhoun, D.: New model for the vapor growth of hexagonal crystals in the atmosphere, J. Geophys. Res., 106, 4845–4870, 2001. 6303
ACPD
7, 6293–6327, 2007Formation of large crystals near the tropical tropopause E. J. Jensen et al. Title Page Abstract Introduction Conclusions References Tables Figures ◭ ◮ ◭ ◮ Back Close
Full Screen / Esc
Printer-friendly Version
Interactive Discussion
EGU
Table 1. Factors controlling crystal growth rates. In each case, assumptions were made that
minimize the water vapor concentration required to grow the large crystals.
Issue Assumption Impact on crystal growth Deposition coefficient Unity Fastest possible growth
Nucleation threshold RHI≃100% Deepest possible supersaturated layer Crystal temperature Tice=Tamb Fastest growth
Ice phase (cubic/hexagonal) Hexagonal Fastest growth
Crystal habit Thin plate Minimum volume, slow sedimentation Crystal growth shape effect Capacitance model Fastest growth
ACPD
7, 6293–6327, 2007Formation of large crystals near the tropical tropopause E. J. Jensen et al. Title Page Abstract Introduction Conclusions References Tables Figures ◭ ◮ ◭ ◮ Back Close
Full Screen / Esc
Printer-friendly Version
Interactive Discussion
Table 2. Results from growth-sedimentation simulations with gravity waves (crystal length =
100 µm, aspect ratio = 8:1).
Intrinsic period Vertical wind Temperature Maximum vertical Minimum H2O Maximum (hours) amplitude (cm s−1) amplitudea(K) displacement (m) thresh (ppmv) RHI (%)b
no wave n/a n/a n/a 3.0 210
4 2.5 0.6 60 3.0 212 4 5 1.1 110 3.0 240 8 1.25 0.6 60 3.0 228 8 2.5 1.1 110 3.1 197 16 1.25 1.1 110 3.0 192 16 2.5 2.1 220 3.0 241 32 0.625 1.1 110 2.8 192 32 1.25 2.1 220 2.9 181 32 2.5 4.2 450 3.4 222 32 2.5 0 450 2.7 189 a
The temperature perturbation experienced by the cloud particle. bThe maximum RHI encoun-tered in the simulation with the ideal wave phase.
ACPD
7, 6293–6327, 2007Formation of large crystals near the tropical tropopause E. J. Jensen et al. Title Page Abstract Introduction Conclusions References Tables Figures ◭ ◮ ◭ ◮ Back Close
Full Screen / Esc
Printer-friendly Version Interactive Discussion EGU m m m m m m 100 µ 120 µ
Out−of−focus images with sizes corrected using diffraction theory [Korolev, 2007]
m m m m m m m m m 120 µm 132 µ 87 µ 85 µ 90 µ 96 µ In−focus images 103 µ 103 µ 115 µ 115 µ 118 µ 119 µ 119 µ 103 µ
Fig. 1. In-focus CPI images of crystals with maximum dimensions of at least 85 µm and
2D-S images of crystals larger than 100 µm (top) sampled in the TTL cirrus on 1 February are shown. Out-of-focus 2D-S images of large crystals are shown below. The size of these images is corrected using an algorithm based on diffraction theory (see text for details).
ACPD
7, 6293–6327, 2007Formation of large crystals near the tropical tropopause E. J. Jensen et al. Title Page Abstract Introduction Conclusions References Tables Figures ◭ ◮ ◭ ◮ Back Close
Full Screen / Esc
Printer-friendly Version Interactive Discussion 184 185 186 187 188 189 190 Temperature (K) 75 80 85 90 95 Pressure (hPa) 1 Feb. 2006 17.0 17.5 18.0 Height (km) 2D−S crystals larger than 70 microns
Fig. 2. Temperature versus pressure is shown for the time period when the WB-57 was
por-poising through thin cirrus in the tropopause region on 1 February. Red circles indicate the locations where the 2D-S recorded images of crystals with lengths larger than 70 µm. The green curve indicates the temperature profile used in growth-sedimentation calculations de-scribed below.
ACPD
7, 6293–6327, 2007Formation of large crystals near the tropical tropopause E. J. Jensen et al. Title Page Abstract Introduction Conclusions References Tables Figures ◭ ◮ ◭ ◮ Back Close
Full Screen / Esc
Printer-friendly Version Interactive Discussion EGU 0 20 40 60 80 100 Diameter (µm) 101 102 103 104 105
Growth and Sedimentation times (sec)
Growth time Time to fall 500 m 1 min 1 hour 1 day T = 186 K p = 90 hPa H2O = 3 ppmv RHi = 140%
Fig. 3. Crystal growth time and the time to fall 500 m are plotted versus crystal diameter
(as-suming spheres). (See Sect. 3 for details of growth and sedimentation calculations.) With the assumed temperature (186 K), pressure (90 hPa), and water vapor concentration (3 ppmv), the relative humidity with respect to ice is ≃140%, and the growth time exceeds the sedimentation time for crystals larger than about 40–50 µm. With higher water vapor concentrations (and larger supersaturations) the growth times will be shorter, allowing growth of larger crystals.
ACPD
7, 6293–6327, 2007Formation of large crystals near the tropical tropopause E. J. Jensen et al. Title Page Abstract Introduction Conclusions References Tables Figures ◭ ◮ ◭ ◮ Back Close
Full Screen / Esc
Printer-friendly Version Interactive Discussion 10 100 D (µm) 10-8 10-7 10-6 10-5 10-4 10-3 10-2 dN/dlogD (cm -3) 2D-S simulation 01 February
Fig. 4. Ice crystal size distribution (solid histogram) from the 2D-S measurements made during
the TTL sampling time period. Also shown is a size distribution from our simulation of the TTL cirrus formation assuming a TTL water vapor concentration of 3 ppmv (see Sect. 5).
ACPD
7, 6293–6327, 2007Formation of large crystals near the tropical tropopause E. J. Jensen et al. Title Page Abstract Introduction Conclusions References Tables Figures ◭ ◮ ◭ ◮ Back Close
Full Screen / Esc
Printer-friendly Version Interactive Discussion EGU 2.0 2.5 3.0 3.5 4.0 4.5 5.0 H2O (ppmv) 17.0 17.2 17.4 17.6 17.8 18.0 Height (km) Large crystals RHI ICOS H2O
50 100Relative humidity w.r.t ice (%)150 200
Fig. 5. Vertical profiles of WB-57 ICOS water vapor measurements (open triangles) made
during the time period when the large ice crystals were detected. Corresponding relative hu-midities with respect to ice (using MMS temperature) are also shown (lines). The horizontal bars are one standard deviation. The precisions of the ICOS measurements is 0.14 ppmv; hence, the variability in water vapor concentrations is almost entirely geophysical.
ACPD
7, 6293–6327, 2007Formation of large crystals near the tropical tropopause E. J. Jensen et al. Title Page Abstract Introduction Conclusions References Tables Figures ◭ ◮ ◭ ◮ Back Close
Full Screen / Esc
Printer-friendly Version
Interactive Discussion 1 February 2006 final descent
1 2 3 4 5 6 H2O (ppmv) 100 Pressure (hPa) 70 80 90 NOAA Frostpoint MLS MLS Harvard Lyman-α ICOS
Fig. 6. Water vapor measurements from the WB-57 Harvard water vapor instrument (black
solid) and ICOS (green with + symbols) made during a spiral descent over San Jose are com-pared with the coordinated frostpoint balloon measurements (red dashed). The measurements differ by 1–2 ppmv, with the frostpoint instrument indicating much lower water concentrations than the HWV and ICOS in the tropopause region. Also shown are the MLS water vapor re-trievals within ±1 day and ±10◦
latitude/longitude of the spiral. The MLS values are in good agreement with the frostpoint sonde measurements.
ACPD
7, 6293–6327, 2007Formation of large crystals near the tropical tropopause E. J. Jensen et al. Title Page Abstract Introduction Conclusions References Tables Figures ◭ ◮ ◭ ◮ Back Close
Full Screen / Esc
Printer-friendly Version Interactive Discussion EGU 1 Feb. 2006 H2O(min) = 2.9 90 80 70 60 Pressure (hPa) H2O (ppmv) 2.0 2.1 2.2 2.3 2.4 2.5 2.6 2.7 2.8 2.9 3.0 90 µm hexagonal plate Aspect ratio = 6:1 183 184 185 186 187 188 Temperature (K) 100 150 200 250 RHi (%) 0 -1 -2 -3 -4 -5 -6 -7 Time (hours) 0 20 40 60 80 100
Plate max. dimension (
µ
m)
2 ppmv H2O
3 ppmv
2.9 ppmv
Fig. 7. Calculated history of pressure, temperature, ice relative humidity, and crystal maximum
dimension (length of basal face) for a 90-µm plate with an assumed aspect ratio of 6:1. We are tracing the crystal evolution back in time; as a result, the crystals ascend (due to sedimentation) and shrink (due to deposition growth in supersaturated air) as the calculation proceeds. The colors indicate the water vapor mixing ratio assumed. Only if the water vapor concentration is at least 2.9 ppmv (dashed curves) does the crystal diameter shrink to zero before the particle reaches subsaturated air in the stratosphere.