'" 'V.ER ENGINEERING LIPR? t-'
"MAR
16 1988
A 1 IR-8A 1 GoAn Acoustic-Phonetic Approach to
Speech Recognition:
Application to the Semivowels
RLE
Technical Report No. 531
June 1987
Carol Yvonne Espy-Wilson
Research Laboratory of Electronics Massachusetts Institute of Technology
Cambridge, MA 02139 USA TK7855 .M41 .R43 o I .. it ,,-1 W C"'
AN ACOUSTIC-PHONETIC APPROACH TO SPEECH RECOGNITION: APPLICATION TO THE SEMIVOWELS
by
Carol Yvonne Espy-Wilson B.S., Stanford University
(1979)
S.M., Massachusetts Institute (1981) E.E., Massachusetts Institute
(1983)
of Technology
of Technology
SUBMITTED IN PARTIAL FULFILLMENT OF THE REQUIREMENTS FOR THE
DEGREE OF
DOCTOR OF PHILOSOPHY at the
MASSACHUSETTS INSTITUTE OF TECHNOLOGY May 22, 1987
Carol Yvonne Espy-Wilson
The author hereby grants to MIT permission to reproduce and to distribute copies of this thesis document in whole or in part.
Signature of Author - - 1 ...
Certified by
Accepted by
Department of Electrical ineer g and Computer Science
Kenneth N. Stevens Thesis Supervisor
Arthur C. Smith Chairman, Departmental Comnmittee on Graduate Students
. .
- ran s s
"'4-e 0
Of
AN ACOUSTIC-PHONETIC APPROACH TO SPEECH RECOGNITION: APPLICATION TO THE SEMIVOWELS
by
Carol Yvonne Espy-Wilson
Submitted to the Department of Electrical Engineering and Computer Science on May 22, 1987 in partial fulfillment of the requirements for the degree of Doctor of Philosophy.
ABSTRACT
A framework for an acoustic-phonetic approach to speech recognition was devel-oped. The framework consists of: 1) specifying the features needed to recognize the sounds or class of sounds of interests; 2) mapping the features into acoustic properties based on relative measures so that they are relatively insensitive to interspeaker and intraspeaker differences; 3) developing algorithms to extract automatically and reliably the acoustic properties; and 4) combining the acoustic properties for recognition.
The framework was used in the development of a recognition system for the class of English sounds known as the semivowels /w,y,r,l/. Fairly consistent recognition results were obtained across the corpora used to develop and evaluate the semivowel recognition system. The corpora contain semivowels which occur within a variety of phonetic environments in polysyllabic words and sentences. The utterances were spoken by males and females who covered eight dialects. Based on overall recognition rates, the system is able to distinguish between the acoustically similar semivowels /w/ and /1/ at a rate better than chance. Recognition rates for /w/ range from 21% (intervocalic context) to 80% (word-initial context). For /1/, recognition rates range from 25% (prevocalic context following an unvoiced consonant) to 97% (sonorant-final context). However, if lumped into one category, overall recognition rates for these semivowels range from 87% to 95%. Consistent overall recognition rates around 90% were obtained for /r/ and overall recognition rates in the range 78.5% to 93.7% were obtained for /y/.
Several issues were brought forth by this research. First, an acoustic study re-vealed several instances of feature assimilation and it was determined that some of the domains over which feature spreading occurred support the theory of syllable struc-ture. Second, an analysis of the sounds misclassified as semivowels showed that, due to contextual influences, the misclassified vowels and and consonants had patterns of features similar to those of the assigned semivowels. This result suggests that the proper representation of lexical items may be in terms of matrices of binary features as opposed to, or in addition to, phonetic labels. Finally, the system's recognition of semivowels which are in the underlying transcription of the utterances, but were not included in the hand transcription, raises the issue of whether hand-transcribed data should be used to evaluate recognition systems. In fact, it appears as if insights into
how speech is produced can also be learned from such "errors." Thesis Supervisor: Kenneth N. Stevens
DEDICATION
Acknowledgements
Attempting to thank all of those who, second to God, helped me along the way is impossible, for the list is far too long. For those who are left out, I thank you first for all the assistance you gave.
I extend my deepest gratitude to Ken Stevens, my thesis advisor, who has played an enormously helpful role in this endeavor. His guidance and ability to get at the basic and fundamental issues, tempered with his compassion, has made this research uniquely rewarding and pleasurable. I will always be grateful to Ken for his academic and personal concern, especially during the early years of my doctoral studies.
I also thank my readers John Makhoul, Joe Perkell, Stephanie Seneff and Victor Zue. Their enthusiasm towards this research was very encouraging, and their insights, guidance and critiques of versions of this thesis are most appreciated.
Many thanks to the Xerox Corporation, Dr. Herb James in particular, for financial support; and to DARPA for use of the facilities that they provided.
Thanks to NL, SM, MR and SS for serving as subjects.
To past and present members of the Speech Communication Group who provided an intellectually stimulating and pleasant environment, I say thank you. Among this group are several persons whom I specially thank for the many discussions in which we sought to understand some difficult issues. They include Corine Bickley and Stephanie Shattuck-Huffnagel. Along this line, there are others who carefully read parts of this work and offered several helpful suggestions. They include Abeer Alwan, Caroline Huang, Hong Leung, Mark Randolph and John Pitrelli. To them, I extend my grati-tude.
In addition, I thank Victor Zue for providing the LISP machines and I thank all of those who have developed the software tools which make this facility an excellent research environment. Finally, for their assistance with these and other tools, I thank Scott Cyphers, Rob Kassel, Niels Lauritzen, Keith North and Mark Randolph.
I am profoundly grateful to several special friends for their support. I will not list them all. However, I must acknowledge Oliver Ibe, John Turner (Dean of the Graduate School at MIT) and Karl Wyatt who were of tremendous help during some critical times; and Austin and Michelle Harton who always had time to listen and care.
My mother and three brothers have always been a source of strength. I cannot find words which adequately express my gratitude to them for their belief in me and their unyielding support.
Finally, I thank my husband, John. His patience, encouragement and counsel were boundless. To him, I am deeply indebted. As John once said of me, he is, very simply, love.
Biographical Note
Carol Yvonne Espy-Wilson was born in Atlanta, Georgia, on April 23, 1957. She received her B.S. in Electrical Engineering in 1979 from Stanford University. Upon leaving Stanford, she came to MIT where she received her M.S. in Electrical Engi-neering and Computer Science in 1981. The Master's thesis is titled "The Effects of Additive Noise in Signal Reconstruction from Fourier Transform Phase." Realizing she had long since fulfilled the requirements for an E.E. degree, she applied and received it in 1984. In the fall of 1981, she became a member of the Speech Communication Group under the guidance of Dr. Kenneth Stevens. Carol has had several opportu-nities to present her work at conferences and she is a member of Sigma Xi and other professional societies.
Contents
Abstract Dedication
Acknowledgements Biographical Note
1 Introduction and Literature Review
1.1 Introduction . 1.2 Literature Review ... 1.2.1 Phonetically-Based Approach . . 1.2.2 Mathematically-Based Methods . 1.2.3 Combined Methods . 1.3 Thesis Scope ... 17 ... 17 ... 19 ... 20 ... 22 ... 24 ... 25
2 Data Bases and Tools 2.1 Data Bases ... 2.2 Tools... 2.2.1 SPIRE . . . . 2.2.2 SEARCH ... 2.2.3 Knowledge-Based Formant Tracker . 28 ... 28 ... 30 ... 30 ... 35 ... 35 3 Properties of Semivowels 3.1 Introduction . 3.2 Acoustic Study ... 3.2.1 Formant Frequencies 3.2.2 Formant Transitions 46 46 50 51 62 2 3 4 6 . . . . . . . . . . . . . . . . . . . . ... ... ... ... . .. . . .
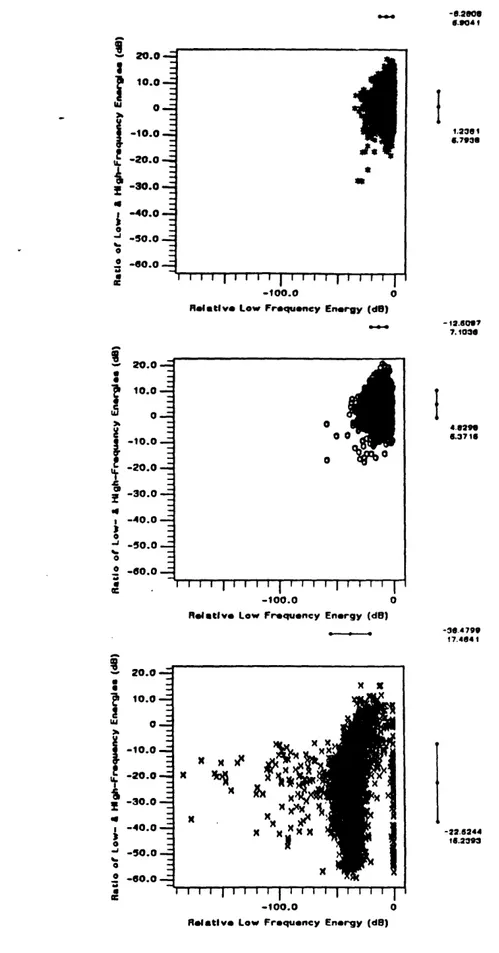
3.2.3 Relative Low-Frequency Energy Measures .. 3.2.4 Mid-Frequency Energy Change.
3.2.5 Rate of Spectral Change ... 3.2.6 Dip Region Duration ... 3.3 Discussion ...
4 Recognition System
4.1 Feature Specification . . . . 4.2 Acoustic Correlates of Features ...
4.2.1 Mapping of Features into Acoustic Properties 4.2.2 Quantification of Propertie 4.3 Control Strategy . . 4.3.1 Detection . . 4.3.2 Classification 4.3.3 Summary . . 5 Recognition Results 5.1 Introduction .
5.2 Method of Tabulation of Results . 5.3 Effects of Phonetic Variability ... 5.4 Parameter Evaluation.
5.5 Semivowel Recognition Results ... 5.6 Consonants called Semivowels ... 5.7 Vowels called Semivowels.
5.8 A Comparison with Previous Work . . . 5.8.1 LLAPFE.
5.8.2 MEDRESS Recognition System .
6 Summary and Discussion
6.1 Summary. 6.2 Discussion ... 6.3 Future Work ... References ... .73 ... .78 ... .97 ... 103 ... 108.. 118 ... 118.. ... 121.. ... 121.. ... 122.. ... 126.. ... 126.. ... 135.. ... 148.. 149 . ... .149 ... 150 ... . . 152 . ... .156 . ... .164 . ... .179 ... 182 ... 187 ... 189 ... 193' 195 .195 . 196 . 200 203 208 A Corpus of Polysyllabic Words
8 s . . . . ... . . . .. . . . .. . . . . . . . . . . . . . . . . . . . . . .^ ... ... ...
List of Figures
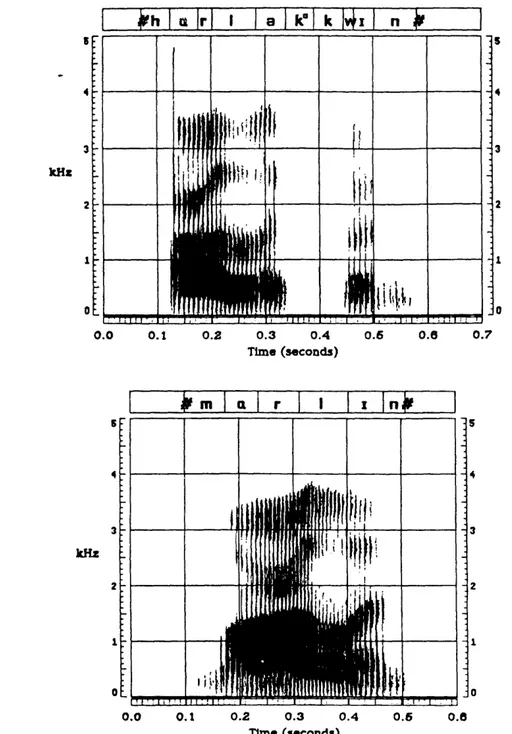
2.1 A comparison of the words "harlequin" and marlin.. ... 32
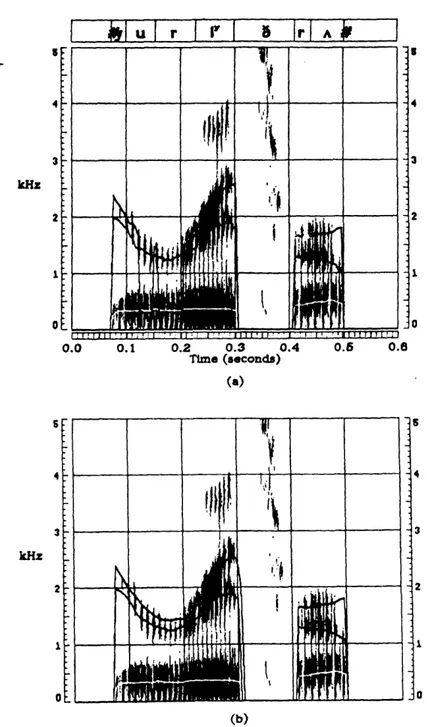
2.2 Spectrogram of the word "everyday." ... . 33
2.3 Two spectrograms of the word "queen." ... 34
2.4 Block diagram of formant tracking strategy within a voiced sonorant region ... 37
2.5 An illustration of the performance of the post processing stage in the tracking of the word "exclaim." ... 40
2.6 An illustration of the performance of the post processing stage in the tracking of the word "plurality." ... 41
2.7 An illustration of the performance of the interpolation algorithm... 43
2.8 An illustration of the performance of the interpolation algorithm .... 44
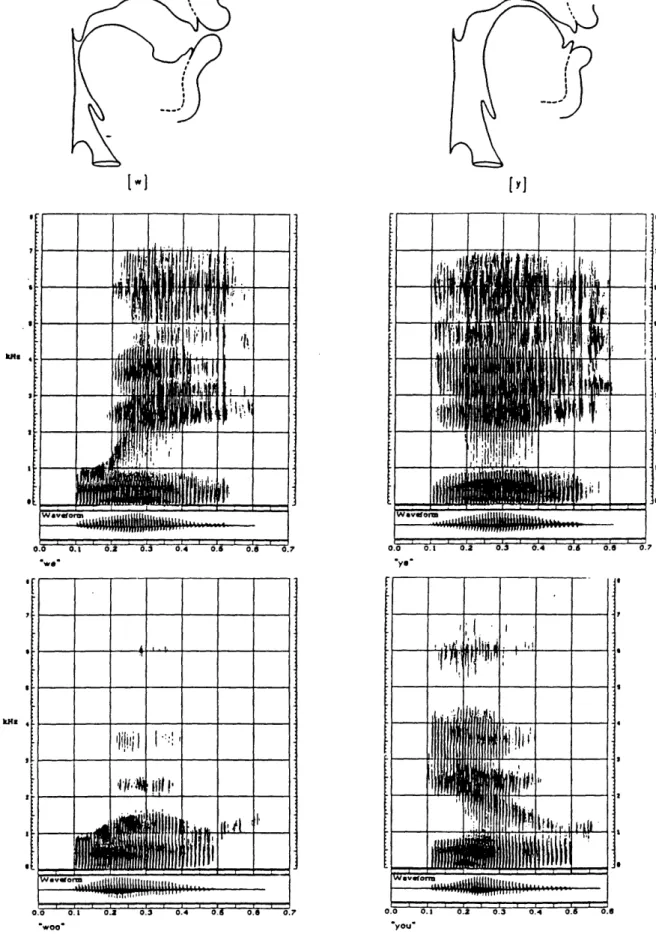
3.1 X-ray tracings of the vocal tract and wide band spectrograms of the words "we," "ye," woo" and you." ... . 47
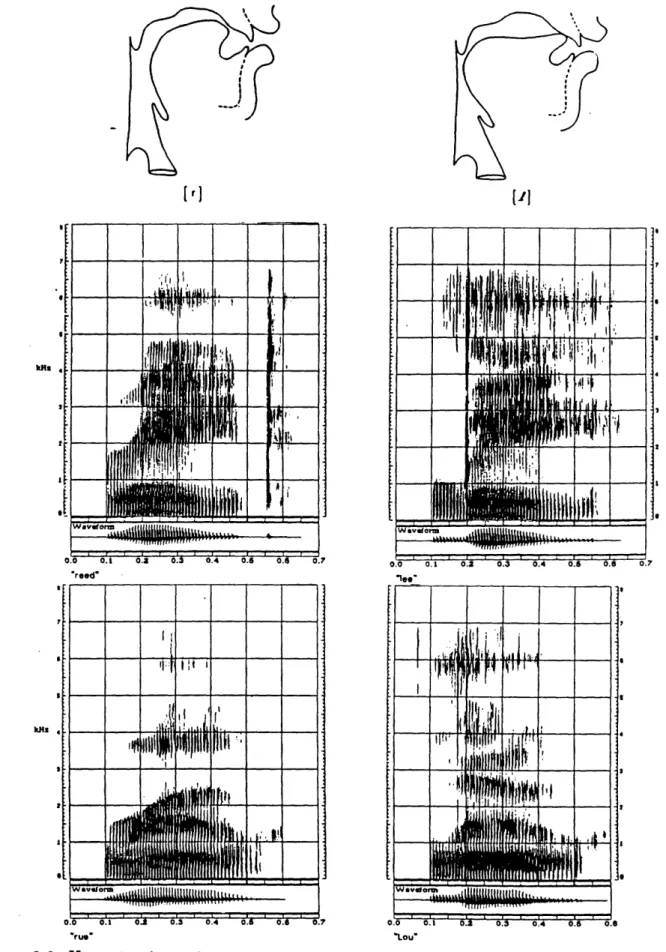
-3.2 X-ray tracings- of the vocal tract and wide band spectrograms of the words "reed," "lee," "rue," and "Lou." ... 48
3.3 Plots of normalized formant values for prevocalic semivowels ... 57
3.4 Plots of normalized formant values for intervocalic semivowels. ... 58
3.5 Plots of normalized formant values for postvocalic semivowels ... 59
3.6 Wide band spectrogram of the words "loathly" and squall. ... . 61
3.7 Wide band spectrogram of the words rule" and explore." ... 63
3.8 An illustration of F3 movement between /w/ and nearby retroflexed sounds in"thwart" and "froward." . . . 66
3.9 Wide band spectrograms of the words poilu" and roulette." ... 68
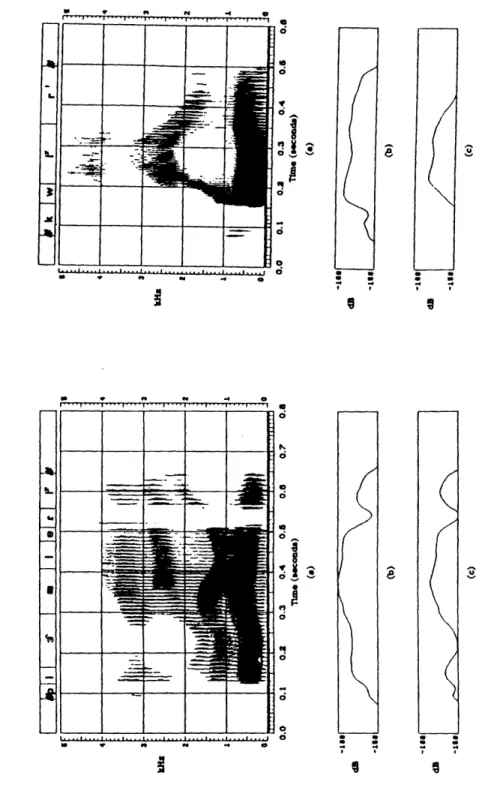
3.10 Wide band spectrograms of the words "leapfrog" and "swahili." ... 70
3.11 Wide band spectrograms of the words "yore" and clear." .... ... 71
10
-3.12 Wide band spectrograms of the the words "quadruplet," rule" and
"roulette." . ... 72
3.13 Wide band spectrogram with formnant tracks overlaid of the word "rau-wolfia." ... 74
3.14 Wide band spectrogram of the word "guarani." ... ... 74
3.15 An illustration of parameters used to capture the features voiced and sonorant. ... 76
3.16 Results obtained with the voiced and sonorant parameters. ... 77
3.17 Wide band spectrogram of the word wagonette" and "wolverine." . . . 79
3.18 Voiced and Sonorant parameters of the words granular" and exclu-sive." ... 80
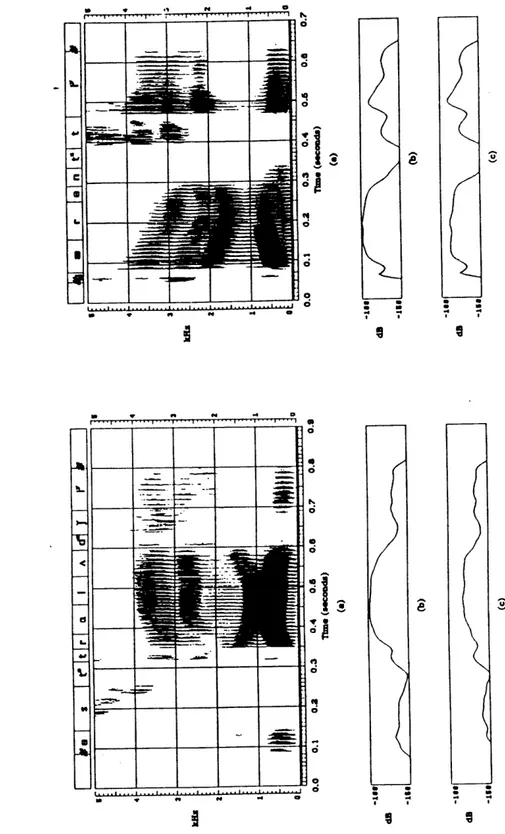
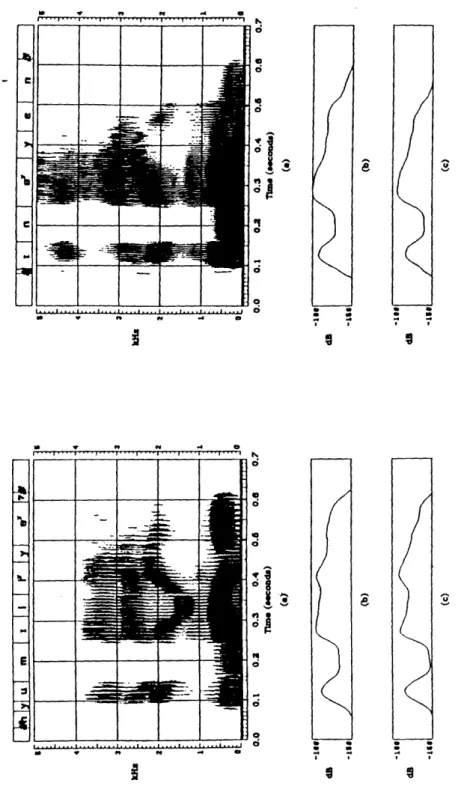
3.19 Wide band spectrogram of the words "periwig," "humiliate" and "di-uretic." ... 82
3.20 Measurement procedure for energy dips within intervocalic consonants.. 83
3.21 Measurement procedure for intravowel energy dips ... 84
3.22 Comparisons between intravowel energy dips and average energy differ-ences between intervocalic consonants and adjacent vowels. ... 86
3.23 Significant intravowel energy dips. . . . 87
3.24 Intervocalic semivowels with no significant energy dips ... 88
3.25 Intervocalic /y/'s with no significant energy dips ... 89
3.26 Measurement procedure for natural energy increase in word-initial vow-els ... . 91
3.27 Comparisons of natural energy rise within vowels and average energy difference between prevocalic consonants and following vowels. ... 92
3.28 Measurement procedure for natural energy taper in word-final vowels.. 94
3.29 Comparisons of natural energy taper within vowels and average energy difference between postvocalic consonants and preceding vowels. .... 95
3.30 Illustration of large energy taper in word-final diphthongs ... 96
3.31 An illustration of parameters which capture abrupt spectral changes. .. 98
3.32 Onsets between following vowels and consonants. ... 100
3.33 Rate of spectral change associated with prevocalic /l/'s in "blurt," "lin-guistics" and "misrule." ... ... 1. 101 3.34 Onsets and Offsets between surrounding vowels and intervocalic conso-nants ... 102
3.35 Rate of spectral change associated with intervocalic /l/'s in "walloon" and "swollen." ...
3.36 Offsets between preceding vowels and postvocalic consonants... 3.37 Comparison of the duration of the energy dip regions in "harmonize"
and "unreality." ...
3.38 Comparison of the durations of intersonorant energy dip regions.... 3.39 Feature assimilation between the /a/ and /r in the words "cartwheel"
spoken by each speaker. ... 3.40 Tree structure for syllable. ... 3.41 Tree structure for first syllable in "cartwheel ...
3.42 Wide band spectrograms of the words "harlequin," carwash" and "Nor-wegian," each spoken by two different speakers. ...
3.43 Wide band spectrograms of the word "snarl" spoken by each speaker. 3.44 Wide band spectrograms of the words almost" and "stalwart." .... 4.1
4.2 4.3
Quantification of the acoustic correlate of the feature nonsyllabic.... Quantification of the acoustic correlates of the features back and front. Places within a voiced sonorant region where semivowels occur... Illustration of intersonorant dip detection algorithm.
Results of Intersonorant dip detection in willowy." ... Result of Intersonorant F2 dip detection in "dwell.".
Illustration of sonorant-final dip detection algorithm... Results of sonorant-final dip detection in "yell." ... Illustration of the sonorant-initial dip detection algorithm.. Results of sonorant-initial dip detection in yell." ...
Flow chart of the sonorant-initial classification strategy. Flow chart of the intersonorant classification strategy . Pattern of events expected when /r/ or /1/ are postvocalic intersonorant cluster.. ...
Flow chart of the intervocalic classification strategy. Flow chart of the cluster classification strategy. ... Flow chart of the sonorant-final classification strategy ....
... .129 ... .130 ... .131 ... .132 ... .134 ... .135 ... .136 ... .138 ... .139 and in an ... .141 ... .142 ... .143 ... .145
Acoustic events marked within "choleric" and "harlequin.n ... 151
Examples of unstressed semivowels ... .. 153
12 . 104 . 105 · 107 .109 · 111 .112 .113 .114 .115 .117 .124 .125 .127 4.4 4.5 4.6 4.7 4.8 4.9 4.10 4.11 4.12 4.13 4.14 4.15 4.16 5.1 5.2
5.3 Examples of devoiced semivowels .. ... 154
5.4 Examples of unstressed and partially devoiced semivowels ... 155
5.5 Examples of nonsonorant /w/'s . ... 157
5.6 Examples of semivowels omitted from voiced region. . .... ... 158
5.7 Example of sounds omitted from sonorant region ... 159
5.8 An illustration of some acoustic events marked in the word "square." . . 161
5.9 An illustration of some acoustic events marked in the words "prime" and "cartwheel." ... 163
5.10 An illustration of formant movement between /r/'s and adjacent coronal consonants in the words "foreswear" and "northward" . . . 168
5.11 An illustration of formant movement between the /y/'s in "your," "pule" and yon" and the following vowels . . . 169
5.12 A comparison of the /ny/ regions in the words banyan" spoken by two different speakers ... . 172
5.13 Wide band spectrograms with formant tracks overlaid of four words which contain consonants that were misclassified as semivowels . ... 181
5.14 Wide band spectrograms with formant tracks overlaid of four words which contain vowels, portion of which were classified as semivowels. . . 184
5.15 Wide band spectrograms with formant tracks overlaid of words with vowel portions which, due to contextual influence, were classified were classified as a semivowel ... 185
5.16 Wide band spectrograms with formant tracks overlaid of three words with vowel portions which were classified as /r/ ... 186
5.17 An illustration of the words "guarantee" and "explore"which contain intravowel energy dips which resulted in portions of the vowels being classified as semivowels ... 188
List of Tables
2.1 Symbols Available in SPIRE for Phonetic Transcription ... 31
3.1 Average formant frequencies of word-initial semivowels broken down by speaker and averaged across all speakers. ... 52
3.2 Average formant frequencies of voiced prevocalic semivowels broken down by speaker and averaged across all speakers. . ... 53
3.3 Average formant frequencies of intervocalic semivowels broken down by speaker and averaged across all speakers. ... 54
3.4 Averaged formant values for postvocalic liquids broken down by speaker and averaged across all speakers . ... ... 55
3.5 Average formant values for word-final liquids broken down by speaker and averaged across all speakers ... 56
3.6 Averages and standard deviations of the differences between the average formant values of prevocalic semivowels and those of following vowels. . 64 3.7 Average and standard deviation of the difference between the average formant values of intervocalic semivowels and those of the surrounding vowels ... 65
3.8 Averages and standard deviations of the differences between the average formant values of postvocalic liquids and those of the preceding vowels. 65 4.1 Features which characterize various classes of consonants ... 119
4.2 Features for discriminating among the semivowels . ... 119
4.3 Mapping of Features into Acoustic Properties . ... 121
4.4 Qualitative Description of Quantified Properties . . . 124
4.5 Prevocalic Semivowel Rules . ... 146
4.6 Intersonorant Semivowel Rules . ... 147
4.7 Postvocalic Rules . .. ... 147
14
5.1 Overall Recognition Results for the Semivowels ... 165
5.2 Recognition Results for Sonorant-Initial Semivowels Not Adjacent to a Consonant ... 173
5.3 Recogiition Results for Sonorant-Initial Semivowels Adjacent to Voiced Consonants ... 174
5.4 Recognition Results for Sonorant-Initial Semivowels Adjacent to Un-voiced Consonants ... 175
5.5 Recognition Results for Intervocalic Semivowels. ... 176
5.6 Recognition Results for Semivowels in Intersonorant Cluster. ... . 177
5.7 Recognition Results for Sonorant-Final Semivowels ... 178
5.8 Recognition of Other Sounds as Semivowels ... 180
5.9 Semivowel Recognition Results for LLAPFE. ... 190
5.10 Semivowel Recognition Results of the MEDRESS System ... 193
6.1 Lexical Representation vs. Acoustic Realizations of /ar/. ... 199
A.1 Alphabetical listing of the polysllabic words ... 209
A.2 Word-initial semivowels which are adjacent to stressed vowels ... 216
A.3 Word-initial semivowels which are adjacent to vowels which are either unstressed or have secondary stress. ... . 216
A.4 Prevocalic semivowels that are adjacent to a fricative and adjacent to a stressed vowel ... 217
A.5 Prevocalic semivowels that are adjacent to a fricative and adjacent to a vowel which either unstressed or has secondary stress. ... 218
A.6 Prevocalic semivowels which are adjacent to a stop and adjacent to a vowel which is stressed. ... 218
A.7 Prevocalic semivowels which are adjacent to a stop and adjacent to a vowel which is either unstressed or has secondary stress ... 219
A.8 Prevocalic semivowels which are adjacent to a fricative-stop cluster and adjacent to a stressed vowel. ... 219
A.9 Prevocalic semivowels which are adjacent to a fricative-stop cluster and adjacent to a vowel which has secondary stress ... 220
A.10 Prevocalic semivowels which are adjacent to a fricative-stop cluster and adjacent to vowels which are unstressed ... 220
A.11 Intervocalic Semnivowels which occur before stressed vowels. . . . 220
A.12 Intervocalic Semivowels which follow vowels which are stressed. ... 221
A.13 Intervocalic Semivowels which occur between unstressed vowels ... 221
A.14 Intersonorant Semivowels which are in adjacent to other semivowels . . 222
A.15 Intersonorant Semivowels which are adjacent to nasals. ... 222
A.16 Word-final semivowels ... 223
A.17 Postvocalic semivowels which are not word-final. ... 223
A.18 Word-initial vowels. ... 224
A.19 Word-initial nasals and /h/'s ... 225
A.20 Intervocalic nasals and /h/'s. ... 225
A.21 Word-final nasals ... 226
B.1 Portions of vowels which were classified as a semivowel. ... 228
Chapter 1
Introduction and Literature Review
1.1
Introduction
The ultimate goal of most speech recognition research is the development of a sys-tem which allows the natural communication by speech from people to machines. That is, we want recognition systems to be capable of understanding fluent conversational speech from any random speaker. Such systems are desirable since speech is our most natural mode of communication. Thus, unlike today when people must have special skills such as typing to communicate with a computer, the use of such recognition systems requires no training. Furthermore, since we speak much faster than we write and type, speech provides the highest potential capacity in human-to-machine com-munication. Finally, computers which understand speech free the eyes and hands of the operator to perform other tasks simultaneously.
Although research in speech recognition and other related areas has been going on for several decades, recognition systems have yet to come close to realizing their fll potential. With current systems, reasonable recognition performance is possible only if the task is greatly simplified. Present state-of-the-art systems, with few exceptions, can only recognize a small vocabulary of acoustically distinct words which must be said in isolation by a particular speaker. Systems capable of understanding continuous speech also reduce the recognition task by limiting the user to a particular speaker and by constraining the way in which sentences can be formed.
One major reason for these necessary limitations is our present inability to deal with the considerable variability in the speech signal. In addition to linguistic information, the speech signal contains extralinguistic information regarding the talker's personal
characteristics, his or her psychological and physiological state, and the recording environment. Thus, to achieve the goal of speaker-independence and continuous speech input, recognition systems must be able to separate out and decode the message-bearing components of the spoken utterance.
What are these message bearing components? We believe that the answer to this question is based on two widely accepted premises. First, the speech signal is composed of a limited set of basic sound units known as phonemes. In English, the inventory of phonemes includes about 16 vowels and 24 consonants. Second, the canonic represen-tation of each phoneme is characterized by a small set of distinctive features, where a distinctive feature is a minimal unit which distinguishes between two maximally close but linguistically distinct speech sounds. For example, the single feature voice sep-arates the phonemes /b/ and /p/. The distinctive features also organize the speech sounds into natural classes on the basis of common characteristics. For example, the feature nasal lumps the phonemes /m/, /n/ and // into one such class. In languages in general, there are about 20 distinctive features. However, any one language only uses a subset of 10 to 15 for signaling phonetic contrasts.
Although the associations are not well understood in every case, it is hypothesized that all the distinctive features have acoustic correlates. While the distinctive features are binary in nature, the corresponding acoustic properties can have varying degrees of strength due to the wide variability in the acoustic realization of the phonemes. This variability is principally of two types. As we stated earlier, one kind of variability is due to the different vocal tract sizes and shapes of different talkers and the changes in voice quality within the same speaker and across speakers. While there are definite acoustic changes due to these sources, the feature specification of the phonetic segments is usually unchanged. Thus, if properly defined, acoustic properties for features should not be affected by such variability.
On the other hand, another kind of variability known as feature assimilation can modify considerably the feature make-up of the underlying phonemes and the strength of their corresponding acoustic properties. These changes, which occur when phonemes are concatenated to form larger units such as syllables, words and sentences, are due in part to the varying degrees of sluggishness in the articulators when moving from one target configuration to the next. That is, the adjustment of the articulators to implement one set of features may be influenced by the adjustment needed to produce an adjacent set. As a consequence, one or more features of a phonetic segment may
spread to a nearby sound, resulting in several types of modifications.
First, some of the features of a segment may change. For example, this phe-nomenon will sometimes occur when a weak voiced fricative (/v/ and /6/) is in an intervocalic position. Whereas fricatives are characteristically nonsonorant with some high frequency noise, in this context they can be sonorant with no noise. However, features other than the sonorant feature remain unchanged. Such variants from the canonical representation of a particular phoneme are referred to as allophones. Thus, a /v/ which occurs between two vowels is usually a different allophone from the one which occurs in other contexts. Second, a feature which is normally unspecified for a segment may become specified. An example of this phenomenon is the nasalization of vowels when they are adjacent to a nasal consonant. Finally, a result of this feature spreading may be the merging of two segments into one segment which has a number of features common to both of the underlying sounds. This phenomenon is often seen at word boundaries in continuous speech. For example, the word pair did you" is often pronounced in fluent speech as dija." That is, the final /d/ and the word-initial /y/ can be coarticulated such that the resulting sound is a //. The degree to which sounds undergo such feature assimilation is determined by several factors such as speaking style, speaking rate and language specific rules.
Thus, the use of phonetic features as basic units upon which larger units such as phonetic segments, syllables, words, sentences, etc. are recognized is appealing since, if properly defined and extracted, they should not be affected by much of the within-speaker and across-within-speaker variability seen in the speech signal. However, it appears that some mechanism is needed to account for feature assimilation effects.
Before outlining and discussing these issues within the context of the class of sounds focused upon in this thesis, we will first consider previous work in speech recognition. A brief review of some of the findings of previous acoustic and perceptual studies of the semivowels, along with the results of an acoustic study conducted in this thesis, are given in Chapter 3.
1.2
Literature Review
Considerable effort has been expended in the development of isolated word and continuous speech recognition systems. Basically, there have been two standard
The phonetically-based approach to speech recognition has mainly been pursued in academia because of its long term investment. This method draws on the dis-tinctive feature theory first proposed by Jakobson, Fant and Halle (1952) and later expanded by Chomsky and Halle (1968). Such an approach attempts to extract the message-bearing components of the utterance explicitly by extracting relevant acous-tic properties. While this approach has a strong theoreacous-tical base, limited success has been obtained because of the lack of a good knowledge of acoustic phonetics and other related areas. That is, researchers have yet to uncover the proper acoustic properties for features and, therefore, they have not been able to reliably extract this informa-tion for phonetic recogniinforma-tion. In addiinforma-tion, all aspects of feature assimilainforma-tion are not understood.
Researchers of the mathematically-based methods find the well-defined algorithms which can be used within this framework attractive, and many consider the heuristics used in the extraction of explicit speech knowledge ad hoc. This type of an approach to speech recognition has mainly been pursued in industry because of its near term success for constrained recognition problems. Such an approach attempts to extract the mnessage-bearing components of the utterance implicitly. That is, equipped with large amounts of training data and sophisticated engineering techniques, recognition systems are expected to either discover all of the regularities in the speech signal and "average out" all of the variability, or effectively model all of the variability. Presently, none have been able to adequately cope with all types of variability.
Because of the shortcomings of the mathematically-based approaches and yet their ability to model some speech variability that we presently do not understand, there have been recent efforts to develop ways of incorporating our increasing acoustic pho-netic knowledge within the statistical frameworks. It is hoped that such an integration of approaches will eventually lead to speaker-independent continuous speech recogni-tion.
In this section, we give a brief review of these methods. For a more extensive coverage of speech recognition research, we recommend reviews given by Lindgren (1965) and Lea (1980).
1.2.1 Phonetically-Based Approach
Recognition systems which attempt to extract acoustic cues from which phonemes or phones are recognized date as far back as 1956 when Wiren and Stubbs developed a
binary phoneme classification system. In this system, acoustic properties were used to classify sounds as voiced-unvoiced, turbulent-nonturbulent, acute-grave, and compact-diffuse. Although no overall recognition score is given, the performance of this system is encouraging in light of how little was known in the area of acoustic phonetics at the time of its development. For example, vowels in monosyllabic words spoken three times each by 21 talkers were correctly classified as acute or grave 98% of the time.
Since that time, several recognizers based on this approach have been developed. While most of these systems have obtained only moderate recognition rates for a particular class of phonemes occurring in specific contexts, important concepts have been introduced. For example, Martin, Nelson and Zadell (1964) used detectors which not only indicated when a feature was present or absent, but also indicated the strength of its acoustic correlate. As another example, Medress (1965), as far as we know, was the first to take advantage of phonotactic constraints which restrict allowable phoneme sequences. This information was used to help identify word-initial and word-final consonant clusters in an isolated word recognition system.
More recently, this approach has been applied to the recognition of continuous speech. Between 1971 and 1976, the Advanced Research Projects Agency (ARPA) funded the largest effort yet to develop continuous speech recognition systems. (See Klatt (1977) for a review.) While these systems used some knowledge of acoustic phonetics, most of them relied extensively upon high level knowledge of syntax and semantics for sentence decoding. For example, Harpy, the most successful system in terms of word and sentence accuracy, correctly recognized 97% of the words in the utterances even though it correctly recognized only 42% of the phonetic segments. This poor phonetic recognition was due to a primitive front end which segmented and labelled the speech signal. Whereas the segmenter used acoustic cues extracted from parameters such as zero crossing rates and smoothed and differenced waveforms, the-labeller used phone templates consisting of linear-prediction spectra. To deal with variability due to feature assimilation, 98 templates were used to represent all possible allophones, and juncture rules accounted for some effects between phone sequences. In addition, to deal with within-speaker variability, each template was computed by averaging all occurrences of the particular allophone in a set of training sentences.
An exception to this heavy reliance on high level knowledge for continuous speech recognition was the HWIM system developed at BBN which used considerably more acoustic phonetic knowledge. To provide a phonetic transcription of an utterance, a
parametric representation and a set of 35 ordered acoustic-phonetic rules was used. This processing resulted in a segment lattice which provided multiple segmentation paths for portions of an utterance. With a dictionary of 71 allophones, 69% of the correct phonetic segments were in the top two choices produced by the front end.
1.2.2
Mathematically-Based Methods
Most commercially available speech recognition systems are based on general pattern-matching techniques which use little speech-specific knowledge. They are speaker de-pendent and recognize a limited vocabulary of words which must be said in isolation. These systems are trained by having the talker to be recognized generate a set of reference patterns or templates which are digitized and stored. The templates usually consist of a series of spectral sequences computed every 10 to 20 msec. For recogni-tion, these systems use a distance metric to select from a set of stored templates the closest match to the pattern computed from the incoming word. The first complete recognizer of this sort was developed in 1952 by Davis, Biddulph and Balashek. This speaker-dependent system had a recognition rate of 97% for the digits zero(oh) to nine. Since that time, several engineering techniques have been introduced to deal with some of the variability in the speech signal. For example, to deal with varying speaking rates which result in duration differences between stored and input templates, several time-alignment procedures have been developed. Presently, the most effective and widely used technique is dynamic time warping (DTW), introduced by Sakoe and Chiba (1971). This algorithm, when comparing two templates, uses a distance metric to nonlinearly warp the time axis of one so that the templates are maximally similar. A computationally efficient distance metric developed for use with DTW was developed by Itakura in 1975.
In addition, since spectral templates are inherently speaker dependent, techniques have been developed so that systems could accommodate multiple speakers. One such system, developed by Rabiner et al. (1979), uses clustering algorithms to generate multiple templates for each vocabulary item. While recognition accuracies obtained from multiple speakers compare favorably to those obtained from equivalent speaker-dependent -systems, extension to speaker-independence is not foreseeable. Such an extension would require knowing when the training data were large enough so that they adequately account for all allowable pronunciations. Furthermore, assuming a sufficient data base could be collected, it is not clear that the recognition system will
find, from amongst all of the acoustic variability present, all of the allophonic variants. While the techniques mentioned are important engineering advances, they are not sufficient for extension of these systems to continuous speech recognition. That is, there is still no mechanism for dealing with feature assimilation effects between word boundaries. Presently, feature assimilation between phonemes is accounted for by choosing words as the recognition unit, possibly storing multiple or averaged templates for each word, and requiring sufficient silence (usually 200 msec) between words so that there is no feature spreading between them. To recognize continuous speech, template matching systems basically ignore feature spreading effects between words and use isolated word templates to spot words in the utterance (Myers and R,.biner, 1981). Although these systems have had limited success (greater than 94% string accuracy in a restricted digit task when the string length is known), this type of "brute force" approach cannot cope with some of the feature assimilation effects often seen at word boundaries (discussed in Section 1.1). Thus, extensions along these lines are unlikely. In addition to this drawback, isolated word template-matching systems are unable to focus on phonetically relevant information needed to distinguish between acousti-cally similar words such as "way" and lay," where the vowels in the word pair are the same and the consonants, although different, share common acoustic characteristics. This problem is the result of the distance metrics employed. Presently, in comparing two word templates, all parts of the utterance are weighted equally. Thus, in the example cited above, too much weight is given to the similarity in the frame-by-frame variations of the steady state vowel and too little weight to the differences between the consonants. As a result, for reasonable performance, the recognition vocabulary must consist of acoustically distinct words. This poses yet another problem for template-matching systems in that the size of the recognition vocabulary must be limited, since the acoustic distinctiveness between words decreases as the number of words increases. During the past several years, many researcher have been investigating another approach for isolated word recognition systems which is based on hidden Markov models (HMM). With this technique, a labeled training data base is used to build Markov models for each word. In recognition, a probability score is computed for each word HMM given the unknown token, and the recognized word is the one whose model probability is highest. In a comparison of a speaker-independent isolated word recognition system based on HMM with one based on pattern-matching techniques with DTW, Rabiner et al. (1983) found that the HMM system performed slightly
worse. It was hypothesized that this difference in performance was due to insufficient training data.
The most successful use of HMM to date has been in the speaker-dependent con-tinuous speech recognition system developed at IBM (Jelinek et al., 1975; Jelinek, 1976; Jelinek, 1981). Recognition rates of 91% have been obtained for words selected from sentences in the 1000 word vocabulary of Laser Patent Text. Instead of word HMM models, this system uses HMM to model the time-varying spectral properties of phonetic segments. Each word in the lexicon is then represented as a sequence of phoneme models in a finite state graph, and feature assimilation between phonemes is handled through rules.
While consistently high word-recognition rates have been obtained with the IBM system for speakers who have trained the system extensively before use, extension of its approach to speaker-independence is problematic. Presently, the signal representa-tion used to train the phone HMM consists of raw spectra which, as we said earlier, are intrinsically speaker dependent. Thus, to model all of the variability seen across all speakers would require an inordinate amount of training data and comparable computation and memory requirements.
1.2.3
Combined Methods
Over the past few years, efforts have been made to incorporate explicit speech knowledge into the mathematically-based frameworks. Below we discuss two such efforts which have reported positive results.
One effort which combined speech-specific knowledge and statistics is the TURE system developed by Cole et al. (1983). Instead of spectral templates, FEA-TURE used about 50 acoustic properties to recognize the isolated letters of the English alphabet. Motivated from a study of a large data base, these properties consisted of measures such as fornmant frequencies extracted from vowel regions and voice-onset time extracted from consonant regions. To integrate the properties for recognition, a statistical pattern classifier was used. For letters in the easily confused E set (B,C,D,E,G,P,T,V and Z), FEATURE obtained error rates of only 10% as compared to traditional spectral template matching systems which have error rates of between 301% and 400%.
A more recent system which combines these approaches was developed at BBN (Schwartz et al., 1985). In this speaker-dependent recognizer, context-dependent HMM
models are used to recognize phonemes in continuous speech. However, in addition to the raw spectra, acoustic properties extracted from the speech signal are used within the HMM formalism to aid in certain phonetic contrasts. With this addition, confusions between acoustically similar phonemes decreased by as much as a factor of
two. For example, Schwartz et al. state that the correct identification of the unvoiced stop consonants /p,t,k/ increased from 83% to 91%.
1.3
Thesis Scope
A conclusion which can be drawn from the literature review is that research in acoustic phonetics is of primary importance if speaker-independent continuous speech recognition systems shall be realized. More specifically, systematic studies of large data bases, combined with solid theoretical models of speech production and percep-tion, are needed to uncover the proper acoustic properties for features and to gain an understanding of feature assimilation effects. Such a study is the focus of this research. In this thesis we develop a framework for a phonetically-based speech recognition system. We view the recognition process as consisting of four steps. First, the fea-tures needed to recognize the speech sounds of interest must be specified. Second, the features must be translated into acoustic properties which can be quantified. Third, algorithms must be developed to automatically and reliably extract the acoustic prop-erties. Finally, these properties must be combined for recognition.
The task we have chosen to study is the recognition of the semivowels /w,y,r,l/. This is a particularly challenging problem since the semivowels, which are acoustically very similar to the vowels, almost always occur adjacent to a vowel. As a consequence, spectral changes between these sounds are often quite gradual so that acoustic bound-aries are usually not apparent. In this respect, recognition of the semivowels is more difficult than recognition of other consonants.
We have limited the recognition task to semivowels which are voiced and nonsyl-labic. Devoiced allophones, which may occur when the semivowels are in clusters with unvoiced consonants, are excluded since some aspects of their acoustic manifestation are considerably different from that of the other semivowel allophones. In addition, the syllabic allophones of /r/ and /1/ in words like "bird" and "bottle" are excluded since they are more correctly classified as vowels.
prob-lem in several other ways. In particular, the recognizer is designed using polysyllabic words excised from the simple carrier phrase " pa." We chose this simple
context as opposed to isolated words or more continuous speech because it allows for a more controlled environment. That is, following the test words with "pa" reduces the possibility of glottalization and other types of variability that occur in utterance-final position. In addition, since there is no sentence context to help convey the speaker's message, he or she is more likely to enunciate the words more clearly. Thus, the acoustic cues signalling phonetic contrasts should in general be more salient.
Although the recognition task has been simplified, it remains quite challenging. The data base chosen contains the semivowels in a variety of phonetic environments so that variability similar to that observed in continuous speech due to stress and feature assimilation is also found in the polysyllabic words. Thus, the methods used to recognize the semivowels are extendible to more continuous speech. This extension of the system is demonstrated with a small corpus of sentences.
The first part of this thesis lays the groundwork for the recognition system. We describe the data bases used to develop and test the recognition algorithms in Chapter 2. Also included in this chapter is a brief discussion of the tools used at different stages of this research.
Once a data base was collected to develop the recognition algorithm, we conducted an acoustic study to supplement data in the literature regarding the acoustic correlates for features needed to recognize the semivowels. The results of this study and a discussion of feature spreading and its apparent relation to syllable structure are given in Chapter 3.
After we identify acoustic properties for features, steps three and four of the frame-work outlined above are implemented. A description of how these steps are carried out is given in Chapter 4.
Chapter 5 contains an overview and a breakdown of the recognition results ob-tained for each of the data bases. The discussion therein points out the weaknesses and strengths of the recognition system. In addition, an analysis of the misclassi-fications brings forth several issues regarding feature spreading, attaching phonetic labels to patterns of features before lexical access, and using hand-transcribed data to evaluate recognition systems. The chapter closes with a comparison between the semivowel recognition results obtained in this thesis and those obtained in two earlier phonetically-based systems.
Finally, In Chapter 6, we summarize the results and discuss further some of the issues highlighted by this research. In particular, we discuss ideas regarding future studies of feature assimilation and lexical access from acoustic properties.
Chapter 2
Data Bases and Tools
This chapter describes the corpora used to develop and evaluate the semivowel recognition system. In addition, we discuss some of the tools used in various stages of this research. Among these tools is a formant tracker which we discuss in more detail since it was developed as a part of this thesis.
2.1
Data Bases
The initial step in this research was the design of a data base for developing and testing the recognition algorithms. Using ALEXIS, a software tool for lexicon search (Zue et al., 1986), we chose 233 polysyllabic words from the 20,000-word Merriam-Webster Pocket Dictionary. These words contain the semivowels and other similar sounds, such as the nasals and, in some contexts, other voiced consonants, in a variety of phonetic environments. They occur in word-initial and word-final positions such as the /y/ and /1/ in "yell," in intervocalic positions such as the /r/ and /1/ in "caloric," and adjacent to voiced (sonorant and nonsonorant) and unvoiced consonants such as-the /w/ in as-the /dw/ cluster in "dwell," as-the /r/ and as-the /w/ in "carwash," as-the /y/ adjacent to the /n/ in "banyan" and the /r/ in the /str/ cluster in "astrology." In addition, the semivowels occur adjacent to vowels which are stressed and unstressed such as the word-initial /1/ and the prevocalic /1/ in "loathly," and they occur adjacent to vowels which are tense and lax, high and low, and front and back. An alphabetical listing and a grouping of the words according to various contexts are given in Appendix A. Some words occur in more than one of the categories based on context. The purpose of this overlap was to minimize the number of words in the data base while covering
most contexts.
According to the phonetic ti anscription of the words given in the Pocket dictionary, the data base should contain 145 tokens of /r/, 139 tokens of /1/, 94 tokens of /w/ and 61 tokens of /y/. However, the actual number of semivowel tokens enunciated by each speaker differs because some words have multiple allowable pronunciations and some words were mispronounced. For example, a word which has a vowel-to-vowel transition where the first vowel-to-vowel has a /y/ offglide may be spoken with a /y/ inserted. Thus, the word radiology" can be pronounced as [reYdiyyalj'iY] with an intervocalic /y/ or as [reYdiYalo'iY] without an intervocalic /y/. Similarly, if the first vowel in a vowel-to-vowel transition has a /w/ offglide or is the retroflexed vowel /a/, then a /w/ or an /r/ may be inserted, respectively. Thus, the word flour" may be pronounced as [flaww] with an intervocalic /w/ or as [flaw3¶ without a well enunciated /w/. Likewise, the word "laceration" may be pronounced as [lasreYsan] with an /r/ inserted or as [laesreYSn]l without an /r/ inserted. In addition, a postvocalic /1/, when followed by another consonant, may not be clearly articulated. Thus, the word "almost" may be pronounced [olmowst) or [omoWst]. Furthermore, a postvocalic /1/ which follows a reduced vowel may be articulated as a syllabic //. Thus, "unilateral" may be pronounced as [yunalwararl] with a syllabic /1/, or it may be pronounced as [yunalaerral] with a postvocalic /1/. Finally, one of the speakers systematically confused /r/ and /w/. For example, the intervocalic /w/ in rauwolfia" was replaced by an /r/ and the prevocalic /r/ in "requiem" was replaced by a /w/.
For these reasons, judgement regarding the inclusion or exclusion of a semivowel is often ambiguous. Several measures were used to make this decision if a semivowel was not clearly heard when the utterance or a portion thereof was played. First, within the region in question, we looked for significant formant movement towards values expected of the semivowel. Second, we looked for other spectral changes such as a decrease in energy since the semivowels are usually weaker than adjacent vowels.
Finally, we sometimes consulted with other transcribers.
For acoustic analysis and the development of the recognition algorithms, each word was recorded by two males (one black and one white) and two females (one black and one white). The speakers are from the northeast (New York and Rhode Island) and the midwest (Ohio and Minnesota). They were recorded in a quiet room with a pressure-gradient close-talking noise-cancelling microphone. The microphone was placed about 2 cm in front of the mouth at a right angle just above the midline. All
of the words were hand-transcribed to facilitate the acoustic study (see Chapter 3). When transcribing the data base, we placed markers at particular instants of time to divide the speech signal into segments which were assigned labels that in some way described some property(s) of the delineated regions.
Two corpora were used to test the recognition system. The first data base con-sisted of the same polysyllabic words spoken by two additional speakers (one female, one male, both white) from the same geographical areas cited above. The same record-ing set-up was used. These words were also transcribed to facilitate the evaluation of the recognition algorithms. The second data base consisted of a small subset of the sentences contained in the TIMIT data base (Lamel et al., 1986). In particular, we chose the sentences "She had your dark suit in greasy wash water all year" (Sent-1) and "Don't ask me to carry an oily rag like that" (Sent-2), since they contain sev-eral semivowels in a number of contexts. Presently, the TIMIT data base is being segmented and labelled by several experienced transcribers with the help of an auto-matic alignment system (Leung and Zue, 1984). From the transcribed utterances, we selected 14 repetitions of Sent-1 (6 females and 8 males) and 15 repetitions of Sent-2 (7 females and 8 males). The speakers cover 7 U.S. geographical areas and an "other" category used to classify talkers who moved around often during their childhood. Like the words in the other data bases, these sentences were recorded using a close-talking microphone.
2.2
Tools
The semnivowel recognition system was implemented on the MIT Speech Commu-nication Group's LISP machine facility for which several software tools have been developed to aid speech research. The way in which the tools were used in this thesis is described briefly in this section. A more detailed discussion of the tools is offered in (Zue et al., 1986).
2.2.1
SPIRE
Initial processing of the data base was done with the Speech and Phonetics Interac-tive Research Environment (SPIRE). First, the recorded words were digitized using a 6.4 kHz low pass filter and a 16 kHz sampling rate. Such a wide frequency range helps in the identification of obstruents (stops, fricatives and affricates) and, therefore, in
30
Table 2.1: Symbols Available in SPIRE for Phonetic Transcription Unvoiced Stops: p t k Voiced Stops: b d g I Stop Gaps: p" t kP b d g r Nasals: - n m rj Z Syllabic Nasals:
.n
m l Unvoiced Fricatives: sI
f 0 Voiced Fricatives: z I v Glides: I r w y Vowels: e' Pi e a a A 3 3' U U U i = Schwa: a g i H, Silences: h fia
o Special Markings: # $S + - ' "the discrimination between sonorant and nonsonorant sounds. This is aipproximately the frequency range that is often used for spectrogram reading. Second, the speech signals were preemphasized to compensate for the relatively weak spectral energy at high frequencies, particularly for sonorants. This preemphasis means that the average spectral energy is similar at the higher and lower frequencies. Finally, SPIRE was used to transcribe the data bases. The set of symbols available for phonetic transcription is shown in Table 2.1. Most of these symbols were taken from the International Phonetic Alphabet (IPA). However, there are some additions and modifications. For example, the word initial sound in "yell" is denoted by the symbol /y/ in SPIRE and by the symbol /j/ in the IPA. In addition, the syllabic /1/ as in table" is denoted by the symbol /1/ in SPIRE and by // in the IPA.
Although there are 58 phonetic symbols in Table 2.1, we found this list incom-plete for sonle of the feature-spreading phenomena occurring between semivowels and adjacent segments. These effects are described below.
The features of a vowel or consonant and a following /r/ may overlap
considerably, such that the acoustic manifestation of these two segments is an r-colored vowel or an r-colored consonant, respectively. An example of this phenomenon is shown in Figure 2.1, which compares spectrograms of the words "harlequin" and marlin" spoken by the same person. In the case of "marlin," the lowest frequency of F3 clearly occurs in the /r/ region which follows the vowel. However, in "harlequin," F3 is lowest at the beginning of the vowel and remains steady for a considerable duration of the vowel, after which it rises due to the influence of the /1/. In the latter case, an /r/ segment separate from the vowel segment is not apparent. Thus, instead of forcing nonoverlapping
h a r I a k k xIvI n kHz 0.0 0.1 0.2 0.3 0.4 0.6 0.6 Time (seconds) 3 4 3 kHz 2 I 0 0. 0 0.1 0.2 0.3 Time (sec
1
s 0.7 0.4 0.6 0.8 :onds)Figure 2.1: A comparison of the words "harlequin" and "marlin." In "harlequin" the underlying /a/ and /r/ sounds appear to be merged into one segment, in the sense that the lowest point of F3 occurs at the beginning of the vowel. Thus, the transcription should allow overlapping sounds. In "marlin," F3 is well above 2000 Hz in the beginning of the /a/, and it falls steadily to its lowest point in the /r/. Thus, the /a/ and /r/ appear to be separate segments.
32 m a I r I I I In I :
i
7
-7
--I I TI I TI -1.;.T1
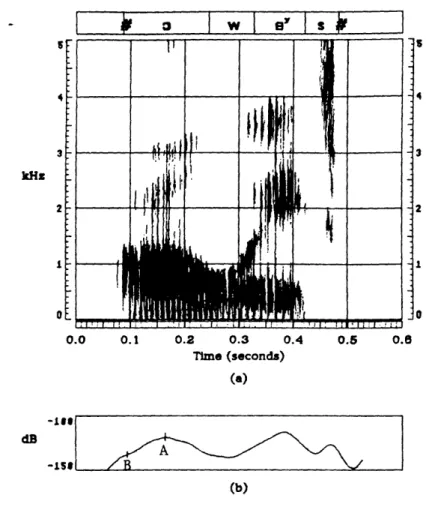
eIvIri
Il
Bl
I
0 a Time (seconds) Figure 2.2: The the lowest point overlap./v/ in "everyday" appears to be sonorant and retroflexed. In fact, of F3 occurs within this segment. Thus, the /v/ and /r/ appear to
juxtaposed segments, a more correct transcription facility would allow the transcribed /a/ and /r/ regions to be combined into one region with an appropriate r-colored vowel label. A similar example of this phenomenon, in this case the retroflexed consonant /v/, is illustrated in Figure 2.2, where a spectrogram of the word "everyday" is shown.
When in a cluster with unvoiced consonants, the semivowels are sometimes devoiced. An example of this type of feature spreading is shown in Figure 2.3, which compares spectrograms of the word "queen" spoken by two different speakers. In the spectrogram on the top, the /w/ in the /kw/ cluster is only partially devoiced such that there are considerable F2 and F3 transitions from the /w/ into the following vowel. However, in the spectrogram on the bottom, the /w/ is completely devoiced. In this case, little in the way of F2 and F3 transitions occur between the fricated /w/ and the following vowel. Instead, the acoustic cues indicating the presence of the /w/ are the low-frequency frication and the low-frequency burst of the /k/. As in the case described above, these phonetic segments co-occur, causing segmentation to be difficult.
33 U 4 3 kHz 2 I a v_
$ 4 3 kHz I Ok w I n l Time (seconds) kHz 2 I 0 Time (seconds) 5 6
Figure 2.3: Two spectrograms of the word "queen," spoken by different speakers. In the example on the top, the /w/ is only partially devoiced. In the example on the bottom, the /w/ is completely devoiced.
Since SPIRE does not have phonetic symbols for devoiced semivowel allophones that occur simultaneously with unvoiced consonants, and since the convention within the speech research group regarding this phenomenon is to label some portion of the beginning of the vowel region as being the devoiced semivowel, part of the vowel was transcribed as /w/. To locate the beginning of the fricated /w/, we successively removed frames from the beginning of the word until the /k/ was no longer audible, so that we heard /wiYn/.
2.2.2
SEARCH
SEARCH (Structured Environment for Assimilating the Regularities n speeCH) is an exploratory data analysis tool which facilitates use of several statistical techniques for examination of a large body of data. For example, questions such as What per-centage of the intervocalic semivowels have significantly less energy than their adjacent vowels?" can be answered with this tool. In acoustic analysis, this software package was used in several ways. First, we used it to study the effectiveness of parameters in capturing properties observable in spectrograms. Second, SEARCH was used to de-termine the relationship between an acoustic property and the context of a particular phonetic segment or class of phonetic segments. Finally, since SEARCH can display data in various forms including histograms, scatter plots and a bar-like display, we used it to determine thresholds for quantifying the extracted properties.
2.2.3
Knowledge-Based Formant Tracker
Although it is not yet offered as a general tool, a formant tracker implemented in the SPIRE facility was developed as a part of the thesis. We based the formant tracker on peak-picking of the second difference of the log-magnitude linear-prediction (ISDLM-LP) spectra. Since the development of this software turned out to be a major undertaking, a discussion of the strategy, techniques and constraints employed in the automatic formant tracker is given below.
Strategy
Since we are interested in the recognition of voiced and sonorant semivowels, for-mant tracking is performed only in those regions specified by the voiced and sonorant detectors (for the parameters used, see Section 3.2.3). To obtain initial estimates of
the formant frequencies, a strategy similar to that developed by McCandless (1974) is used. A block diagram of this strategy is given in Figure 2.4.
Before formant tracking, energy peaks, which usually correspond to syllabic nuclei within vowel regions, and energy dips, which usually correspond to syllable boundaries within sonorant consonant regions, are detected (a discussion of how they are obtained is given in the subsection Intersonorant Semivowels" of Section 4.3.1). Peak picking begins at an energy peak since the formants are most likely to be tracked correctly in the middle of a vowel region, which is least affected by feature assimilation effects such as nasalization or retroflexion. First, the algorithm back tracks, filling formant slots with peaks based on continuity constraints (the frame rate is one per 5 msec) until a boundary is reached. In this case, a boundary can be either the beginning of the detected voiced sonorant region or an energy dip. Second, the algorithm forward tracks from this energy peak, deciding on peaks in each successive frame until a boundary is reached. In this case, a boundary can be either the end of the detected voiced sonorant region or an energy dip. If there are other energy peaks within the voiced sonorant region, this process is continued until the formants have been tracked in each frame.
Techniques
As mentioned above, we chose to pick peaks from the ISDLM-LP spectra. We decided to use this spectral representation of the vocal tract transfer function for several reasons. First, the semivowels are articulated orally with no side branches (except possibly for /1/). Thus, in the frequency range of interest, the transfer function of these sounds can be represented accurately by a all-pole model. Second, spurious peaks which are common in many forms of spectral analysis are rare in the linear prediction spectra, and, therefore, they are rare in the ISDLM-LP spectra. Thus, peak-picking is a more tractable problem using a linear-prediction-based spectra. Finally, shoulder resonances, which occur often in linear prediction spectra and usually cannot be detected through peak picking, show up as distinct peaks in the ISDLM-LP spectra (Christensen et al., 1976).
Although this spectral representation reduces the peak merger problem, this prob-lem as well as probprob-lems due to nasalization still remain. In the former case, two peaks which are completely merged in the linear prediction spectra will also be completely merged in the ISDLM-LP spectra. As a result, there will be empty formant slots. In such instances, we compute the ISDLM-LP spectra inside the unit circle. An iterative