HAL Id: hal-01692593
https://hal.archives-ouvertes.fr/hal-01692593
Submitted on 25 Jan 2018HAL is a multi-disciplinary open access
archive for the deposit and dissemination of sci-entific research documents, whether they are pub-lished or not. The documents may come from teaching and research institutions in France or abroad, or from public or private research centers.
L’archive ouverte pluridisciplinaire HAL, est destinée au dépôt et à la diffusion de documents scientifiques de niveau recherche, publiés ou non, émanant des établissements d’enseignement et de recherche français ou étrangers, des laboratoires publics ou privés.
Transition to a Low-Carbon society and sustainable
economic recovery, a monetary-based financial device
Jean Charles Hourcade, Michel Aglietta, Baptiste Perrissin-Fabert
To cite this version:
Jean Charles Hourcade, Michel Aglietta, Baptiste Perrissin-Fabert. Transition to a Low-Carbon soci-ety and sustainable economic recovery, a monetary-based financial device. 2014. �hal-01692593�
J-C. Hourcade (CIRED), M. Aglietta (Cepii), B. Perissin-Fabert (CIRED)
with
B. Leguet, I. Shishlov, C. Ferron, R. Morel, I. Cochran (CDC Climat),
H. Chenet, D. Strauss, J. Thomae, A. Gorius, M. Coeslier, S. Dupré (2°II),
R. Bibas,
C. Cassen, A. Pottier (CIRED).
This note benefits from the inputs and suggestions of:
- K. Töpfer, C. Jaeger, and all the participants in the Workshop titled:
«Innovative solutions for climate finance, the energy transition and an EU narrative» (July 8th and 9th 2014), F. Lecocq, C. Boemare, E. Espagne, E. Lucero, A. Sirkis, J. de Melo, C. Tutenuit, P.Shukla, E. La Rovere.
- The team of the International Energy Agency last World Energy outlook report.
- The LCS-RNet during its meetings held in Paris (2011), London(2012), Tokyo (2013) and Roma (2014) under the respective chairmanship of J-C. Hourcade, J. Skea, S. Nishioka and S. La Motta.
Study funded by the Caisse des Dépôts et Consignations, VINCI, BNP, and Entreprises pour l’Environnement under the umbrella of Entreprises pour l’Environnement.
Transition to a low-carbon society
and sustainable economic recovery,
A monetary-based financial device
INTRODUCTION: CARBON FINANCE AND THE CANCUN’S ‘PARADIGM
SHIFT’ IN CLIMATE NEGOTIATIONS
1 CLIMATE POLICIES IN AN ADVERSE CONDITIONS?
1.1 Can we afford low-carbon investments that are consistent with 2°C target? 1.1.1 Orders of magnitude: incremental vs. redirected investment
1.1.2 Funding tensions: context-dependent and no specific to the “450-ppm scenario” 1.1.3 Turning the question upside down
1.2 Finance, money and carbon pricing: a new mental map needed
1.3 In a nutshell, blueprint of a proposal
2 PILLARS OF A FINANCIAL ARCHITECTURE ALIGNING CLIMATE AND
DEVELOPMENT OBJECTIVES
2.1 The Value of the CRAs: a trajectory of notional prices
2.2 Transforming carbon-based liquidity into real wealth
2.2.1 From the credit lines of the Central Banks to carbon assets: the circuit of balance sheets 2.2.2 Using a diversity of canals to redirect savings
2.2.3 Securing the environment contribution of LCIs
2.3 Voluntary commitments, carbon assets and pledges: a recoiling mechanism
3 A BENEFICIAL CYCLE OF ENVIRONMENTAL, ECONOMIC AND
MACRO-FINANCIAL INTEGRITY
3.1 Leveraging low-carbon investments
3.1.1 Reduced upfront costs and higher risk-adjusted profitability of LCIs 3.1.2 Pooling low-carbon investments
3.1.3 Carbon-asset backed LCIs and firms value: Back to the Capital Asset Pricing Model 3.2 An inmediate contribution to a sustainable economic globalisation
3.2.1 Clearing the foggy business environtment and dragging the world out of the economic doldrums
3.2.2 The macro-financial advantage of a stable benchmark
3.2.3 Mitigating the structural imbalances in the world “real economy”
CONCLUSION
5 7 7 7 9 10 13 16 18 18 21 24 27 30 30 32 35 36 36 37 39 41In the series of Conferences of the Parties that have occurred since 1992 COP-16, held in November 2010 in Cancun, marked a turning point. It called for «a paradigm shift towards building a low-carbon society that of-fers substantial opportunities and ensures continued high growth and sustainable development» (paragraph 10). Importantly, it also introduced the notion of «equitable access to sustainable development»1 in
the context of a «shared vision for long-term cooperative action» and «global peaking of GHG emissions». This newly devised paradigm shifts the negotiations away from the adversarial stances taken by nations in any process implying to decide what fractions of the remaining emissions budget will be alloca-ted to specific countries. It calls for a cooperative exercise, a central component of which is the linkage of climate policies to other global and national development objectives in a diversity of political, social and economic agendas.
To support this new paradigm, COP-16 established a Green Climate Fund (GCF), which is devoted in part to funding low-carbon development projects (LCPs) in non-Annex 1 countries of the UNFCCC in order to facili-tate adaptation and capacity building. The GCF is meant to support «one or more market-based mechanisms to enhance the cost effectiveness of, and to promote, mitigation actions» (paragraph 80).
The establishment of the GCF is a political pre-requisite for counteracting the distrust that has accumula-ted during climate negotiationsi. Although it made a real contributionii, the Clean Development Mechanism
(CDM) was early suspected by non–Annex 1 countries to be limited by a) the expected difficulties in deploying a global carbon-trading system; and b) the determination of some EU Member States to limit carbon trading by means of «concrete ceilings» i.e. an upper limit on the emissions allowances purchases above their emis-sion quotasiii.
Unfortunately, the GCF in turn risks becoming a new source of misunderstanding, for three major reasons. First, the significant pressures placed on the public budgets of Annex 1 countries in the wake of the financial crisis and the deleveraging process in the banking system cast doubts regarding the amounts of funds that the GCF will effectively mobilize. Second, the re-equilibration of economic forces on the global scale undermines the political acceptability of substantial transfers of funds between the Annex 1 and non-Annex 1 countries Third, in a context of «depression economics» (Krugman, 2008), many non-Annex 1 countries will experience difficulties in implementing their own decarbonization processes owing to strong social resis-tance to carbon pricing, based on concerns about competitiveness and employment and on the prioritization of debt reduction.
However, it is not possible to await the re-emergence of a stable growth regime before making decisions about climate policies. In the absence of rapid redirection of their investment dynamics, emerging
econo-mies will soon be locked into carbon-intensive development pathways, which will reignite the argument for inaction in developed countries, with deleterious consequences for all.
This study has as its start-point the belief that the only way to trigger climate action in adverse eco-nomic conditions is to examine the problem through the lens of «climate-agnostic»
poli-cy-makers. In this perspective, climate action will be worth undertaking if and only if it addresses pressing short-term concerns, such as the stability of financial systems, global economic recovery, and poverty alleviation. This does not mean that climate change will be downplayed. Rather, it means that
1UNFCCC Decision 1/CP.16, para. 1.6, http://unfccc.int/resource/docs/2010/cop16/eng/07a01.pdf#page=2 (Accessed on November 22, 2013)
Introduction: Carbon Finance and the
in line with the political agreement reached at the United Nations Conference on Environment and Development in Rio de Janeiro, Brazil in 1992 (Rio 92), climate change has to be tackled from the perspective of sustainable
deve-lopment, which accords with the spirit of the numerous calls for Green Marshall plans or «Green Growth» that have emerged since the 1990’siv.
The following essay outlines a practical proposal to consider simultaneously the issues of mitigation of carbon emis-sions, financial system stability, and global economic growth objectives. While many other aspects remain to be addressed, the proposal is hopefully sufficiently detailed to constitute a basis for discussion. It contributes to the emerging body of literature on the finance-climate nexus and is addressed both to those scholars who have been involved involved in climate research for a long time and the «climate agnostics». The latter group will maintain a benevolent attitude to climate policies as long as they do not worsen current economic and social conditions. But their active support is needed for an ambitious climate action. They will adopt a positive stance only if they perceive it as coming to grips with urgent problems, even though it is obvious that the ultimate solution to the current problems of the world economy depends of international arena other than the UNFCCC.
The present paper is structured as follows. In the first section, we show that, given the severe transformations required to reach the target of limiting the increase in global temperature to 2°C, climate finance cannot remain a marginalized component of global finance. In the second section, we define the components and the design of a climate-friendly financial architecture. In the third section, we examine the conditions under which this architecture could trigger a virtuous circle between environmental, economic, and macro-financial integrity over the coming decades.
1
Climate policies in
adverse economic conditions?
1.1 Can we afford
low-carbon investments
that are consistent
with the 2°C target?
1.1.1 Orders of magnitude:
incremental vs. redirected investments
An indicator of the challenge that faces us is the gap between the $100 billion per year that Annex 1 countries have pledged for the GCF by 2020 and the $15 billion a year envisaged by EU Member States as the first step in mitigating climate change. Assuming that all the Annex I countries assign the same percentage of their GDP (0.082%) to the GCF, this would lead to an annual $31 billion transfer to non-Annex 1 countries. Although this represents only one third of the commitment made by Annex 1 countries in Copenhagen, it would already repre-sent a one-third increase in the pre-2008 level of overseas development assistance, thereby creating the incentive for simple green washing of existing transfers.
It is all the more embarrassing that the real «funding gap» is significantly higher than that suggested by the majority of current assessments. These assessments are based on the levelized costs of technologies, i.e., the yearly pay-ments, which are equal over the duration of the projects, to cover the capital and operational costs and which include the interest to be paid to the (patient) lender. They rarely designate the time profile of upfront investments, i.e., the cash that will be needed to cover the additional costs of equipment during its incubation phase. One exception is the World Development Report (World Bank 2009), which suggests that the upfront costs (in aggregate form) in the first phase of the transition are 1.9- to 3.2-fold higher than the levelized costs.
Actually, incremental investment costs are only the tip of the «financial iceberg», with the hidden part being the
re-direction of investments flows. Low carbon techniques are not generally end-of-pipe equipment. If the capital cost of a given quantity of «clean» electricity is, say, 30% higher than that of a coal plant, the real percentage of in-vestment to be redirected is 130%. Even more important higher energy efficiency and lower levels of consumption of end-use energy will imply the re-directing of invest-ments, beyond the energy sector, in infrastructure, mate-rial transformation, and the manufacturing sectors. This re-assessment of the orders of magnitude does not mean that the challenge is insurmountable. Instead, it reinforces the necessity of changing the climate policy paradigms.
1.1.2 Funding tensions:
context-dependent and not
specific to the ‘450-ppm scenario’
To understand why and how funding tensions occur, we conducted numerical experiments on the investment and economic implications of the so-called «450-ppm scena-rio» of the International Energy Agency (2014) for twelve countries and world regions: USA, Canada, EU, Rest of the OECD, Russia, the Middle-East, Africa, Brazil, China, India, Rest of Asia, and Rest of Latin America2 .
These experiments3 are heuristic in nature. Given the hy-brid nature of the IMACLIM model we used, we imposed the technical structure of the energy system, as projec-ted by the three WEM scenarios of the IEA, including a CPS (Current Policies Scenario) that was taken as the baseline and the 450 ppm scenario, onto four macroeco-nomic contexts. Thus, we combined, applying the same overall productivity trends as the WEM scenarios, two treatments related to savings rates (endogenous and exogenous) with two assumptions as to the internatio-nal capital flows of capital (exterinternatio-nal accounts balance of all the regions in 2020 or 2100 only). We show that (box n1):
a) Contrary to the «conventional wisdom», the 450-ppm scenario does not imply, at the world level,
2The results are for Year 2035 assuming that the policies start in 2010. Thus, they should be interpreted as meaningful over a t+25 year time-period rather
than for a precise date.
a) Contrary to the «conventional wisdom», the 450-ppm scenario does not imply, at the world level, cumulative higher energy-related investments on the sup-ply and demand sides over the two following decades);
b) Energy-related investments fall drastically in oil and gas (O&G)-exporting regions due to a reduced re-quirement to invest for the expansion of export-oriented oil and gas capacities.
c) In non-O&G-exporting regions, the incremen-tal investment costs for energy represent a modest drain on GDP, although this increment is higher in emerging economies. Thus, they do not impose substantial pressure on the consumption levels of the current generation;
d) The variation of the share of the energy in-vestments in total inin-vestments is a good indicator of po-tential tensions; the higher this ratio, the higher are the pressures on real interest rates and the lower is the pro-bability to get the energy investments funded. It is worth noting, to seize the underlying rationale of our proposal, that the variation of this indicator is less susceptible to differences in the energy scenarios than to differences in the macro-economic setting;
e) The 450-ppm scenario allows for slightly higher economic growth than that in the CPS for the non-O&G-exporting countries, regardless of macroeconomic context.
Box 1 - Orders of magnitude to keep in mind
We sum up here the results of a study conducted with the International Energy Agency of which results are displayed in http://www.centre-cired.fr/spip.php?article1827
a) At the global level, energy-related investment requirements in 2035 are lower in the 450-ppm sce-nario than in the baseline scesce-nario because the lower energy demand in the 450-ppm scesce-nario results in a decrease in energy supply that is higher than the increase in the capital cost of one unit of energy production. Over the short term the magnitude of total incremental investment costs depends upon the magnitude of «negative costs options, which can be mobilized;
b) The increase of these investments is between [14G$ - 42G$] in the US, [35G$ - 65G$] in the EU, [90G$ - 155G$] in China and [45G$ - 58G$] in Indiav. This increase goes along with a structural change of these investments: the share of the demand-side investments multiplied by 2.6 on average between the baseline and the 450 ppm scenario;
c) In percent of the GDP, the orders of magnitude of the incremental investment costs are modest: ([0.1%–0.13%] for the US, [0.6%–0.11%] for the EU, [0.21%–0.34%] for China, and [0.57%–0.86%] for India). The drain is higher in emerging economies owing to the higher energy intensities of their GDP and because they are in a «catch-up» phase with heavy dependence upon energy-intensive sectors (cement, steel, glass, non-ferrous). This does not mean that the transition will be easy. The GDP is not a «putty» that can be reformed at will;
d) The ratios of the maximum to the minimum values of this indicator in our scenarios are: 1.25 for the US; 1.38 for the EU; and 1.63 for China. These orders of magnitude are significant: the higher the ratio, the more severe are the pressures on real interest rates and the lower is the probability to secure the requi-red energy investments or, in the case of political will to impose such measures, the higher are the risks of crowding out other investments. The critical point to note here is that variation of this ratio is less due to differences in the energy scenarios than to differences in the macroeconomic contexts. The baseline scenario itself, in certain contexts, can trigger financial tensions, and this raises doubts regarding its deployment. If we classify the scenarios in descending order of the share of energy investment on total investment, we find first the 450-ppm scenarios provides a hedge against macroeconomic uncertainties with, for almost all regions, a narrower range of values of this indicator and that the 450-ppm scenarios do not always appear as the most financially strained. This ranking is indeed: 450 / 450/ CPS/ CPS/ NPS/ NPS/ 450/ CPS/ 450/ NPS/ CPS/ NPS;
e) This diagnosis is due to the fact that we do not compare the 450-ppm scenarios to optimal baselines changes. This changes the assessment of the impact of climate policies on economic growth. It may be that the CPS baseline will not materialise in the real world, if it does materialise, like in our simulations, the 450-ppm scenario will allow for a slightly higher economic growth with respect to any macroeconomic context in the non-O&G-exporting regionsvi.
This very small gain should not be over-interpreted. Howe-ver, it is driven by mechanisms of interest for all countries: the recycling of the carbon taxes into lower household taxes; b) lower price volatility on oil and gas; and c) higher overall factor productivity thanks to higher energy effi-ciency. It confirms that the very notion of incremental costs, which is useful at the microeconomic level, may misrepresent the problem at the macroeconomic level. The question is not only whether the incremental costs of climate policies can be afforded, but also whether the investments for any energy transition can be af-forded. Thus, if climate policy tools combine with other public policy tools are designed so that they help to over-come the barriers to this affordability without crowding out other productive investments and imposing a huge burden on current consumption, the approach to climate policies in an adverse context is fundamentally changed.
1.1.3 Turning the question upside down
Framing the transition to a low-carbon economy in terms of «how to redirect investments» instead of «how to fund incremental investments» is criticallyvii important for the demand-side investments needed to increase energy effi-ciency and lower the overall need for end-use energy ser-vices. These investments mobilize a wide spectrum of the non-energy sectors, such as the building, transport, and material transformation sectors, as well as part of manu-facturing industry which represent 40% of the global gross capital formation. The investments required for severe de-carbonisation in these sectors are mostly not of the «end of pipe» type. Changes in the production chain and industrial organization are needed, and a «back of the envelope» cal-culationviii shows that accounting for the required invest-ments increases by 20% the incremental investinvest-ments for the low-carbon transition and, more importantly, leads to re-directed investments4 that are 8-fold higher.
This appears to be bad news, since it suggest that climate policies require a prior solution to the larger problem of re-directing savings and investments. But this also prompts us to turn the question upside down, examining it through the lens of the climate agnostic policymakers. These policymakers are primarily concerned by the pers-pective of sluggish or instable future economic growth, because the factors that have led to unstable financial dynamics are still prevalent.
First, the ultra-low interest rate policies of the Central
Banks in advanced countries have intensified the quest for yields higher than «public bonds» conducted by hol-ders of cash deposits (financial departments of multina-tional companies, mutual funds or pension funds). Those holders have moved in and out of capital assets because they are very sensitive to subtle changes in the messages passed in the announcements of central banks that might hint at future changes in interest rates. In short-term money markets prior to 2008, these volatile capital flows were channeled through wholesale funding instruments (ABS and CDOs) issued by shadow banks (broker-dealers, conduits and SIVs5). Although these instruments have di-sappeared, mistrust of the banking system has motivated a continuous build-up of institutional cash pools. The high demand for safe, short-term instruments has provoked an increase in the value of bonds and has mechanically driven down to zero their interest rates. In addition, the purchase by Central banks of bonds for reserve-keeping, resulted in a mass of liquidity that is greater than the va-lue of bonds that can be backed by public assets.
Second, measures that governments and central banks took to deal with the consequences of excessive risk- taking did not succeed in combatting the too-big-to-fail syndrome, while the imposition of a higher equity capital on total assets ratios, in an attempt to hedge against the risk of losing control, remains an unachieved business. Therefore, existing cash pools, estimated by the IMF at $3400 billion in 2010 as compared with $3800 billion in 2007 and $100 billion in 1990 (Polszar, 2011), are held lar-gely outside banks due to widespread mistrust.
Third, firms operate in a business environment that has, since the 1980’s, prioritized shareholder value over maxi-mization of the long-term growth typical of a «managerial economy» (Roe 1994), which accounts for the obsession with liquidity. The profusion of cash in large companies has fuelled bursts in dividend distribution, which have exacer-bated income inequalities and provoked share buyback to boost equity prices. The lack of effective demand and the economic uncertainties have not motivated private savers to maintain investment rates in the industry. The credit de-mands being made by small- and medium-size enterprises are flagging the overcautious credit and lending policies of bank. Investors face a kind of Buridan’s donkey dilem-maix, whereby the donkey died of hunger and thirst
be-cause it hesitated too long in making a decision between eating oats or drinking water, in that they cannot decide in which direction long-term investments should go.
4If, for example, the investment in ULCOs technology for the steel industry is 30% higher than in basic oxygen steel-making with coke and a black
furnace, this represents 100% of the investment that has to be redirected.
Viewed through this lens, ambitious climate policies mobilize a wide spectrum of economic activities, which might leverage a robust economic recovery. The problem of financing posed by the low-carbon transition does not indeed come from a lack of funds but from the inability of the present system of financial intermediation to fund productive investments. Higher and more stable growth would become possible by resorbing excess liquidity through increasing taxes, which seems a highly unlikely prospect, or by matching Treasury bill issuance and the volume of cash pools, which is not recommended in a time of consolidation of public debts, or by expanding the umbrella of the LOLR4 to non-banks, which is also not a palatable option. The only viable solution is the creation of intermediaries that are able to bridge long-term as-sets and short-term cash balances so that savings are invested productively without incurring the risks of excess leverage, maturity mismatch (illiquid long-term assets financed by short-term) and interconnectedness (unsecu-red liabilities of money market funds), which foste(unsecu-red the systemic crisis.
A major question though is whether climate finance can provide such an intermediary while decreasing the capi-tal costs of low-carbon technologies. If it can do this, it will both a) reduce the magnitude of the cash-pools and fuel the global growth engine by shortening the trickling down of current savings to productive investments; and b) help overcome one major obstacle to the energy transitionx. This is all the more timely considering that the pattern of economic globalization is changing. What the OECD development department calls «shifting wealth» is indeed taking a new course. Export-led growth and the building-up of reserves in emerging economies fuelled by excess credit growth in a host of OECD countries is being replaced by more inward-focused growth involving the expanding middle classes in emerging economies and characte-rized by demands for higher wages and services, and for investments driven by urbanization and environmental concerns. This evolution also concerns international fi-nancial intermediation. European banks have retrenched to their home borders since the Eurozone crisis, and they no longer borrow dollars via their US subsidiaries to re-lend worldwide. Faced with this gap in the market, Asian development banks and sovereign wealth funds are step-ping up their activities. A financial model emerges that is based on long-term bilateral financial contracts at agreed-upon prices backed by government guarantees and that involves bond issuers substituting national currencies with the dollar.
Most recently, the BRICS political leaders went a step further. At their Fortaleza Summit on July 16, 2014, they
created a new development bank, funded to the tune of $100bns, with equal participation of the five sponsoring countries; this bank with commence operations in 2016. This is the first significant shift in multilateral public fi-nance dedicated to poor and developing countries since Bretton Woods. The BRICS initiative, in similarity to that of China in the incipient Asian Investment Bank, which has also been funded with $100bns, aims at financing infras-tructure developments within and between developing and emerging countries.
However, having examined the climate policies through the lens of climate agnostics, it is appropriate to once again turn the question upside-down and to see how the linkage with evolution of the financial economic order can really help to achieve the final objective of a low-carbon transition. This demands a precise definition of the linkage between the established economic frameworks of environmental economics for internalizing the climate change externality through carbon price signals.
1.2 Finance, money
and carbon pricing:
a new mental map needed
The Kyoto Protocol (KP) did not result from an ex ante, fully fledged vision of a global climate architecturexi. Instead, it was the outcome of a succession of diplomatic faits accomplis (Bodansky, 2011), inter alia the principle of common but differentiated responsibilities (CBDR in the Article 3.1, UNFCCC, 1992), a quantity-based approach to settle countries’ commitments (exempting developing countries), and the possibilities, as described in Articles 17 and 12 of the KP, for carbon trading between countries and a Clean Development Mechanism (CDM) for generating transfers between developed and developing countries. In the immediate aftermath of the Kyoto conference, the KP was often presented as implying a world carbon market that would generate the same carbon price for imposition on all the carbon emitters. This was not the case but this presentation had the merit of simplicity and was consistent with a mental map in which, as in most modelling exer-cises, carbon markets connect technical abatement cost curves of «GHG abatement factories» all over the world and select techniques in a descending merit orderxii. This mental map contains important landmarks but is in-complete because the abatement factory metaphors: - implies that an Indian peasant indirectly sells permits to a French tourist flying to the Seychelles. This transaction would not necessarily make him better off, asintermediaries might divert part of the carbon revenues before it reaches his pockets. Moreover, the remaining amount might not compensate him for the negative ef-fects on his earnings (linked to higher irrigation and trans-portation costs) and purchasing power of the propagation of higher energy prices throughout the Indian economyxiii; - ignores the wedges driven between technical costs, GDP variations, and welfare variations caused by: i) incomplete and fragmented markets (energy markets, labor, and real estate markets) and a dual economy un-dergoing perpetual restructuring; ii) structural unemploy-ment; iii) the absence of compensation mechanisms for the adverse distributional effects of policies; iv) distorting fiscal systems; v) weak policy regimes; vi) under-protec-ted property rights; and vii) investments risks in an unpre-dictable business environmentxiv. A consequence of these wedges, which are determined by a broad set of domestic policiesxv, is that there is no mechanical linkage between «burden sharing» and «emissions target setting». - assumes that micro decisions are made as a function of levelized costs; this misrepresents the rationale of firms’ decisions in a business regime that makes managers
very sensitive to the variations in shareholder value. In an environment of uncertainty, firms cannot select projects based on their levelized costs, regardless of their short-term impacts on the value of the firm given the magni-tude and the uncertainty of the upfront costs and the time profiles of revenues, net of operational costs. This calls into question the conditions under which car-bon pricing is effective in prompting economic agents to internalize the climate change externality in their beha-viors. We are not in the idealized world of Figure 1 of box 2, where economic agents «see» the entire trajectory of carbon prices reflecting the social cost of carbon along the optimal least-cost pathway towards a climate objec-tive.) In this world, decisions are made today on long-li-ved investments as a function of, say 200 $/tCO2 in Year 2080 even though, as in price trajectory (a) the current prices are 10 $/tCO2. In the real world, economic agents do not ‘see’ the 200 $/tCO2 because long-term markets are missing and because carbon price signals are swam-ped, in infrastructural sectors, by numerous other distor-ting signals (e.g., the price of real estate) and undermined by regulatory uncertainty.
Box 2 - Figure 1: The expectation gap
Agents today consider the carbon price a, and do not anticipate its evolution beyond t1. In a situation in which there is full confidence in public policies and a clear perception of carbon price signals, they see the entire tra-jectory O. If carbon prices are masked by other distorting signals (including low confidence in public policies), a carbon price c > b has to be launched, resulting in the L trajectory
Bridging the ‘expectation gap’ through carbon pricing only would imply very high prices in the short term to cover the “noise” of other signals, as in the price trajectory (b). Such high prices would exacerbate short-term shocks for vulnerable households and economic sectors.
This is why carbon pricing cannot be disconnected from a broader set of economic signals (real estate and land prices, labor markets, regulatory regimes for infrastruc-ture sectors) that would reduce these noises or from overall fiscal reforms that would control its general equi-librium effects.
However, this is intrinsically the realm of domestic poli-cies, and there is an irreducible level of uncertainty about the political capacities of governments to enforce such policy packages over decades. Climate finance, backed by public commitments, circumvents part of these difficul-ties because it comes to say «My government really thinks
that avoiding carbon emissions is something of value but cannot commit to ever-increasing carbon prices. To prove its commitment to combat global warming, it now bes-tows on the industry a partial surrogate for carbon price trajectories, so that they can immediately invest in low carbon infrastructures».
To understand the microeconomic foundations of such a surrogate and the precise mechanism through which it should be enforced in order to be effective, one needs to
revisit the investment logic of enterprises in the current business regime. The basic argument is that projects can be selected as a function of their net present value (i.e., the discounted sum of revenues minus capital expendi-tures and operational costs) only if the time profile of the operating accounts of the firm is not an issue. This arises only in a situation of unlimited financing capacity and un-der a «managerial business regime»6 in which managers have the flexibility to maximise firm long-term growth. In the real world, firms have limited capacity to finance projects (be it via debt, equity or self-finance). Onerous debt servicing lowers their operating surpluses and poses a threat to dividend payments to their shareholders if their bank loses confidence. Thus, the value of the firm is affected, with consequent risk of bankruptcy or hostile takeover.
The key point is that, under uncertainty the «true» cost of an investment for a firm is highly non-linear as illustrated in Figure 2. Alternative which could be profitable might not pass a financial viability test in the absence of bene-volent lender with unlimited lending capacities.
Box 3 - Figure 2: Risk assessment of projects
under a ‘shareholder value’ regime.
Let A be an investment with a higher net present value than B; it should be preferred to B to maximize the long-run value of the firm. But A implies higher upfront costs of which probability density is represented on curve «P». The line D is a «danger line», the level of deficit of operating accounts which will lead to outcomes (debt to equity ratio, dividends distributed to shareholders) that will endanger the value of the firm and its resistance to hostile investors. For firms’ managers, which have in mind that underestimating investment costs by more than 20% is standard in infrastructure investments, projects with high upfront costs put them at risk of crossing this line.
Climate finance comes to move down this «danger line» from D to D*). Comparing the black and dashed surfaces in the curve p (which gives the probability distribution of costs) shows easily that the impact of this downward displacement on risk perception might be very non-linear. The question though is what combi-nation of carbon prices (which decrease the net revenues of B and of carbon finance is more efficient to internalize the social cost of carbon (see infra third chapter).
6The distinction between the “managerial business regime” and the “shareholder business regime” is clarified in Roe (1992). For its implication on
Ultimately, two instruments are needed; carbon pricing as a signal to coordinate decentralized behaviors and car-bon finance to cope with the investment risk in a share-holder business regime. These two instruments should be articulated so as to minimize the lobbying games for exemptions triggered by the fact carbon pricing hurt installed capital stock and vested interests and the risk of arbitrariness in the actual practices of subsidizing the emergence of new low carbon capital stocks.
Fundamentally, behaviors enabled by existing capital stock (mobility, housing modes, location of human sett-lements) result from an implicit social contract relying on cheap energy and environmental innocuousness of fossil energies. That climate policies question this social contract is a real obstacle to their deployment, hence the need for an instrument to facilitate its renegotiation through sending the same carbon price signal to new investments without hitting existing capital.
1.3 In a nutshell,
blueprint of a proposal
Different ways of scaling up climate finance can be envi-saged, and several valuable studies have recently been conducted on this topic. Given current economic context of climate negotiations, we propose that any new
opera-tional system to support this scaling up must satisfy the following requirements:
- avoid the imposition of short term direct addi-tional burdens on taxpayers or naaddi-tional/regional budgets;
- redirect private funding towards safe and pro-ductive low-carbon investments, which involves the invol-vement of the banking system and institutional investors;
- send a signal on the social value of avoided car-bon emissions. In the absence of a global carcar-bon price, a surrogate of a price signal minimises the risk of fragmen-tation and inefficiency of bottom up initiatives.
We believe that a monetary-base instrument may be a good candidate to comply with this challenging terms of reference. We describe in the next section the main pillars of carbon-based monetary blueprint.
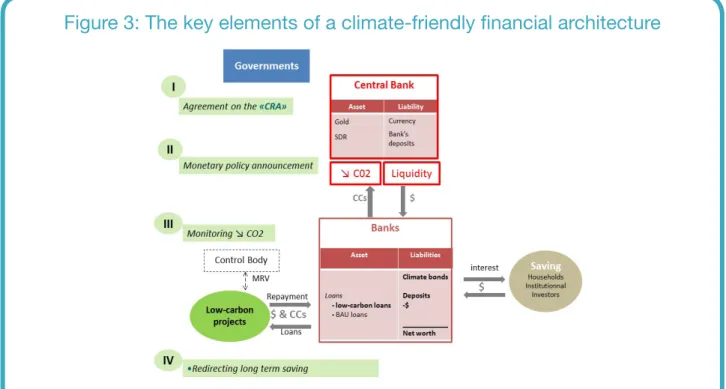
The basic principle of the proposal consists in injecting Central Bank liquidities into the economy provided that the money is used for low-carbon investments. In this sce-nario, governments would provide a public statutory gua-rantee on a new carbon asset, which allows the Central Bank to provide new credit lines refundable with certified reduction of CO2 emissions. The targeted credit facility would makes it possible to extend credit to Low-Carbon
Carbon Investments (LCIs) by lowering the financial risk and making them more attractive for banks and investors. The overall mechanism has to follow four basic principles pictured in figure 3.
(i) The international community recognizes that avoiding GHGs emissions is «something of value». Governments (of Annex 1 countries in a first step) com-mit, on a voluntary basis, but within a framework agreed upon by the UNFCCC, to back a new class of eligible «Climate Remediation Assets (CRA)» recognized by the central bank of their monetary zone. These assets are a quantity of carbon abatement. They are valued at an agreed upon Value of the Climate Remediation Assets (VCRA) per ton of avoided emissions.
(ii) Building on this guarantee, Central Banks of participating open «credit lines» to commercial and deve-lopment banks provided that the money is used to fund LCPs in the issuing country or in any country participating to the system. Then the central bank announces that it will ac-cept as repayment «carbon certificates» (CCs) which testify effective carbon emission reduction. Those CCs are conver-ted into CRAs while entering central bank’s balance sheet. This is tantamount to a money issuance based on the gua-rantee that «something of value» has been created taking the form of low-carbon technologies and infrastructure.
(iii) Those CCs are delivered, administered, and controlled by an independent international Supervisory Body, established under the UNFCCC, like the CDM Exe-cutive Board, to secure the environmental integrity of the mechanism (rules for the attribution of CC, monitoring
of the completion of LCPs) and its developmental effec-tiveness. The latter is guaranteed by the consistency of funded investments with a list of NAMAS selected by par-ticipating countries to secure the alignment of mitigation actions with development policies. The face value of the CC is given by the politically negotiated VCRA.
(iv) Banks or specialized climate funds use the carbon-based monetary facility to back highly rated climate-friendly financial products, such as «AAA» climate bonds, in order to attract long-term saving. Institutio-nal investors could be interested in safe and sustainable bonds instead of speculative financial products for both ethical and regulatory purposes. Part of the CC have to be used to scale up the Green Climate Fund in order to secure multilateral cooperation and the funding of NAMAS without crowding out overseas assistance by each individual country.
In summary, this monetary instrument is tantamount for the central bank to buying a service of carbon emission reduction at a price justified by society’s willingness to pay for a better climate. Carbon-based liquidities can be the-refore be considered as «equity in the commonwealth». The equity pays dividends in the form of «actual wealth» created by productive low carbon investments and averted emissions in the short term, a stronger resilience of the economy to environmental and financial shocks in the longer term. The proposed system would send a carbon price signal (through the SCC) while being politi-cally acceptable because it does not impose direct costs on firms or consumers. It also stimulates mitigation efforts and to stimulate economic growth.
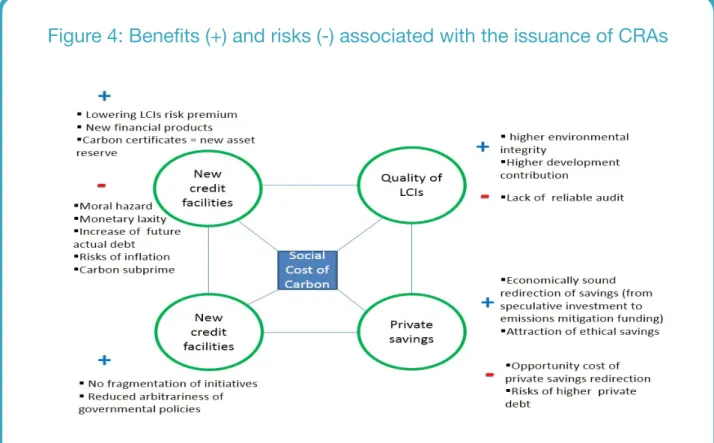
Various systems can be built around the above-mentioned set of principles, and in the next section, we examine in greater depth the four pillars upon which a viable and effi-cient system can be built. However, the set of economic and political constraints imposed on a novel system of this type means that there is a limited range of possibilities. Figure 3 shows that the proposed CRA device carries po-tential risks for: (i) lax monetary creation under the pretext of carbon savings and the real risk of «carbon bubbles» (ii) low-quality LCPs, both in terms of development and carbon abatement; (iii) increases in capital costs in most sectors of the economy; and (iv) economic inefficiencies in regard to the selection of abatement projects.
These concerns have to be addressed in the design of the system and weighed against the efficacy of the system in lowering the risk premium on low-carbon projects, in selecting the most cost-effective projects and in suppor-ting new financial products that attract savings away from speculative investments. We will see that the VCRA is a key component of the device, because it controls the risk of a carbon bubble, while securing the credibility of the new financial products, lowering the costs of fragmentation, and avoiding the arbitrariness of low-carbon initiatives.
This proposed financial architecture rests on four essen-tial pillars that we analyze in turn:
1. An agreement on the VCRA amongst countries participating in the system. Participating countries include both countries that issue climate remediation assets and countries that accept the preconditions for receiving fun-ding for their NAMAS through this channel.
2. A mechanism transforming carbon-based liquidity into real wealth and CRAs, and supporting cli-mate-friendly financial instruments apt to attract long term savings.
3. The establishment of an independent interna-tional Supervisory Body in charge of controlling the effec-tiveness of emission reductions and of rewarding low-carbon projects with low-carbon certificates.
4. Rules for the emission of «carbon based liqui-dity» and for the «access rights» of the recipient countries
to the opened credit lines so as to create a recoiling me-chanism that guides participating countries towards emis-sions trajectories consistent with the +2°C objective.
2.1 The Value of the CRAs:
a trajectory of notional prices
One fundamental notion of the economics of climate change is the Social Cost of Carbon. As recalled in Box 3, its strict definition demands the assessment of climate change damages over the long run to weigh these da-mages against the costs of mitigation. This is a daunting task arousing a lot of scientific uncertainties and ethical controversies hard to overcome overnight. We will use the cousin notion of social value of the avoided emission of carbon, acknowledging that, since COP-19 has confirmed the long-term objective of preventing that mean surface temperature increase by more than 2°C, the international community attaches an implicit value to this target.Box 4: The Social Cost of Carbon its meaning and its controversies
For simplicity sake the social cost of carbon (SCC) is often communicated through a single value (X$/tCO2). Actually, it is a time series of values of the additional damage caused by an additional ton of carbon emissions along an optimal growth pathway (Nordhaus, 2008). At each date of this pathway, the discounted sum of the marginal cost of abatement equates the discounted sum of the marginal cost of remaining damage. It writes: SCCt = ∂W/∂at/∂W/∂ct, with W standing for the welfare, at for abatement, and ct for consumption.
When communicated through an aggregate figure, the SCC is the discounted value of the utility of consumption flows expressed in terms of current consumption. Its estimates by integrated assessment models depend on a large set of key parameters: «pure time preference» – which is at the core of the Stern/Nordhaus controversy (Stern, 2007; Nordhaus, 2007; Weitzman, 2007; Yohe and Tol, 2007; Hourcade et al., 2009) – and also on as-sumptions about long term growth and about the future costs of carbon-free techniques, beliefs about climate change damages. This explains why, even in case of agreement on a pure time preference like suggested in the chapter Social, Economic and Ethical Concepts and Methods of the last IPCC report (2014) it might be difficult to reach a consensus about discount rate (Hourcade, Ambrosi, and Dumas, 2009). In sequential decision-making frameworks where decisions are not made for all the century, it is also sensitive to the date of arrival of new information about damages and technologies (Espagne et al. 2014; Pottier et al. 2014).
Pillars of a financial
architecture aligning climate
and development objectives
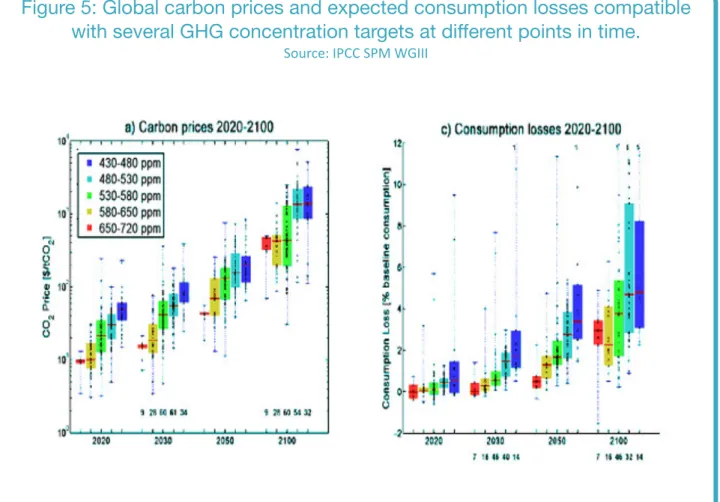
One can compute the trajectory of costs for meeting this target under various assumptions. Uncertainty is still im-portant but results from 900 modeling exercises synthe-sized by the last IPCC report (chapter 3) show ranges of carbon prices which, though still large, provide a corridor within which a political deal can be made. Precisely, Figure
5 shows a maximum likelihood space of carbon prices ran-ging from 28$/tC02 to 50$/tCO2 in 2020 and between 110$/tCO2 and 190$/tCO2 in 2050. Within this corridor, the agreement will be political in nature, and would trans-late the willingness of the international community to pay for climate mitigation.
Figure 5: Global carbon prices and expected consumption losses compatible
with several GHG concentration targets at different points in time.
Source: IPCC SPM WGIII
This explains why, even though the consensus of the last IPCC report on low pure time preferences is accepted, the value of the SCC will remain highly controversial. The range of US$-3 to US$95 per ton of CO2 given by the (IPCC, 2007) implies huge differences in the values in 2030 or 2050. This explains why the relevance of such assessments for policy-making was recently strongly questioned (Pyndick, 2013). This did not prevent the UK’s Department for Environment, Food and Rural Affairs and the US government to use SCC estimates for use in regulatory analyses. However the level of controversy is such that it might be a long way before an agreement on a workable range of values for these parameters is reached at the world scale.
One way out is to interpret the SCC as the «shadow price» of an agreed emissions target, i.e. the marginal cost of meeting this target. In this case, the debate about the discount rate matters less (Ambrosi et al, 2003). This approach comes to admit that, if the international community decides a given emissions target, it attaches impli-citly a cost to overshooting it, hence the notion of Value of Avoided carbon Emissions.
This agreement involves both the initial VCRA, and the rate at which it increases over time. This is important because this rate of growth will partially offset the fact that the discount rate penalizes long lived infrastructure investments. To reconcile the credibility of the economic signal and the necessity to revise initial choices in function of new information, this VCRA should be reassessed every five year without being changed for the past contracts. A political agreement on a VCRA should be easier than on a carbon tax because the VCRA serves as a notio-nal price for the new investments. Contrary to a carbon price that must be paid for each unit of carbon emissions, it does not impose a direct short term extra cost on pu-blic budgets, on firms or on consumers. It does not hurt directly existing capital, has less direct distributive impacts and is therefore less at risk of being blocked by a coalition of vested interests.
Moreover, each government will value the avoided car-bon emissions it in function of its own perception of the domestic co-benefits of climate mitigation (air pollution, benefits of the recycling of the revenues of carbon pri-cing, energy security). Hence countries might agree the same VCRA for different reasons and it is questionable that potential benefits of differentiated VCRA are worth the risk of endless controversies about the rules for this differentiationxvi. A key issue however, is to hedge against the vagaries of exchange rates of which ups and down might undermine the efficiency and the reliability of the system for guiding long term decisions. The VCRA would be nominally similar to the 35$ per ounce of gold under the Bretton Woods regime. But, since the exchange rates vary, its value in national currencies will be submitted to variations large enough to generate time inconsisten-cies in the investment projects. To limit this problem, the world VCRA could be the weighted average, in purchasing power parity (PPP) of national prices expressed in dollars. This PPP price system (reviewed every five years) would minimize the inefficiencies caused by the volatility of exchange rates.
2.2 Transforming
carbon-based liquidity
into real wealth
The previous sections have defined both the price and the amount of carbon-based liquidity issued by Central Banks of countries with high emissions. The key is then to secure that this carbon-based liquidity supports the creation of «real wealth» as collateral of carbon assets.
We have seen the basic principle: Central Banks accept carbon certificates as repayment of their credit instead of cash and enhance the risk-adjusted profitability of low carbon investments (including the risk of bypassing some bankruptcy line for the investor). There are many possible circuits to do so because there are many types of financial intermediaries and many types of enterprises. For clarity sake, we start describing the «banking canal» which will likely be the most important.
2.2.1 From the credit lines of the
Central Banks to carbon assets:
the circuit of balance sheets
Building on the political agreement on the VCRA, a new class of carbon assets is created by the Central Bank of which the value and the maximum supply is determined. Attributing a notional value to carbon assets does not in-fringe on Central Banks independence; this was the case for gold under the Bretton Woods regime.
Table 1 lists the components of a Central Bank balance sheet. Gold, special drawing rights and securities are part of the Central Bank’s assets while currency in circulation and bank’s deposits appear on the liability side.
Backed by government’s commitments, the central bank of a country announces that it open credit lines to fund low-carbon projects and that it will accept as repayment «carbon certificates» (CC) which would testify effective carbon emission reduction, valued at the pre-agreed VCRA.
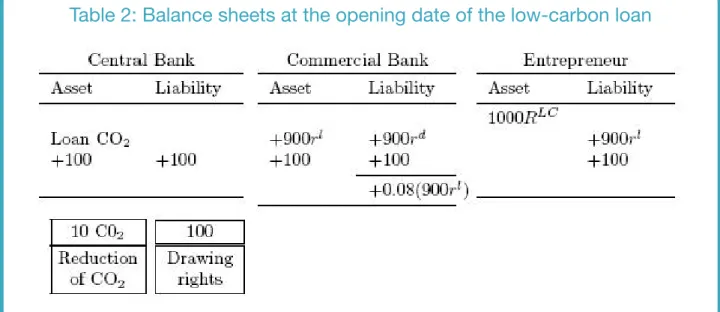
Tables 2 to 5 offer a numerical example of the balance sheet consequences for the central bank and a commer-cial bank of a 1000 loan to a low-carbon entrepreneur expected to realize 10 units of CO2 emission reduction. The VCRA is set at 10, which values the expected emission reduction at 100.
Table 2 indicates that the loan to the entrepreneur is divi-ded into two credit lines. On the first line, the commercial bank mobilizes 900 deposits remunerated at rate rd and lends 900 at rate rl. The second line refers to the 100 cre-dit equivalent to the value of expected emission reduction
lent by the central bank to the commercial bank that can be paid back with certified carbon certificates. Pruden-tial rule about minimum capital requirement only applies to the first credit line (900 rl), as a zero coefficient risk is applied to the line coming from the carbon-based liquidi-ties. As a result, the net worth increase of the commercial
or development bank should only be 0.08*900rl instead of 0.08*1000rl as in the conventional case of full funding by the bank of the project.
The central bank owns a new 100 claim on the commercial bank. Thanks to the 1000 loan, the entrepreneur launches the project with expected returns RLC which makes the total expected revenues amounting to 1000 RLC. Two lines appear in the liability side of the entrepreneur’s balance sheet corresponding to two types of debt: 900 will be paid back with the monetary revenues of the projects and at the interest rate rl, and 100 will be paid back with carbon certificates7.
7 In this example, we assume the project realizes the 5 units of expected emission reductions.
Table 2: Balance sheets at the opening date of the low-carbon loan
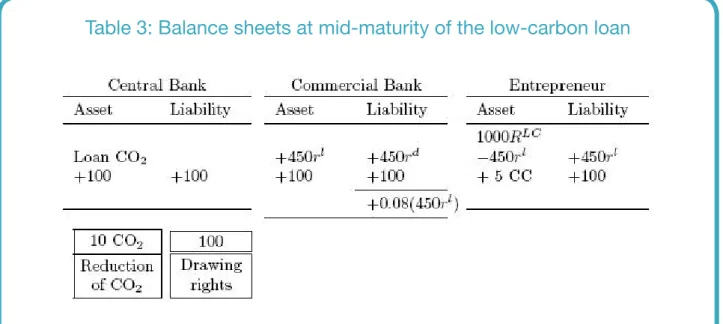
During the payback period of the loan, the entrepreneur gradually reimburses the loan with monetary revenues of the project as suggested by Table 3. As the project realizes
emission reductions, the entrepreneur receives carbon certificates.
Table 3: Balance sheets at mid-maturity of the low-carbon loan
At the end of loan maturity, Table 4 indicates that the entrepreneur has paid back the entire 900 debt with the monetary revenues of the project and has gotten 10 CC for the emission reduction her project has achieved8.
Capital constraint for the commercial bank gets null and only the second credit line remains unchanged in the balance sheets.
Table 4: Balance sheets at the end of the payback period of
the low-carbon loan before the asset swap
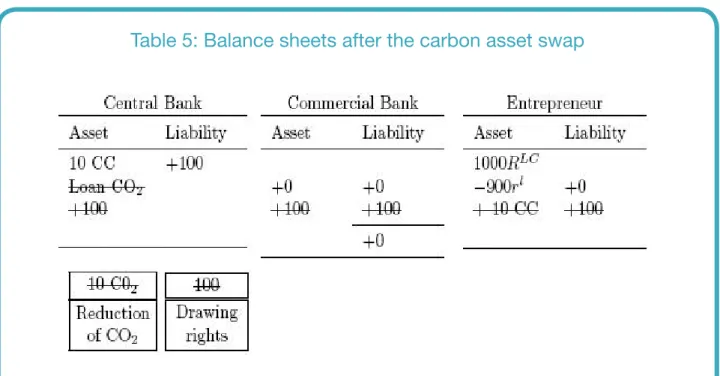
The last step of this process is an asset swap performed by the central bank who accepts the 10 CC as repayment of its 100 financial claims. The second credit line corres-ponding to the «carbon debt» of the low-carbon project
can thus be cancelled out (Table 5). Total amount of car-bon-based liquidities that the central bank can still issue is reduced by 100.
Table 5: Balance sheets after the carbon asset swap
For commercial banks in a process of deleveraging, this new credit facility will encourage them to expand their lending activity, instead of accumulating liquid reserves. An additional regulatory incentive for the banks might be that a high share of LCPs in their loan book would make their balance sheet less risky, since this share of their assets would benefit from a public guarantee. One could even imagine that they keep part of the carbon assets. Banks would then be rewarded with a reduction of the cost of their prudential capital constraint. They could in-deed be allowed to apply a zero risk coefficient – in the same fashion as for sovereign bonds – to the fraction of the loan that comes from central bank liquidities backed upon the value of emission reduction. Along the same line, it could be envisaged that firms keep the carbon as-sets in their balance sheet to improve their value in terms of the Capital Asset Pricing Model.
2.2.2 Using a diversity
of canals to redirect savings
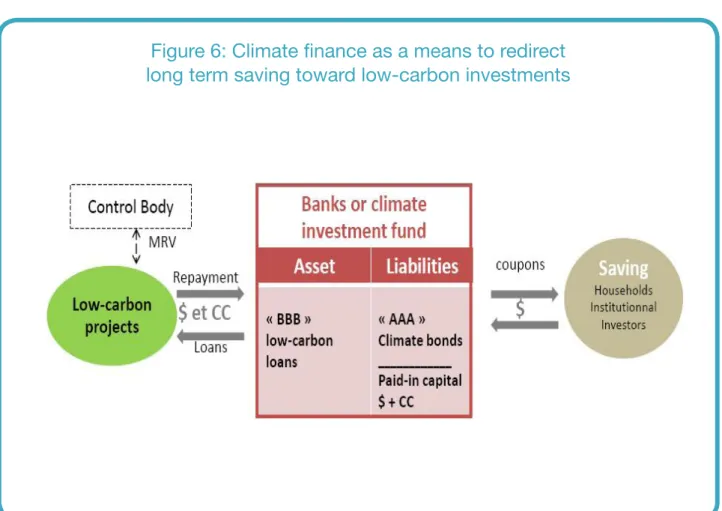
To upgrade climate finance at the necessary level, most of the financial intermediaries should be mobilized: pu-blic private and corporate pension funds, insurance panies, endowments and investment management com-panies. All these intermediaries could, as illustrated in Figure 6, use the carbon-based monetary facility to back highly rated climate-friendly financial products attractive for households and institutional investors and «climate colored» (like the green bonds of the World Bank).
Figure 6: Climate finance as a means to redirect
long term saving toward low-carbon investments
One problem to be overcome is then the general behavior of financial intermediation and the lack of investor appe-tite for illiquid assets. The «CRA» mechanism presented in this note helps increasing the risk-weighted profitabi-lity of climate-friendly projects but its success will depend upon the capacity of using it to propose financial chan-nels adapted to the economic rationale of the diversity of actors involved in the energy systems on the demand and supply side.
Behavior of Long term investors
Many institutional investors have very long-term liabilities or obligations to their beneficiaries (e.g. a typical DB pen-sion funds 12-15 years duration, insurers 7-15 years dura-tion, charities and universities endowments 10+ years). This has led to expect that these investors will be the natural providers of long-term capital. However, the evi-dence suggests that their investment horizons are much shorter-term. The World Economic Forum (2012) shows that long-term investors invest 9% of their portfolio in illiquid assets and that they could, in theory, more than double this exposure while still meeting their liability and regulatory constraints. In a recent survey of leading Euro-pean pension funds, respondents estimated their ideal in-vestment horizon at 23 years and their actual inin-vestment
horizon at 6 years. Mercer (2010) found studying the in-vestment horizon of 822 equity funds that 63% of equity managers having received a long term mandate from ins-titutional investors had shorter investment horizons than what they claimed to have when promoting their fund to institutional investors.
Retained earnings, shareholders and debt financing The four key sectors in the low carbon transition (power generation, petroleum industry, buildings, and transpor-tation) mobilize, in various proportion, private and public capital, and within private capital, a diversity of actors from large International Corporation to the households. According to the IEA (IEA, 2014), about half of the power generation capacity currently installed globally is owned by state-owned entities, 44% being owned by private companies. Two-thirds of privately owned power genera-tion companies and almost 40% of companies that have majority state-ownership are publicly listed on stock mar-kets. In principle, these are available to investors globally and sensitive to the shareholder value. In OECD countries, most of the investment in new capacity by private com-panies listed on stock exchanges is self-financed (retained earnings).
The petroleum industry is hold by large private companies in the OECD countries whereas the dynamics of the trans-portation sector depends critically of a mix of private and public initiatives and this of the building sector from a mix of large corporation and small craft enterprises.
State-owned companies present similar financing pattern. For the IEA: the choice of financing is primarily driven by
commercial considerations and largely independent of other policy targets. More important are the differences
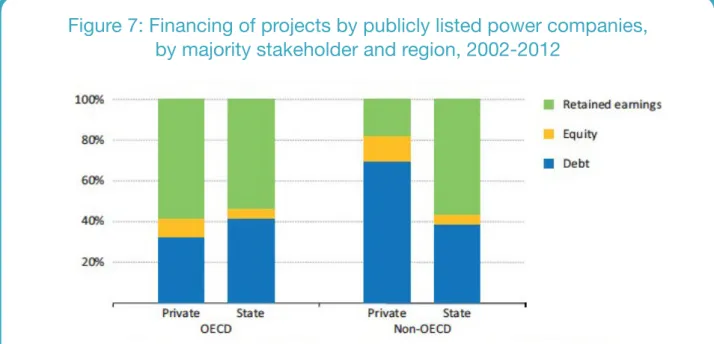
between behaviors of private and public actors between OECD countries where the role of shareholder in domi-nant and non-OECD countries where, for example, private companies rely mainly (about 60-70%) on debt financing;
Figure 7: Financing of projects by publicly listed power companies,
by majority stakeholder and region, 2002-2012
Sources: IEA analysis and 2° Investing Initiative, based on data from Bloomberg Professional Service.
Basically, for whatever investment, companies can tap into two sources of financing: they can issue equity shares, bonds and increase their debt or they can reinvest profits rather than distributing dividends. Financial institutions have thus two levers to make a difference.
- to influence the companies’ capex strategy, via shareholder activism; this does not require any divest-ment nor significant sectorial reallocation but rather an engagement to reorient existing companies with a «gree-ner» use of their profits in terms of reinvesting;
- to impact the deal flow i.e. the demand of financing and the offer of projects entering in the pipe-line. They can do so via investment banking activities and changes in portfolios allocation fostering green projects and technologies — this is the now well-known green bonds narrative, to provide more «green capital» to raise more «green projects».
Both these levers are ultimately in the hands of
finan-cial institutions but the credibility of climate policies and the technical modalities of public intervention matter to facilitate the matching between the offer of low carbon projects and the amount of savings in search of invest-ment opportunities.
The role of banks and institutional investors
In this process the main role of banks is to channel capital, following three levers.
- the origination of credits, for which they very much depend on the demand in the real economy and the amount of relevant projects waiting to be financed, but where they also have the opportunity to innovate, having an emulating effect on demand.
- The issuance of bonds and asset backed secu-rities (ABS) to finance their balance sheet, or help their clients. The influence on capital allocation is limited here and mainly driven by the clients’ demand, but specialized
teams working to create new products can help to remove this obstacle;
- In their daily role of retailers of investment pro-ducts, they influence savings allocation since most clients just follow their bankers’ advice, primarily based on fis-cal argument, and to a lesser extent on the nature of the investment. The climate-friendliness of the investment could be thus a good marketing teaser for certain catego-ries of households.
There is no standardized data related to these three levers available in banks annual reports. No comprehensive ‘offi-cial’ data exist today but the analysis of the breakdown of companies’ sales by segment for a universe of 8.000 companies show that the exposure to low-carbon en-ergy technologies of a typical equity stock index is very limited (typically 2-5%, even if considering rail and nuclear as «green technologies»). The share of green assets for fixed-income, based on a reference bond index, is even smaller, if one does not account the green public invest-ment financed with general purpose sovereign bonds. Using the benchmark indexes as proxies for institutional investors’ sector allocation, as well as statistics on stra-tegic asset allocation, can provide with a rough estimate of the exposure of institutional investors to green assets, which appears to be very limited compared to brown as-set exposure, and mostly relate to listed equities. There is no available data today to go much further and notably investigating banks’ portfolios, but simplified proxies sug-gest similar patterns.
Ultimately the upgrading of climate finance at the required level will be facilitated by a coordinate effort on informa-tion and data collecinforma-tion. This is the role of the actors of the financial system to form a «club» to carry out this effort.
2.2.3 Securing the environment
contribution of LCIs
The problem to be solved for triggering aware of LCIs is not to guarantee the additionally of each project on a case-by-case basis from a counterfactual (and controver-sial) baseline, as in the CDM, but to guarantee «statistical additionally» (Trextler, 2006) i.e., that the pool of projects supported by the system reduces emissions relative to what would have happened otherwise.
Focus on very high accuracy in the allocation of carbon certificates would end up freezing investments while laxity would lead to subsidizing projects that would have been funded anyway. The trade-off between these two risks
will ultimately emerge from a learning process through which the independent authority will progressively refine the assessments in function of experience and local cir-cumstances (but with no retroactivity on past allocations). It can be secured in three steps:
• Step 1. Define a taxonomy of LCIs (size, techno-logy, time horizon) and determine the potential abatement (volume and time profile) to be expected from projects in each category of this taxonomy (for example a unitary capacity of hydropower) in each country. This potential abatement will be used for every project deployed in the country during the considered time period. This number will be conventional in nature, but its determination can rely on modeling exercises that provide orders of magni-tude of the emission reductions associated with the main types of LCIs (hydro-power, solar or wind power plants, transport infrastructure, building insulation, etc.) under various growth scenarios. These values can be reasonably bound by systematic model comparison and sensitivity analysis, through an international expertise committee.
• Step 2. Calculate the expected present value of the avoided emission generated by the project: let A(t) be the CO2 abatement yielded by the project at each point in time, t0 the date of start date of the project, N the pro-ject expected lifetime and i the discount rate, the present value of the CO2 abatements can be computed as follows:
, and the number of allocated carbon certificates will be:
• determine the amount of carbon certificates allocated to each kind of LCI by dividing the present value of projects by the VAE at the date of project launching and, to secure the environmental integrity of the system by retaining only a share of this value:
In the same spirit, the monitoring of projects (with pos-sible invalidation of part of the CCs) has to rely on simple observable criteria to assess the degree of effectiveness of the project in comparison with its ex-ante objectives (in terms of carbon emissions when this is possible, in terms of indicators of physical achievement for transportation or building infrastructure).
To set up such a process with a minimum degree of cre-dibility would certainly have been risky two decades ago.
But we can now benefit from the experience of the Clean Development Mechanism CDM) which is to date the largest carbon offset mechanism in the world – with over 7,000 projects.
This experience show first the importance of upfront transaction costs as a major barrier for the implemen-tation of projects. They include Project Design Docu-ment (PDD) developDocu-ment, validation costs (internal and auditing), UNFCCC registration fees and the cost of
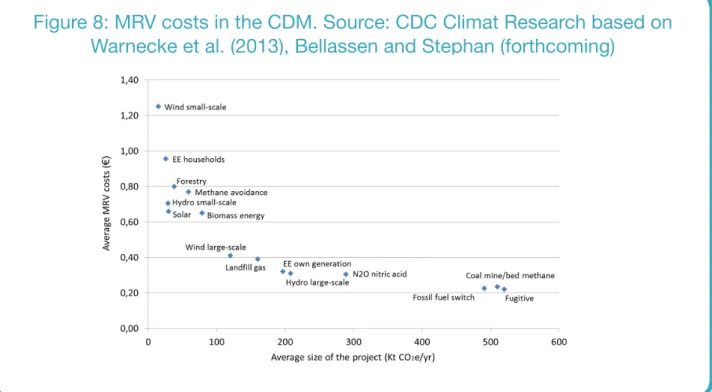
instal-ling the monitoring system. They vary drastically depen-ding on the type of project and technologies and on the concerned sectors, ranging from EUR 37,000 for small-hydro projects to EUR 434,000 for very large adipic acid N2O projects. They are also submitted to scale effects (Figure 8) which indicates the necessity of specific pro-cedures so as to avoid the crowding out of small scales projects which might be the projects yielding the most of development benefits in some countries and regions.
Figure 8: MRV costs in the CDM. Source: CDC Climat Research based on
Warnecke et al. (2013), Bellassen and Stephan (forthcoming)
Building upon (Shishlov and Bellassen, 2012) to strike a right balance between lowering transaction costs and the incentive to operate low carbon investments, it is possible to define criteria for a MRV process aiming at statistical
environment additionally of the system. Without deli-vering key in hands solutions, box 5 gives an integrated vision of these criteria.
Box 5: Securing the statistical additionality of LCIs: a few principles
a) Standardization of the baseline setting: necessary to demonstrate the additionally of the project represents half of upfront transaction costs in the CDM (Guigon, Bellassen, and Ambrosi 2009). Abandoning project-by-project assessment will result in a significant reduction of transaction costs without undermining the environmental integrity of the system because, given the accumulated CDM experience, it is possible to set up acceptable «counterfactuals» like those developed by the Program of Actions (PoA) framework as well as in the new sectorial crediting mechanisms. Based on discussions about country-wide standardized baselines for different sectors in COP11 (Montreal), COP16 in Cancun provided the possibility for host countries to submit standardized baselines concerning all or part of the country (UNFCCC 2011). This will overcome the problem of information asymmetry between the project developers and the regulator. But the problem of the regulator will be the level of the stringency of the baseline and/or of the share of CC allocated for an expected deviation from the baseline not to discourage the supply of projects without compromising the environmental integrity of the program (Millard-Ball 2013).