HAL Id: hal-03113808
https://hal.archives-ouvertes.fr/hal-03113808
Submitted on 26 Jan 2021
HAL is a multi-disciplinary open access
archive for the deposit and dissemination of
sci-entific research documents, whether they are
pub-lished or not. The documents may come from
teaching and research institutions in France or
abroad, or from public or private research centers.
L’archive ouverte pluridisciplinaire HAL, est
destinée au dépôt et à la diffusion de documents
scientifiques de niveau recherche, publiés ou non,
émanant des établissements d’enseignement et de
recherche français ou étrangers, des laboratoires
publics ou privés.
A machine-learning approach for automatic classification
of volcanic seismicity at La Soufrière Volcano,
Guadeloupe
Alexis Falcin, Jean-Philippe Métaxian, Jerome Mars, Éléonore Stutzmann,
Jean-Christophe Komorowski, Roberto Moretti, Marielle Malfante, François
Beauducel, Jean-Marie Saurel, Céline Dessert, et al.
To cite this version:
Alexis Falcin, Jean-Philippe Métaxian, Jerome Mars, Éléonore Stutzmann, Jean-Christophe
Ko-morowski, et al.. A machine-learning approach for automatic classification of volcanic seismicity
at La Soufrière Volcano, Guadeloupe. Journal of Volcanology and Geothermal Research, Elsevier,
2021, 411, pp.107151. �10.1016/j.jvolgeores.2020.107151�. �hal-03113808�
A machine-learning approach for automatic classification of volcanic
seismicity at La Soufri`
ere Volcano, Guadeloupe
Falcin Alexisa,b, M´etaxian Jean-Philippeb,c, Mars J´erˆomed, Stutzmann ´El´eonoreb, Komorowski
Jean-Christopheb, Moretti Robertob,e, Malfante Mariellef, Beauducel Fran¸coisb, Saurel Jean-Marieb, Dessert C´elineb, Burtin Arnaudb, Ucciani Guillaumeb,e, de Chabalier Jean-Bernardb, Lemarchand
Arnaudb
aCorresponding author, falcin@ipgp.fr
bUniversit´e de Paris, Institut de physique du globe de Paris, CNRS, F-75005 Paris, France cUniv. Grenoble Alpes, Univ. Savoie Mont Blanc, CNRS, IRD, IFSTTAR, ISTerre, 38000 Grenoble, France
dUniv. Grenoble Alpes, CNRS, Grenoble INP, GIPSA-Lab, 38000 Grenoble, France
eObservatoire volcanologique et sismologique de la Guadeloupe, Institut de physique du globe de Paris, F-97113 Gourbeyre,
Guadeloupe
fUniv. Grenoble Alpes, CEA, LIST, F-38000 Grenoble, France
Abstract
The classification of seismo-volcanic signals is performed manually at La Soufri`ere Volcano, which is time consuming and can be biased by subjectivity of the operator. We propose here a machine-learning-based model for classification of these signals, to handle large datasets and provide objective and reproducible results. To describe the properties of the signals, we used 104 statistical, entropy, and shape descriptor features computed from the time waveform, the spectrum, and the cepstrum. First, we trained a random forest classifier with a dataset provided by the Observatoire Volcanologique et Sismologique de Guadeloupe that consisted of 845 labeled events that were recorded from 2013 to 2018: 542 volcano-tectonic (VT); 217 Nested; and 86 long period (LP). We obtained an overalll accuracy of 72%. We determined that the VT class includes a variety of signals that cover the VT, Nested and LP classes. After visual inspection of the waveforms and spectral characteristics of the dataset, we introduced two new classes: Hybrid and Tornillo. A new random forest classifier was trained with this new information, and we obtained a much better overall accuracy of 82%. The model is very good for recognition of all event classes, except Hybrid events (67% accuracy, 70% precision). Hybrid events are often considered to be a mix of VT and LP events. This can be explained by the nature of this class and the physical processes that include both fracturing and resonating components with different modal frequencies. By analyzing the feature weights and by training a model with the most important features, we show that a subset of the 14 best features is sufficient to obtain a performance that is close to that of the model with the whole feature set. However, these best features are different from the 13 best features obtained for another volcano in Peru, with only one feature common to both sets of best features. Therefore, the model is not universal and it must be trained for each volcano, or it is too specific to the one station used here.
Keywords: Seismology, Volcano, La Soufri`ere, Classification, Machine Learning
1. Introduction
Volcanoes are highly complex nonlinear systems where their behavior reflects a diversity of internal hidden processes that can lead to their unrest and eruptive activity. Volcano monitoring rests on the paradigm that various observable parameters have a more or less direct causal link to these complex processes and to the internal variables of the system, as well as to a series of forcing and modulating processes. Although unrest is often linked to rate-dependent processes, this is not always the case, as sometimes just the absence or presence of some observables can provide very valuable insight into the dynamics of these systems. Volcano monitoring is crucial to evaluate the state of activity of a restless volcano, and to determine the likelihood of a
future eruption, along with the probable temporal window of such an occurrence. Hence, volcano monitoring constitutes one of the pillars of the scientific methods that contribute to mitigate the risks to human societies. Among the many disciplines used in volcano monitoring, which include geodesy, geochemistry, gravimetry, geophysical imaging, thermal monitoring, acoustics, and physical volcanology, seismology remains one of the most widely developed. Seismology can provide an often overwhelming wealth of high-resolution continuous real-time data from networks of sensors deployed on volcanoes, both on land and on the sea floor.
Optimal seismic monitoring requires the detection, location, magnitude quantification, and classification of large numbers of volcano-seismic signals, and it must be performed daily at volcano observatories. Given the vast progress in volcano seismology in recent decades and the high-resolution monitoring of numerous very active volcanoes, there is now a corpus of knowledge that allows the association of the different types of seismic signals recorded at volcanoes to different source processes with greater certainty (e.g., McNutt et al. (2005); Chouet and Matoza (2013); McNutt and Roman (2015)). Thus, together with other monitoring data, volcanic seismicity constitutes a fundamental tool to track the evolution of the dynamics of volcanic activity in time and space, to provide timely forecasts of the likelihood of future scenarios in a context of uncertainty, which is intrinsic to the behavior of such complex nonlinear systems. The occurrence of some events might be precursors of volcanic eruptions, and as such, can be used in early warning systems.
However, while the detection work is now mostly automatic, the classification task is often performed manually. The manual classification tasks are limited, and there are several factors that can decrease the robustness of the labeling. The classification is based on the subjective judgement of the operator, so if the task is performed by several people, the resulting classification criteria can vary from one person to another. This work also has to be carried out in near real-time, while there can be huge amounts of data to deal with, in particular during periods of volcanic crises, when the scientific interpretation needs to be rapid and timely, so that the required advice can be provided by scientists to the authorities to assist in their decision-making processes that are designed to mitigate the risks to the population and the critical infrastructures. With the constantly increasing volumes of data and the limitations of the manual classification, the development of automatic tools using a machine-learning approach to rapidly classify these volcanic seismic signals as accurately as possible is essential for spatio-temporal interpretation and process modeling of the data, as well as for pattern recognition. This methodology thus has the potential to significantly improve the timely tracking and analysis of volcanic unrest and the forecasting of its possible evolution.
The machine learning methodology consists of training an algorithm to do a task, here assigning a seismic class to a volcanic event. However, rather than analyzing the waveform of the signal, we transform this signal into a set of features that describes its characteristics. Then, the role of the machine-learning algorithm is to define boundaries in the feature space that specifically correspond to each class considered. To best differentiate each of the classes, the features must be carefully chosen and must represent the variability of the signals. Here, we chose to use the feature set proposed by Malfante et al. (2018), which provides a general and precise description of transient signals. These have been shown to be efficient, and they also allow us to investigate whether features selected at one volcano can be used for another volcano.
One of the first attempts to automatically recognize earthquakes was made by Allen (1978), who built a decision tree, through which 70% of the events could be recognized. Many studies in recent years have considered such automatic classification of volcano seismic events, and many techniques have been used. Benitez et al. (2006) used hidden Markov modeling for continuous classification of four classes, and they reached an overall accuracy of 90%, where the overall accuracy is the percentage of correct predictions out of all of the predictions made. Hibert et al. (2014) used fuzzy logic and a method based on decision rules to distinguish rockfalls from volcano-tectonic events, and they obtained a success rate of 92%. Langet (2014) used logistic regression and a support vector machine, through which they obtained 90% and 92% good results, respectively. At Ubinas Volcano, Malfante et al. (2018) tried a random forest (RF) and support vector machine classifiers, and here they obtained 92.5% and 92.1% overall accuracy, respectively. Titos et al. (2018) used a deep neural network approach with seven classes of volcanic events, and they reached 94% overall accuracy. At the same time, Curilem et al. (2018) used spectrogram cross-correlations in conjunction with the K-nearest neighbors algorithm with five classes of volcanic events at Llaima Volcano (Chile), and they reached an overall accuracy of 95%. Finally here, Bueno et al. (2019) used a Bayesian neural network for classification of five classes on two volcanoes, through which they achieved an excellent performance of
92.1% when the two datasets were merged, and they also showed that their uncertainties were linked to the state of unrest of the volcanoes.
The algorithm used in the present study is a RF classifier, because this allows a wide range of features to be handled without overfitting and producing a model that is too specific to the data used for the training, and it also gives information about the feature importance. This kind of algorithm has already been tested and has been shown to be powerful not only in a volcanic context. Provost et al. (2016) proposed an automatic classification method based on the computation of 71 features, and they used a RF classifier. They focused on classification of events recorded near the Super-Sauze landslide (southeastern France). They obtained 93% sensitivity for this classification, where the sensitivity defines the proportion of the true events that are correctly classified. Using several stations, Maggi et al. (2017) presented an operational automatic classifier based on a RF algorithm for monitoring at the Piton de la Fournaise Volcano. They defined eight classes of seismic signals used a multi-station approach, and they reached peak performance when running on a three-station combination (92% good classification). Hibert et al. (2017) also proposed a RF classifier for binary classification of seismic signals (rockfall, volcano-tectonic) that were recorded at the Piton de la Fournaise Volcano. They obtained results from 90% to 99%, which depended on the size of their training dataset. Malfante et al. (2018) proposed a large set of features for representation of the seismic signals, as 34 features in three representation domains: temporal, spectral, and cepstral domains (where cepstral describes the periodic properties of a signal, as commonly used in speech processing, and as obtained by computing the Fourier transform of the logarithm of the signal spectrum). Hence they defined 102 features, which they used to train a RF classifier with signals from Ubinas Volcano in Peru, and with which they obtained 92.5% overall accuracy. Malfante et al. (2018) also showed that with only the three best features included, they obtained 84% overall accuracy, while with the 13 best features they obtained 90% overall accuracy with their RF classifier.
Some studies have refined their initial classification into a second step of automatic classification. Langer et al. (2006) classified five volcanic classes at Soufri`ere Hills Volcano, in Montserrat. They obtained a fair performance, where 70% of the automatic signal classification was consistent with the manual classification of the signals. From an analysis of the misclassified events, however, they found that for most of them, the original a-priori classification was incorrect. They carried out a re-analysis by hand of the seismic traces recorded at different seismic stations. Then they trained the classifier again using this new information, and here obtained a success rate of 80% good classification. Hammer et al. (2013) proposed a hidden Markov model for detection and classification of events in an alpine context. They applied their model to the continuous signal and they managed to detect 97% of the events and correctly classified 87% of them. At first they distinguished two classes, as earthquake and quarry-blast, although they were also able to detect rockfalls using a threshold criterion to flag a poor match between the incoming signal and all of the defined classes. Langet (2014) showed that the current classification for Kawah Ijen Volcano with eight classes was not adapted. By using an unsupervised classification, they showed that with the data and features available, only five classes were clearly distinguishable.
In this paper, we have applied a method following that developed for the first time by Malfante et al. (2018), where we have automatically classified volcano-seismic events recorded from 2013 to 2018 for La Soufri`ere Volcano. In Section 2, we present La Soufri`ere Volcano, in terms of its historical eruptive activity, then we detail how the detection and classification work was performed at the observatory, and finally we discuss the dataset used in our analysis. Then, in Section 3, we present the method and discuss the large set of statistical features that were calculated in the three domains to represent the seismic signals (i.e., temporal, spectral, cepstral domains). In Section 4, we test the robustness of the actual classification, and then we refine the classification by adding new classes in the analysis. We show which features are the most useful to differentiate classes of volcanic eathquakes at La Soufri`ere, and finally, we compare these important features with the most valuable features defined by Malfante et al. (2018) for Ubinas Volcano.
2. Data
2.1. La Soufri`ere de Guadeloupe
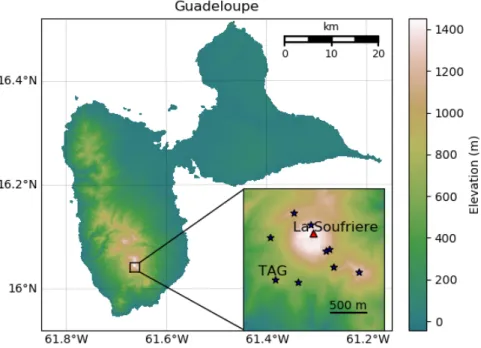
La Soufri`ere de Guadeloupe is an active and hazardous volcano located on the island of Basse-Terre in Guadeloupe in the Lesser Antilles (Figure 1). It is currently monitored by the Observatoire Volcanologique et Sismologique de Guadeloupe - Institut de Physique du Globe de Paris (OVSG-IPGP). Numerous magmatic and nonmagmatic eruptions have occured in its history. The current andesitic dome was formed in the last major magmatic eruption in 1530 CE (Boudon et al., 1988, 2008). The volcano also had several historical nonmagmatic phreatic or hydrothermal explosive eruptions in 1690, 1797-98, 1809-12, 1836-37, 1956, 1976-77 AD (Komorowski et al., 2005). The last one of these was particularly violent, and required the evacuation of more than 70,000 people for 6 months; it was also associated with a major controversy in the scientific community (Komorowski et al., 2005; Hincks et al., 2014; Komorowski et al., 2018). After this crisis, the volcanic activity gradually declined, and in 1990 it reached its lowest level since the start of seismic monitoring in 1950 (Komorowski et al., 2005; Villemant et al., 2014; Jessop et al., 2019; Moretti et al., 2020). Since 1992, its seismic fumarolic and thermal unrests has increased gradually (Komorowski et al., 2005; Villemant et al., 2014)(OVSG-IPGP, 1999-2020), to reach its highest level of seismic energy on April 27, 2018. This resulted in the strongest volcano-tectonic earthquake recorded (M4.1) since the phreatic eruption of 1976-77, with an associated episode of deep-sourced magmatic degassing (Moretti et al., 2020). Although the release of seismic energy has decreased markedly since the January-April 2018 period of elevated unrest, in August 2018, the seismicity of La Soufri`ere de Guadeloupe was characterized by the periodic occurrence of earthquake swarms of low energy, with numerous volcano-tectoninc (VT) and Nested signals, and only rare long-period (LP) signals (OVSG, 2018-2020). Between August 2018 and the end of April 2020, 37 of these swarms were recorded by the OVSG (based on the swarm quantitative criteria defined by the OVSG), for a total of 7114 identified signals with a mean of 192 ± 187 events per swarm (minimum, 13; maximum, 1014). Although of low energy, this continuous heightened seismicity represents a very significant challenge for event identification, classification, and interpretation by the observatory staff, to provide tracking in an efficient and timely manner during this unrest.
2.2. The OVSG classification
Currently at OVSG, the detection work is carried out mostly automatically using a short-time average over long-time average algorithm. The operators on site review the detected signals daily, considering the several stations located at different distances from the volcano summit, and they determine the magnitude and location of the signals. By observing the seismograms at different stations, they can assign a class to detected events according to the nomenclature used by the OVSG. The vast majority of volcanic signals have very low magnitudes (i.e., mostly negative) and short durations, and they are very often discernible by only two stations, unlike tectonic earthquakes, which are generally recorded by more stations and by stations from larger networks.
Although five main types of signals are recognized in the data analysis by the observatory (Moretti et al., 2020), only three main classes are readily distinguishable on the continuous seismic traces during the daily analytical protocol, which are defined as: VT events, Nested events, and LP events. The two other classes, as Hybrid events and LP monochromatic events (or Tornillos) are included as VT and LP events, respectively. Figure 2 shows the typical waveforms, spectrograms, and Fouriers spectra of these events. Volcano-tectonic, or high frequency, earthquakes: These events have a high frequency content similar to tectonic earthquakes. Chouet and Matoza (2013) defined their frequency range as 5 Hz to 15 Hz. For La Soufri`ere, a characteristic peak is often observed between 10 Hz and 15 Hz. The waveform has a very impulsive P-wave arrival. These are brittle failure events that are associated with stress changes due to magma movement (Chouet and Matoza, 2013).
Nested earthquakes: These events appear as small packets of several seismic signals in which successive events appear within the coda of each other. They are not concomitant or precursors to any particular phenomenon (Moretti et al., 2020). Nested events consist of a sequence of several volcano-seismic events with very short inter-times, very often as more than 6 seismic events in a short sequence (10 s)(Ucciani , 2015; Moretti et al., 2020). These Nested events are mainly composed of VT high-frequency events, but not
always, as they can also sometimes be Nested LPs. The different signals in a Nested event are not always similar, in terms of amplitude or waveform. The source process related to this class is not well understood, and indeed, these events are specific to La Soufri`ere Volcano. Waite et al. (2008) indicated the presence of ’drumbeat’ LP earthquakes at Mount St. Helens Volcano, which are characterized by a restricted range of inter-event times and amplitudes compared to the more typical activity and highly similar waveforms. These properties require a persistent source location, a nondestructible or rapidly renewing mechanism, and a physical system that involves small oscillatory deviations from near equilibrium conditions. These events of Mount St. Helens Volcano are similar to the Nested events of La Soufri`ere de Guadeloupe; although the Nested events are mostly VT and the drumbeats are LP, the different signals are similar in terms of amplitude and waveform.
Long-period or low-frequency earthquakes: The frequency range for these events is generally taken as 0.5 Hz to 5 Hz (Chouet and Matoza, 2013). At La Soufri`ere, these LP events are characterized by a relatively narrow spectral content, at around 4 Hz. Their waveforms are characterized by the emerging arrival of P-waves, with the S-phases not identifiable. LP events can be generated by the resonances of fractures, dykes, conduits, or cavities during the propagation of magmatic or hydrothermal fluids (Chouet , 1988). Some other models without fluids or resonance have been proposed, such as trapped waves in loosely consolidated and shallow layers of the crust (Bean et al., 2008). Another model proposed by Bean et al. (2014) indicated that LPs might be generated by slow rupture of the nonconsolidated volcanic material itself.
2.3. Catalog
The learning base used for this analysis comes from the catalog built by the OVSG, which is available on WebObs (Beauducel et al., 2020). WebObs is a web-based tool that performs integrated, centralized, and automated real-time volcano monitoring. This system mainly offers a modular database for equipment network management, with a dozen evolving dedicated periodic tasks for each monitoring technique, such as for seismology, geodesy, and geochemistry, with automated execution of periodic tasks and web-form interfaces for manual data input/editing and export (Beauducel et al., 2020). Our study period extended from 2013 to 2018. The information available on WebOBS indicates the first arrival times, the event durations, and the classes.
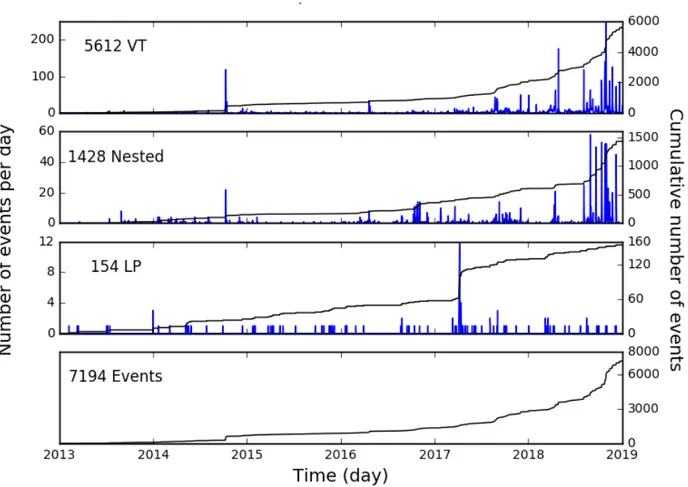
In this paper, we focus on the data recorded by one component (i.e., the vertical component) of one station. We selected the three-component Piton Tarade station (TAG; nanometric Taurus Trillum compact 120S, at 100 Hz), a historic station of the La Soufriere monitoring network that is located closer than 1 km from the summit. This station is protected from external disturbance and is not subject to strong winds, and we have the data for 84% of the days for the period from 2013 to 2018. The catalog contains 7149 events, 78% of which are VT events, 20% are Nested events, and 2% are LP events, and hence these three classes are highly unbalanced. Figure 3 shows the distribution of these events over time. The distributions of the VT and Nested events are correlated with a much greater number of VT events than Nested events. The LP events are evenly distributed over time, except for the swarm of a few dozen events that occurred in April 2017. Conversely, the distributions of the VT and Nested events are not constant over time, and we observed a strong increase in their occurrence at the end of 2018.
3. Processing methodology
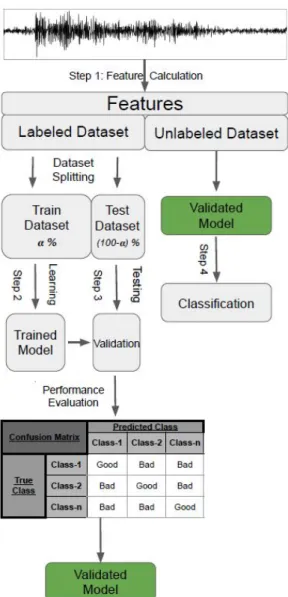
In this section, we detail our workflow (Figure 4) to automatically classify the three classes of events; namely, VT, Nested, and LP events. There are several main steps involved here.
Data: Here our data consist of labeled windowed seismic waveforms. The waveforms are extracted from the continuous signals, with the detection time and duration provided by the OVSG. These waveforms are associated with a label linked to the physical phenomenon that triggers the event.
Pre-processing: First, we need to eliminate the poor quality signals from our dataset. Not all of the events recorded by the network are observed well at station TAG. We need to visually check if the events are correctly labeled, and this is easier if the signals are strong compared to the ambient noise. A criterion
was therefore applied to keep the signals with a significant signal-to-noise ratio at TAG. The criterion we applied was to compare the mean squared amplitude of 20 s of noise recorded before the event with the mean squared amplitude of the event considered. We kept those signals with a signal-to-noise ratio greater than 1.5. Then, we applied a bandpass filter between 0.8 Hz and 25 Hz to keep only the signals related to the event. Finally, signals were normalized by the maximum of 1.0, so that the model can be applied to all observations regardless of their amplitudes.
Feature Calculation: The data used for learning are not the windowed waveforms, but a set of de-scriptors that are extracted from the windowed waveforms. The features are important as they carry the information related to the classes. Here, we used the features proposed by Malfante et al. (2018). The description of the features is given in Table 1. We grouped these into three categories, as statistical features (n = 9), entropy-based features (n = 9), and shape descriptors (n = 16). These 34 features were computed in three representation domains of the signal: the temporal domain, the spectral domain, and the cepstral domain. The cepstral domain describes the periodic properties of the signal, as commonly used in speech processing, and it is obtained by computing the Fourier transform of the logarithm of the signal spectrum. Using a large number of features allows the signals to be represented in many ways, while keeping as much of the information about the signal as possible. Another advantage of using features is to reduce the dimension of the data, while keeping the information contained in the signals. Here, the input vector has a dimension of 34 x 3 = 102, whereas dealing with the corresponding 10-s-long waveforms sampled at 100 Hz would imply a vector size of 10 x 100 = 1000. We do not expect to need all of the features, as some provide redundant or useless information; e.g., the length of the signal is the same whatever the representation domain.
Training: The training step consists of defining the boundaries between the different classes in the feature space. For this, the learning algorithm automatically selects the most discriminative features among the 102 features. We chose to train the model from a given percentage of the labeled data, and we used the rest of the data to test the reliability of the model constructed. The algorithm used here is the RF classifier, which is available in the python scikit-learn library (sklearn.ensemble.RandomForestClassifier).
This algorithm involved decision trees that split the parameter space into simple regions. A decision tree (Quinlan , 1986) is an algorithm with a tree-like structure where each internal node corresponds to a test on a subset of the features, each branch represents the outcome of the test, and each leaf node is a class label. The random forest algorithm (Breiman , 2001) consists of a collection of decision trees. This works as follows: first subsets are randomly selected from the learning dataset, then a decision tree is constructed for each subset, and a prediction result is obtained for each tree. Then, the most frequent prediction is selected as the final prediction. The biggest advantage of the RF over a single tree is that the overfitting problem is attenuated by averaging out the predictions from all of the trees. With this algorithm, we also gain information about the feature importance. This information is obtained by computing the relevance score of each feature in the training phase. This allowed us to reduce the number of features by selecting only the most important. We performed a grid search in the hyper-parameter space to determine which features were the best, and we selected the hyperparameters around which the classification score was stable, which are given in the captions to Tables 2 and 4.
Test: To test the model, we performed cross-validation, by randomly partitioning the labeled dataset between a training dataset and a testing dataset. The random selection of the training dataset and the testing dataset was performed several times, to have statistically valid results. Due to the low number of LPs compared to the other classes, we made sure that the number of LPs was balanced in all partitions. We can modify the partition coefficient, and thus see the effects of the size of the training set on the performance of the model. To analyze the results, we computed the mean confusion matrix obtained after several trials (i.e., at least 10) by comparing the predicted classes with the real classes of the test dataset. We also considered three metrics: the accuracy, the precision, and the overall accuracy:
Accuracy = #GoodP redictionClassi #T otalT rueClassi
P recision =#GoodP redictionClassi #T otalP redictedClassi
(2)
OverallAccuracy = #GoodP rediction
#T otalEventT estDataset (3)
These metrics provide information on the specificity (i.e., positives) and sensitivity (i.e., false-negatives) of the model. If the precision is too low, it means that there are too many bad predictions compared to good ones, and thus it means there are too many false-positive outcomes. If the accuracy is low, it means that most of the data of a class have been badly predicted, and thus it means there are too many false-negative outcomes. The overall accuracy gives information on the general performance of the model.
Classification: Once the model is trained and reliable, we can apply it on a new dataset, as either labeled or not labeled. This is the operational part of the process, which we do not include as part of this study.
4. Results and analysis
4.1. Performance of initial classification
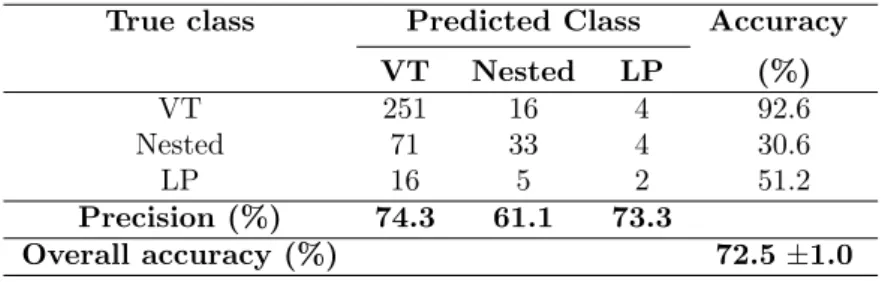
Here we present the performance of the automatic classification using the three classes of events: VT, Nested, and LP events. At the TAG station, many of the events detected did not meet the quality criterion of the pre-processing step of the analysis described earlier. The OVSG detected 7149 events over the period from 2013 to 2018, although only 845 passed our selection phase. The selection phase allows visual checking of whether the events we analyze were correctly labeled, and for computational reasons, it is easier to process less data. This analysis was thus performed with 542 VT, 217 Nested, and 86 LP events. Table 2 gives the average confusion matrix of the classification that was obtained after 10 trials, with a ratio between the training dataset and the testing dataset of 50:50. For each trial, we randomly selected the data used for the training, and tested the model with the remaining data.
We obtained an overall accuracy of 73% +/-1%, which is relatively low compared to the scores obtained in the literature, some of which reached up to 80% or 90%. Different ratios between the training and the test dataset were also tested. Between the 80:20 and 30:70 ratios, the data were almost the same, at around 73% +/-1%. With more than 80% of the data for the training and less than 30% for the testing, the overall accuracies decreased, and overfitting and underfitting problems started to appear. We detected several trends after analysis of these data.
The score of 73% was largely due to the size of the VT class compared to the rest of the dataset, which masks the poor classification. The accuracy of the VT class was 93%, so most of the true VT events are well classified. However, the precision of the VT class was only 68%, which means that some events of the VT class are also assigned to the true Nested and LP events. In more detail, 71 of the 108 Nested events used for the test were classified as VT events, and 16 of the 43 LP events were classified as VT events. The bad precision of the VT class can be explained in two ways. The VT class is too broad, and contains a variety of signals that cover the characteristics of the Nested and LP events, or on the contrary, there are signals in the LP and Nested classes that have characteristics of the VT class.
The precision of the Nested classification was 61%, so the predicted nested events are not reliable. The accuracy was 31%, so most of the true Nested events are not well recognized. Indeed, 71 of the 108 true Nested events were classified as VT events, and only 4 of the 108 were classified as LP events.
The precision of the LP classification was 73%, which means that the LP prediction was quite reliable, although the accuracy of 51% shows that half of the true LP events are not well recognized by the model. Almost a third of these misclassifications of LP (16 of 43) were classified as VT (48 of 54).
These results show that VT events can be confused with LP events and Nested events, while Nested and LP events are rarely confused with each other. The confusion in the classification of the VT and Nested
events was partly because the Nested events actually consisted of several individual VT events that were separated by very short inter-event times, such that the coda of the first signal was mixed with the onset of the next signal. In the other cases, many VTs appeared to show what looks like an emergent P-phase on the low resolution seismic trace. However, upon zooming in on the waveforms in the Seiscomp3 environment when picking phases, it was clear that this apparent P-wave was a low amplitude initial VT signal that was quickly followed by another larger amplitude VT signal with a P-phase and S-phase. Thus, if Nested events are groups of VT signals, it is highly possible that the discrimination between these is difficult because many of the description features of VT events are also in the Nested events.
At OVSG, the visualization tool used to manually classify events makes this work very complicated, because the spectrograms are not ready available to all of the operators, so some some events might have been misclassified. This would explain the broad variety of signals in the VT class. New visualization of the signals with a spectrogram and new labeling based on the definition of the VT (5-20 Hz) and LP (0.1-5 Hz) frequency domains given here appears to be necessary to improve the performances and the reliability of the models.
4.2. Performance of the refined classification
We visually reviewed all of the 845 events, to check whether some were misclassified and whether we observed signals that showed characteristics different from the classes of events already considered, and if new classes should be introduced into our analysis.
After reviewing all of the signals by hand, two new classes were introduced, the Hybrid class and the LP monochromatic, or Tornillos, class (Figure 5). These types of events were considered by the observatory in the form of a comment, but were not taken into account during the routine daily classification work. Here we now add those two classes into our learning step.
Hybrid earthquakes: Numerous detailed analyses of volcanic earthquakes during recent eruptions (Redoubt, Lahr et al. (1994); Soufriere Hills, Miller et al. (1998); White et al. (1998)) have shown that a distinct category of earthquakes has spectral characteristics of both VT (or high frequency) and LP earthquakes. These have been called Hybrid earthquakes (e.g., Chouet and Matoza, 2013). Typically, they have a high frequency impulsive arrival between 10 Hz and 20 Hz, as typical of VT earthquakes, while the coda is dominated by lower frequency waves in the upper range of the LP frequency spectrum (1.2-2.5 Hz, as at Redoubt, Lahr et al. (1994) and Soufriere Hills, Montserrat, White et al. (1998)). Also, the LP component is observed from the beginning to the end of these events. This indicates a fluid component in the mechanism of rupture. At La Soufri`ere, the Hybrid earthquakes (Figure 5) had a lower frequency coda, at around 5 Hz to 6 Hz, and a higher frequency onset, at around 12 Hz to 14 Hz. Various studies have sought to understand Hybrid events. Lahr et al. (1994) proposed a model halfway between VT and LP, with fragile fracturing processes producing high frequencies, and then the propagation of fluid responsible for the resonance phenomena that produces low frequencies. Neuberg et al. (2000) showed a clear continuum between LP and Hybrid events. Harrington et al. (2007) proposed a model where a simple fracturing process with a very slow rupture velocity was enough to explain these events.
LP monochromatic earthquakes: These Tornillos are a subcategory of LPs; however, their particular waveform (which looks like a screw) makes them easily distinguishable. They were first described as such for Galeras Volcano (e.g., Gomez et Torres , 1997), and have subsequently being identified for many eruptions. We therefore have an emerging wave arrival, with a duration of a few tens of seconds, an almost sinusoidal signal, and a coda that decreases very slowly, and almost linearly. Their Fourier spectrum has a characteristic peak, which was at around 4 Hz for La Soufri`ere. On the spectrogram we saw that the resonance lasted longer than for the LPs. A model of self-oscillations of fluid filling a cavity was proposed as the physical process that generates Tornillos seismic signals (Gomez et Torres , 1997; Konstantinou , 2015). In a recent experimental study, Fazio et al. (2019) suggested that gas pressure gradients trigger the event that regulates the slow decay of the coda, whereas fluid resonance in small structures controls the frequency content of the signal. This type of event was introduced into the analysis for the observatory in 2001, but was removed from the classification routine later.
Table 3 shows the classes that were newly assigned to our catalog. First, 89 Nested events and 15 LP events were reclassified as VT events. Then 39 VT events and 22 Nested events were reclassified as LP
events. Only 9 VT events and 1 LP event were reclassified as Nested events. Also, 2 Nested events and 26 LP events were reclassified as Tornillos events. Finally, 151 VT events, 45 Nested events, and 8 LP events were reclassified as Hybrid events.
We note that very few of the Nested events remained in this class (59 of 217), with a lot reclassified as VT events (89 of 217). The Nested events are a relatively unique type of seismo-volcanic event, because these are specific to the La Soufri`ere seismicity. Nothing exactly like this type of event has been reported in the literature, so to maintain a certain robustness in the new labeling, and not to confuse this type of event with the VT events, we chose an explicit criterion to decide whether these belonged to one or the other class. We considered the events as Nested when they clearly presented several signals in the waveform. As the reviewing of the events was carried out using only one station, it is possible that an event clearly presents several signals at one station but not at another, because these Nested signals can be different in terms of their amplitudes and waveforms.
When we created a model with these new classes and the same ratio between the training dataset and the test dataset of 50:50, as previously here, the overall accuracy increased from 73% to 82% +/-2%. This shows that this new classification was much better for the automatic process. Furthermore, by looking at the results in detail (Table 4), we see that the classification of certain classes was significantly improved. With different ratios between the training dataset and the test dataset, as 90:10, 70:30, 30:70, and 10:90, the accuracies obtained were (respectively): 83% +/-4%, 83% +/-2%, 82% +/-1%, and 77% +/-2%; i.e. they remained similar.
Then we looked at the results class by class, to analyze the errors. These were significantly lower for the Nested class, with 68% and 79% for the accuracy and precision, instead of the 31% and 61%, respectively, for the previous classification. One true LP event was classified as a Nested event, and vice versa. Five Nested events were classified as VT and five as Hybrid. This confusion was seen when there were few Nested signals in the event (i.e. 2 or 3) and when one of these signals was much more energetic than the others, whereby the model recognized the energetic signal. The six events that were incorrectly classified as Nested events were also particularly noisy events.
The Tornillos events were well classified by the model, with 100% and 87% accuracy and precision. There was 1 true Tornillo event classified as an LP event. Once again, this kind of error in the model is easily understandable, because the Tornillo class is a subclass of the LP class. The biggest difference between these two classes is the long monochromatic resonating coda in the Tornillos events. Depending on the shape of the coda, we can choose to classify an event as LP or Tornillo, and sometimes this distinction was hard to make. The other badly classified Tornillo was labeled as Nested by the model; it was the most noisy Tornillo event of the catalog. In addition, the various tests carried out with different sizes of training sets showed that there was no need to have a large training database to effectively recognize the Tornillos events.
The accuracy of the predicted LP events was increased from 51% to 84%. One true VT event, one true Nested event, one true Tornillo event, and seven true Hybrid events were classified as LP events. The precision of the LP events was increased from 73% to 80%. One true LP event was classified as a VT event, and one as a Nested event, with six classified as Hybrid events. LP events can be confused with VT, Hybrid, and Tornillo events. The confusion between the LP and VT events decreased a lot compared to the previous classification, with 16 LP events of 43 classified as VT events before, and only 1 of 49 with this new classification.
With the new calssification, the VT class showed an accuracy of 91% and a precision of 87%. While the accuracy was slightly decreased from 93%, the precision was increased from 74% to 87%. These results show that the variety of the signals in the previous VT class was reduced.
The hardest events to classify were the Hybrid events. The accuracy was 67% and the precision was 70%. Hybrid events were only confused with VT and LP events, with 25 true Hybrid events classified as VT events, and 67 as LP events. Here, 25 predicted Hybrid events were true VT events, and six predicted Hybrid events were true LP events. Hybrid events were more often confused with VT events than LP events. This might be explained by the impulsive and high frequency onset of the Hybrid events, which resulted in confusion between Hybrid and VT events more frequently than for LP events. We saw that the Hybrid events with a low frequency component that was much more energetic than the high frequency component tended to be classified as LP events. These results reinforce the idea that Hybrid events are a continuum
between VT and LP events. Although the scores of the Hybrid classification were weaker than the scores of the others classes, this is still encouraging because these events are the most difficult for a human operator to recognize.
This new classification appears to be very effective, and allowed the automatic algorithm to distinguish the different earthquake classes more easily than the previous classification. Moreover, two new earthquake classes, as Hybrid earthquakes and LP monochromatic earthquakes (Tornillos), were introduced to better characterize the seismicity. There is a wealth of literature data and well-documented active volcanic se-quences that have culminated in eruptive activity that underscore the fundamental roles that these Hybrid earthquakes and Tornillos earthquakes have to understand and track the complex nature and dynamics of seismogenic processes for an active volcano.
4.3. Feature performance
Selection of the features is a decisive step to obtain good classification results. Here, we were interested in the possibility to reduce the number of features, while keeping the most representative features, and also to determine which features were important for which class. It is also possible that some features were not optimal for the classification, if they were highly correlated. To keep the intrinsic physical properties of the features, we did not transform or project features in a new space (e.g., with principal component analysis). RF allows determination of the weight of each feature in a classification, using the impurity score. The impurity score is related to the loss of accuracy when a feature is removed. The greater the importance of a feature in the classification, the higher the loss will be in the performance of the classification upon its removal. However, following this method, a feature that has a low importance is not automatically meaningless, as two features can be correlated, and only one will have a high score. More information about the feature importance can be found in Menze et al. (2009).
In Figure 6, we show the weights of the 102 features for the binary classifications (i.e., each class against all of the other classes) and for the classification with all of the classes. We can see that the most important features changed depending on the class. The best features for recognizing all of the classes are the minimum of the signal (29), the index of central energy (6), the maximum energy (24), the rate of attack (19), the maximum signal (30) in the time domain, the mean kurtosis (9), the root mean square bandwidth (7), the standard deviation in the frequency domain, and the rate of decay (20) in the cepstral domain. These nine features had weights greater than 2% in the classification, and came from the three representation domains (i.e., temporal, spectral, cepstral domains), so they underscore the relevance of using these representation domains.
For the Hybrid class, the best features had lower weight compared to those of the best features obtained for the other classes, at 4.9% importance compared to 8.2%, 8.7%, 8.2%, and 7.5% importance for the VT class, the Nested class, the LP class, and the Tornillo class. Also, the best feature of the Hybrid class was less discriminant than the best feature of the other classes. This is consistent with this class being the most difficult to classify correctly.
Among the 10 best features of the least numerous classes, as the Nested class and the Tornillo class, there were only 3 and 1 of these features, respectively, in common with the 10 best features of the classification with all of the classes. This means that the most discriminant features of a class do not necessarily have great importance in the general classification, and this depends on the number of events in these classes. Conversely, 7 of the 10 best features of the VT class, 6 of the 10 best features of the LP class, and 5 of the 10 best features of the Hybrid class were among the 10 best features of the general classification. In particular, the maximum of energy (24) in the temporal domain was in the 10 best features of the VT, the LP, and the Hybrid classes, and also for the classification with all of the classes. This means that this feature is useful to distinguish these classes from the rest of the dataset, and also to discriminate between these three classes.
In Figure 7, we show the mean overall accuracies obtained after 10 trials of the classification using only the best feature, and then adding the second best feature, and so on until every features has been added in the classification analysis. With the nine best features having an individual weight greater than 2%, the mean accuracy rapidly converged above 80% after the use of these features. To reach the mean accuracy score of 82.5% of the full set of 102 features, the 14 best features need to be used for the learning: after 14, adding new features did not change the score significantly.
This set of features has already been used by Malfante et al. (2018) for Ubinas Volcano in Peru. Malfante et al. (2018) obtained 84.4% accuracy with only the three best features, and needed the 13 best features to reach a score (90.3%) that was close to the accuracy obtained with all of the features (92.5%). Here, we compared the 13 best features obtained by Malfante et al. (2018) with the 14 best features that we determined in our analysis. It is interesting to note that among the 13 best features of the Ubinas Volcano analysis by Malfante et al. (2018), only one of their features was in our set of 14 best features. This was the mean of the signal (2) in the cepstral domain. This difference can be explained by the different type of seismic activity recorded at Ubinas Volcano compared to the seismic activity of La Soufri`ere de Guadeloupe. The seismicity of La Soufri`ere Volcano was dominated by VT and Hybrid events, whereas Ubinas Vaolcano was dominated by LP and Tremor events. It also suggests that the model we built is specific to La Soufri`ere Volcano, or at least the kind of seismicity shown by La Soufri`ere Volcano. It would be interesting to test the performances of the features on a volcano with the same kind of seismicity as La Soufri`ere de Guadeloupe, that is characterized by a very active and extensive hydrothermal system. Another possible explanation for the difference in the best features might be that the 14 best features obtained at the TAG station for La Soufri`ere Volcano are more specific to the station position than to the volcano itself. On the basis of the complex internal structures of volcanoes, the TAG station might show strong and specific site effects that distort the signals (e.g., high attenuation, strong anisotropy, waveguide effects, high density contrasts). The very small number of events that passed the selection phase (i.e., only 845 of the 7194 detected by the OVSG met the quality criterion at station TAG) is probably an illustration of this phenomenon.
To overcome this issue, different approaches can be used. The first one, although not very efficient and time consuming, would be to apply the same single-station approach to other stations at La Soufri`ere Volcano and see whether the best features are identical for all of the individual stations. A second approach would be to use a multi-station approach, using the features computed from different stations to take into account the variability of the same signal all over the volcano, as in Maggi et al. (2017). These authors reached their best performance by using a combination of features from three stations. A third approach would be to use a multi-station approach of a higher level, with multi-station specific features. These features would be derived from signals obtained from network-based analyses that involve data from multiple sensors, such as cross-correlations or higher-order cross-correlations. We could compute the features based on these cross-correlation in the three representation domains (i.e., temporal, spectral, cepstral domains).
5. Conclusions and prospects
We have applied an automatic classification method based on machine learning, and more specifically on a RF classifier, for the analysis of the volcanic seismicity of La Soufri`ere Volcano of Guadeloupe. The principle is based on the calculation of a large set of descriptors from the waveforms of the volcanic seismic events that satisfy the quality criteria. This set of descriptors, or features, is then used to train a RF classifier using all of the seismic events for their classification into the main classes of seismic signals that have causal links to specific dynamic volcanic processes in the system. After training of the model on a subset of the seismic signals from the catalog of volcanic seismic events built by the OVSG, we obtained a good classification rate of 73% on the subset of seismic signals that remained to be classified. However, after a review of the results class by class, we showed that the variability in the VT class was too broad, and that it caused distortion for the recognition of the two other classes. We therefore manually reviewed and relabeled all of the events, which resulted in the addition of two new classes that had been recognized by the observatory, but were not taken into account during the daily classification protocol. After the introduction of these new Hybrid and monochromatic LP (Tornillo) classes, the performance of the automatic classification increased to 82.50%. Most of the errors made by the model were due to the confusion between Hybrid events and VTs and LPs. This result reinforces the idea that Hybrid events are a continuum between VTs and LPs. The relatively poor scores obtained with the initial automatic classifier highlighted the presence of inaccuracies in the classification. The much improved accuracy that we achieved after refining the classification shows that the machine learning helps to build a robust catalog of volcanic earthquake signals that are classified into process-related classes. We explored the importance of the features in our model to determine which features of the full set of 102 performed best for the recognition of these classes of volcanic earthquakes at
La Soufri`ere de Guadeloupe that characterized the period analyzed (i.e., January 1, 2013, to December 31, 2018). We showed which features are the most useful depending on the class we want to recognize for La Soufri`ere Volcano. We also showed that with only a subset of the features (i.e., 14 of 102), we can obtain a substantially similar score. Finally, we compared our best features for La Soufri`ere Volcano with the best features presented by Malfante et al. (2018) for Ubinas Volcano, and showed that the most important features are different (except one) between these two volcanoes. Therefore, it is important to maintain this whole feature set to test the method on another volcano.
In the future, we will apply this methodology to data obtained from the complete volcanic seismic network for La Soufri`ere, which is composed of about 20 sensors, to improve the accuracy. Futhermore, it will be interesting to repeat the exploration of these features on other stations or for other volcanoes that have activities that are similar to that of La Soufri`ere de Guadeloupe, to see if the same features are among the most important, or at least if the same features are useful for the same classes of volcanic seismic events. More importantly, by training a classification model on a specific time period for La Soufri`ere Volcano or any volcano and applying this to a subsequent time period, it will be possible to detect any changes in the nature, dynamics, and/or patterns of seismicity by quantifying and following with time the progressive or rapid loss in accuracy of the classification algorithm. This approach was reported by Hibert et al. (2017) at Piton de la Fournaise Volcano, and by Malfante et al. (2018) at Ubinas Volcano. We will test this at La Soufri`ere Volcano to monitor for any changes in the pattern of seismicity that preceded the major unrest phase of January to April 2018 (Moretti et al., 2020) with the seismicity that has been recorded from after April 2018 that showed characteristic swarm activity of numerous low-energy events (OVSG-IPGP, 1999-2020). It will be possible to test whether all swarms show similar patterns, or whether, as qualitatively observed, some swarms are dominated by certain classes of events, and also whether this pattern changes within the swarm.
In this paper, we have proposed a new machine learning classification scheme that is based on direct human examination and analysis of each signal. It is fundamental to test the performance of a supervised classification using the machine learning algorithms to discriminate the different signals. Our final goal is to implement this model in the OVSG in Guadeloupe, and also to test it for other active volcanoes that are monitored by IPGP, such as Montagne Pel´ee in Martinique (OVSM-IPGP, 2020), and even in the context of the major submarine eruption offshore of Mayotte that has been ongoing since 2018 (REVOSIMA, 2019-2020).
Our results show that these machine learning tools can represent a major component of any volcanic monitoring system for an active volcano. By providing rapidly significant real-time insight into the nature, style, and patterns of seismicity at active volcanoes in a state of unrest while optimizing human resources, these tools will allow scientists to gain access to new knowledge to understand and track the complex nature and dynamics of the nonlinear processes of active volcanoes. Hence, this approach contributes to improved forecasts of the likelihood of future eruptive activity, and to improve the societal responses to crises and risk mitigation in a context of increasing exposed assets and vulnerability.
6. Acknowledgements
The code used in this work is available at https://github.com/malfante/AAA.
We would like to acknowledge the numerous staff members that have indentified and localized seismicity at La Soufri`ere Volcano over the last three decades: S. Acounis, D. Amor`ese, C. Antenor-Habazac, S. Bazin, D. Bertil, M-P. Bouin, J Delacaze, S. Deroussi, T. Didier, A. Domiquin, M. Feuillard, B. Figaro, G. Hammouya, D. Jessop, T. G. Kitou, C. Lambert, F. Massin, S. Moune, J-Y Nadeau, A. Nercessian, and J. Pierre, V. Robert. We also thank X. B´eguin, A. Bosson, D. Lafon, Didier Mallarino, P. Boissier, C. Brunet, and A. Ali Fahmi for computer engineering, code development, and data management for the WebObs platform.
The Soufri`ere de Guadeloupe full waveform seismicity data is available from the IPGP Data Centre (https://www.ipgp.fr/fr/centredonnees/centre-de-donnees-ipgp) and
reasonable request at: infos@ovsg.univ-ag.fr
We thank the IPGP for general funding to Observatoires Volcanologiques et Sismologiques (OVS), INSU-CNRS for the funding provided by Service National d’Observation en Volcanologie (SNOV), and the Min-ist`ere pour la Transition Ecologique et Solidaire (MTES) for financial support, and the FEDER INTERREG Cara¨ıbes program for funding the West Indies regional seismic and geodetic monitoring network with the VSAT satellite communications. Part of G. Ucciani’s postdoc was funded by the project Vers la Plateforme R´egionale de Surveillance Tellurique du futur (PREST), which was co-funded by INTERREG Cara¨ıbes for the European Regional Development Fund. This study was also supported by the European Union Horizon 2020 Research and Innovation Programme, under grant agreement No 731070 (EUROVOLC project). This study contributes to IdEx Universit´e de Paris ANR-18-IDEX-0001.
7. References
Allen, R. V. (1978). Automatic earthquake recognition and timing from single traces. Bulletin of the Seismological Society of America, 68(5), 1521-1532.
Bean, C., Lokmer, I., & O’Brien, G. (2008). Influence of near-surface volcanic structure on long-period seis-mic signals and on moment tensor inversions: Simulated examples from Mount Etna. Journal of Geophysical Research: Solid Earth, 113(B8).
Bean, C. J., De Barros, L., Lokmer, I., M´etaxian, J. P., O’Brien, G., & Murphy, S. (2014). Long-period seismicity in the shallow volcanic edifice formed from slow-rupture earthquakes. Nature geoscience, 7(1), 71-75.
Beauducel, F., Lafon, D., B´eguin, X., Saurel, J. M., Bosson, A., Mallarino, D., & Nercessian, A. (2020). WebObs: The volcano observatories missing link between research and real-time monitoring. FrEaS, 8, 48. Bell, A. F., Hernandez, S., Gaunt, H. E., Mothes, P., Ruiz, M., Sierra, D., & Aguaiza, S. (2017). The rise and fall of periodic ‘drumbeat’seismicity at Tungurahua volcano, Ecuador. Earth and Planetary Science Letters, 475, 58-70.
Ben´ıtez, M. C., Ram´ırez, J., Segura, J. C., Ibanez, J. M., Almendros, J., Garc´ıa-Yeguas, A., & Cortes, G. (2006). Continuous HMM-based seismic-event classification at Deception Island, Antarctica. IEEE Transactions on Geoscience and remote sensing, 45(1), 138-146.
Boudon, G., Dagain, J., Semet, M., & Westercamp, D. (1988). Carte g´eologique au 1/20000e du Massif volcanique de la Soufriere, 1 sheet Notice explicative de la carte g´eologique au 1/20000e du Massif volcanique de la Soufriere-Carte G´eologique. Editions BRGM, Orl´eans: BRGM-CNRS-DRM-IPGP, 1-43.
Boudon, G., Komorowski, J. C., Villemant, B., & Semet, M. P. (2008). A new scenario for the last magmatic eruption of La Soufri`ere of Guadeloupe (Lesser Antilles) in 1530 AD Evidence from stratigraphy radiocarbon dating and magmatic evolution of erupted products. Journal of Volcanology and Geothermal Research, 178(3), 474-490.
Breiman, L. (2001). Random forests. Machine learning, 45(1), 5-32.
Bueno, A., Benitez, C., De Angelis, S., Moreno, A. D., & Ib´a˜nez, J. M. (2019). Volcano-Seismic Transfer Learning and Uncertainty Quantification With Bayesian Neural Networks. IEEE Transactions on Geoscience and Remote Sensing, 58(2), 892-902.
Chouet, B. (1988). Resonance of a fluid-driven crack: Radiation properties and implications for the source of long-period events and harmonic tremor. Journal of Geophysical Research: Solid Earth, 93(B5), 4375-4400. Chouet, B. A., & Matoza, R. S. (2013). A multi-decadal view of seismic methods for detecting precursors of magma movement and eruption. Journal of Volcanology and Geothermal Research, 252, 108-175. Curilem, M., de Mello, R. F., Huenupan, F., San Martin, C., Franco, L., Hern´andez, E., & Rios, R. A. (2018). Discriminating seismic events of the Llaima volcano (Chile) based on spectrogram cross-correlations. Journal of Volcanology and Geothermal Research, 367, 63-78.
Fazio, M., Alparone, S., Benson, P. M., Cannata, A., Vinciguerra, S. (2019). Genesis and mechanisms controlling tornillo seismo-volcanic events in volcanic areas. Scientific reports, 9(1), 1-11.
G´omez M, D. M., & Torres C, R. A. (1997). Unusual low-frequency volcanic seismic events with slowly decaying coda waves observed at Galeras and other volcanoes. Journal of Volcanology and Geothermal Research, 77(1-4), 173-193.
Hammer, C., Ohrnberger, M., & Faeh, D. (2013). Classifying seismic waveforms from scratch: a case study in the alpine environment. Geophysical Journal International, 192(1), 425-439.
Harrington, R. M., & Brodsky, E. E. (2007). Volcanic hybrid earthquakes that are brittle-failure events. Geophysical Research Letters, 34(6).
Hibert, C., Mangeney, A., Grandjean, G., Baillard, C., Rivet, D., Shapiro, N. M., & Crawford, W. (2014). Automated identification, location, and volume estimation of rockfalls at Piton de la Fournaise volcano. Journal of Geophysical Research: Earth Surface, 119(5), 1082-1105.
Hibert, C., Provost, F., Malet, J. P., Maggi, A., Stumpf, A., & Ferrazzini, V. (2017). Automatic identification of rockfalls and volcano-tectonic earthquakes at the Piton de la Fournaise volcano using a Random Forest algorithm. Journal of Volcanology and Geothermal Research, 340, 130-142.
Hincks, T. K., Komorowski, J. C., Sparks, S. R., & Aspinall, W. P. (2014). Retrospective analysis of uncertain eruption precursors at La Soufri`ere volcano, Guadeloupe, 1975–77: volcanic hazard assessment using a Bayesian Belief Network approach. Journal of Applied Volcanology, 3(1), 3.
Jessop, D., Moretti, R., Moune, S., Bonifacie, M., Burtin, A., De Chabalier, J. B., & Didier, T. (2019). Les risques volcaniques au XXIe si`ecle: surveiller et pr´evoir; l’exemple de l’OVSG. G´eologues: revue de l’Union fran¸caise des g´eologues.
Komorowski, J. C., Boudon, G., Semet, M. P., Beauducel, F., Ant´enor-Habazac, V., Bazin, S., & Chemin´ee, J. L. (2005). Volcanic Atlas of the Lesser Antilles. University of the West Indies, 63-100.
Komorowski, J. C., Morin, J., Jenkins, S., & Kelman, I. (2016). Challenges of volcanic crises on small islands states. In Observing the Volcano World (pp. 353-371). Springer, Cham.
Konstantinou, K. I. (2015). Tornillos modeled as self-oscillations of fluid filling a cavity: Application to the 1992–1993 activity at Galeras volcano, Colombia. Physics of the Earth and Planetary Interiors, 238, 23-33. Lahr, J. C., Chouet, B. A., Stephens, C. D., Power, J. A., & Page, R. A. (1994). Earthquake classifi-cation, loclassifi-cation, and error analysis in a volcanic environment: Implications for the magmatic system of the 1989–1990 eruptions at Redoubt Volcano, Alaska. Journal of Volcanology and Geothermal Research, 62(1-4), 137-151.
Langer, H., Falsaperla, S., Powell, T., & Thompson, G. (2006). Automatic classification and a-posteriori analysis of seismic event identification at Soufriere Hills volcano, Montserrat. Journal of Volcanology and Geothermal Research, 153(1-2), 1-10.
Langet, N., Maggi, A., Michelini, A., & Brenguier, F. (2014). Continuous Kurtosis-Based Migration for Seismic Event Detection and Location, with Application to Piton de la Fournaise Volcano, La R´eunion. Bulletin of the Seismological Society of America, 104(1), 229-246.
Maggi, A., Ferrazzini, V., Hibert, C., Beauducel, F., Boissier, P., & Amemoutou, A. (2017). Implementation of a multistation approach for automated event classification at Piton de la Fournaise volcano. Seismological Research Letters, 88(3), 878-891.
Malfante, M., Dalla Mura, M., Mars, J. I., M´etaxian, J. P., Macedo, O., & Inza, A. (2018). Automatic classification of volcano seismic signatures. Journal of Geophysical Research: Solid Earth, 123(12), 10-645. Malfante, M., Dalla Mura, M., M´etaxian, J. P., Mars, J. I., Macedo, O., & Inza, A. (2018). Machine learning for volcano-seismic signals: Challenges and perspectives. IEEE Signal Processing Magazine, 35(2), 20-30. McNutt, S. R. (2005). Volcanic seismology. Annu. Rev. Earth Planet. Sci., 32, 461-491.
McNutt, S. R., & Roman, D. C. (2015). Volcanic seismicity. In The Encyclopedia of Volcanoes (pp. 1011-1034). Academic Press.
Menze, B. H., Kelm, B. M., Masuch, R., Himmelreich, U., Bachert, P., Petrich, W., & Hamprecht, F. A. (2009). A comparison of random forest and its Gini importance with standard chemometric methods for the feature selection and classification of spectral data. BMC bioinformatics, 10(1), 213.
Miller, A. D., Stewart, R. C., White, R. A., Luckett, R., Baptie, B. J., Aspinall, W. P., & Voight, B. (1998). Seismicity associated with dome growth and collapse at the Soufriere Hills Volcano, Montserrat. Geophysical Research Letters, 25(18), 3401-3404.
Moretti, R., Komorowski, J. C., Ucciani, G., Moune, S., Jessop, D., de Chabalier, J. B., & Deroussi, S. (2020). The 2018 unrest phase at La Soufri`ere of Guadeloupe (French West Indies) andesitic volcano: Scrutiny of a failed but prodromal phreatic eruption. Journal of Volcanology and Geothermal Research, 106769.
Neuberg, J., Luckett, R., Baptie, B., & Olsen, K. (2000). Models of tremor and low-frequency earthquake swarms on Montserrat. Journal of Volcanology and Geothermal Research, 101(1-2), 83-104.
Provost, F., Hibert, C., Malet, J. P., Stumpf, A., & Doubre, C. (2016, April). Automatic classification of endogenous seismic sources within a landslide body using random forest algorithm. In EGU General Assembly Conference Abstracts (Vol. 18).
Quinlan, J. R. (1986). Induction of decision trees. Machine learning, 1(1), 81-106.
Titos, M., Bueno, A., Garcia, L., & Benitez, C. (2018). A deep neural networks approach to automatic recog-nition systems for volcano-seismic events. IEEE Journal of Selected Topics in Applied Earth Observations and Remote Sensing, 11(5), 1533-1544.
Ucciani, G. (2015). Caract´erisation spatiale et temporelle de la sismicit´e volcanique de la Soufri`ere de Guadeloupe: relation avec le syst`eme hydrothermal (Doctoral dissertation, Sorbonne Paris Cit´e).
Villemant, B., Komorowski, J. C., Dessert, C., Michel, A., Crispi, O., Hammouya, G., & De Chabalier, J. B. (2014). Evidence for a new shallow magma intrusion at La Soufri`ere of Guadeloupe (Lesser Antilles): insights from long-term geochemical monitoring of halogen-rich hydrothermal fluids. Journal of Volcanology and Geothermal Research, 285, 247-277.
Waite, G. P., Chouet, B. A., & Dawson, P. B. (2008). Eruption dynamics at Mount St. Helens imaged from broadband seismic waveforms: Interaction of the shallow magmatic and hydrothermal systems. Journal of Geophysical Research: Solid Earth, 113(B2).
White, R. A., Miller, A. D., Lynch, L., & Power, J. (1998). Observations of hybrid seismic events at Soufriere Hills volcano, Montserrat: July 1995 to September 1996. Geophysical Research Letters, 25(19), 3657-3660.
Table 1: Features used to represent each transient signal, as the feature set from Malfante et al. (2018).
Features Definition Ref.
Statistic features Length n = length(s) 1 Mean µs= 1nΣis[i] 2 Standard deviation σs= q 1 n−1Σi(s[i] − µs) 2 3 Skewness 1 nΣi( s[i]−µs σs ) 3 4 Kurtosis n1Σi(s[i]−µσ s s ) 4 5 i of central energy i = E1.ΣiEi.i 6 RMS bandwidth Bi= q 1 EΣii2.Ei− i 2 7 Mean skewness r Σi(i−i)3Ei E.B3 i 8 Mean kurtosis r Σi(i−i)4Ei E.B4 i 9
Entropy features (with p(sj) the probability of amplitude level sj)
Shannon entropya −Σ
jp(sj)log2(p(sj)) 10 to 12
R´enyi entropyb 1
1−αlog2(Σjp(sj)
α) 13 to 18
Shape descriptors features
Rate of attack maxi(
s[i]−s[i−1]
n ) 19
Rate of decay maxi(s[i]−s[i+1]n ) 20
Ratios min/mean and max/mean 21 to 22 Energy descriptors Signal Energy, maximum, average, standard 23 to 28
deviation, skewness and kurtosis
Specific values min, max, i of min, i of max, threshold crossing rate 29 to 34 and silence ratio
Note. Features computed for a signal s[i]ni=1 (in which i might correspond to a temporal, frequency or cepstral sample). E = Σn
i=1s[i]2 and Ei= s[i]2 describe the signal energy and the energy at sample i,
respectively. Some features have a dimension greater than others; e.g., entropy measurements are made on three different estimations of the amplitude probability (i.e., different histogram bin numbers).
aBin numbers for probability estimation: 5, 30 and 500. bBin numbers for probability estimation: 5, 30, 500, α = 2, inf.
Table 2: Confusion matrix obtained with a ratio of 50:50 between the training and testing datasets for the catalog from the OVSG for January 1, 2013, to December 31, 2018, with the model trained using a random forest classifier (n estimators=100, criterion=’entropy’, bootstrap=True, class weight=None), mean score after 10 trials.
True class Predicted Class Accuracy VT Nested LP (%) VT 251 16 4 92.6 Nested 71 33 4 30.6 LP 16 5 2 51.2 Precision (%) 74.3 61.1 73.3 Overall accuracy (%) 72.5 ±1.0
Table 3: New event classes that were manually assigned after visual review based on the waveform, the spectrogram, and the Fourier spectrum.
Old class New class Total VT Nested LP Hyb Tor
VT 343 9 39 151 0 542 Nested 89 59 22 45 2 217 LP 15 1 36 8 26 86 Total 447 69 97 204 28 845
Table 4: Confusion matrix obtained with a ratio of 50:50 between the training and testing datasets for the refined catalog for January 1, 2013, to December 31, 2018, with the model trained using a random forest classifier (n estimators=100, criterion=’entropy’, bootstrap=True, class weight=None), mean score after 10 trials.
True class Predicted Class Accuracy VT Nested LP Hyb Tor (%)
VT 203 2 1 18 0 90.6 Nested 5 23 1 5 0 67.7 LP 1 1 41 6 0 83.7 Hyb 25 2 7 69 0 67.0 Tor 0 1 1 0 13 86.7 Precision (%) 86.8 79.3 80.4 70.4 100 Overall accuracy (%) 82.1 ±1.6
Figure 1: Map of Guadeloupe. Red triangle, La Soufri`ere summit; blue stars, seismic stations. TAG station was used in this study.
Figure 2: Examples of waveforms filtered between 0.8 Hz and 25 Hz, for spectrogram and Fourier spectrua of volcano-tectonic events (top left), long-period events (top right), and Nested events (bottom) recorded at station TAG, for the vertical component, from January 1, 2013, to December 31, 2018.
Figure 3: Distributions (blue) and cumulative distributions (black) of the numbers of events between January 1, 2013, and December 31, 2018, for (top to bottom) volcano-tectonic (VT), Nested, and long period (LP) events, along with the cumulative distribution of all of the classes (data from OVSG-IPGP).
Figure 4: Workflow of the machine learning process. Step 1: Feature calculation step to represent the signals. Step 2: Learning step on a given proportion of the dataset. Step 3: Testing step to evaluate the performance of the model. Step 4: Classification step on new, unlabeled data with a validated model, as the operational part of the process.
Figure 5: Example of a waveform filtered between 0.8 Hz and 25 Hz, with the spectrogram and Fourier spectrum for Tornillo events (top) and Hybrid events (bottom) recorded at station TAG at La Soufri`ere de Guadeloupe, for the vertical component, for January 1, 2013, to December 31, 2018.
Figure 6: Weigths as percentages for all of the features, for each class, and for all classes combined for the volcanic seismicity detected at La Soufri`ere de Guadeloupe (January 1, 2013, to December 31, 2018; OVSG-IPGP) determined with the feature importance function in the scikit-learn library. Blue, poor importance in the classification; yellow, important for the classification; red, the 14 most useful features with which the classification is similar to the mean score obtained for the whole feature set.
Figure 7: Mean accuracies for each successive nth best feature; learning rate = 50%; model trained using
a random forest classifier (n estimators=100, criterion=’entropy’, bootstrap=False, class weight=None), as mean score after 10 trials. Black line, mean score obtained with all 102 features after 10 trials, for the La Soufri`ere de Guadeloupe volcanic seismicity from January 1, 2013, to December 31, 2018 (OVSG-IPGP)