HAL Id: hal-02921353
https://hal.inrae.fr/hal-02921353
Submitted on 25 Aug 2020
HAL is a multi-disciplinary open access
archive for the deposit and dissemination of
sci-entific research documents, whether they are
pub-lished or not. The documents may come from
teaching and research institutions in France or
abroad, or from public or private research centers.
L’archive ouverte pluridisciplinaire HAL, est
destinée au dépôt et à la diffusion de documents
scientifiques de niveau recherche, publiés ou non,
émanant des établissements d’enseignement et de
recherche français ou étrangers, des laboratoires
publics ou privés.
Distributed under a Creative Commons Attribution| 4.0 International License
distribution in an exploited salmonid
Anne-Laure Ferchaud, Martin Laporte, Charles Perrier, Louis Bernatchez
To cite this version:
Anne-Laure Ferchaud, Martin Laporte, Charles Perrier, Louis Bernatchez. Impact of supplementation
on deleterious mutation distribution in an exploited salmonid. Evolutionary Applications, Blackwell,
2018, 11 (7), pp.1053-1065. �10.1111/eva.12660�. �hal-02921353�
Evolutionary Applications. 2018;11:1053–1065. wileyonlinelibrary.com/journal/eva
|
10531 | INTRODUCTION
New mutations arise in populations every generation. Beneficial mu-tations are generally viewed as the main driver of evolution through adaptation, but most species harbor many deleterious mutations that have not been eliminated by selection (Agrawal & Whitlock, 2012). In fact, most mutations affecting fitness are deleterious (Keightley
& Lynch, 2003) and, excluding those with severe/lethal effects, mildly deleterious mutations are expected to accumulate and ulti-mately impact wild populations (mutation load; Kimura, Maruyama, & Crow, 1963). Therefore, understanding the mechanisms under-lying the accumulation of deleterious mutations is of great interest and has led to studies testing the effects of mating systems, de-mography, domestication, recombination rate, and other genomic features on deleterious mutation trajectories (Bosshard et al., 2017;
Received: 18 August 2017
|
Revised: 31 May 2018|
Accepted: 1 June 2018 DOI: 10.1111/eva.12660O R I G I N A L A R T I C L E
Impact of supplementation on deleterious mutation
distribution in an exploited salmonid
Anne-Laure Ferchaud
1* | Martin Laporte
1* | Charles Perrier
2| Louis Bernatchez
1This is an open access article under the terms of the Creative Commons Attribution License, which permits use, distribution and reproduction in any medium, provided the original work is properly cited.
© 2018 The Authors. Evolutionary Applications published by John Wiley & Sons Ltd
*These authors contributed equally to this work.
1Institut de Biologie Intégrative et des
Systèmes (IBIS), Université Laval, Québec, QC, Canada
2Centre d’Écologie Fonctionnelle et
Évolutive, Unité Mixte de Recherche CNRS 5175, Montpellier Cedex 5, France
Correspondence
Anne-Laure Ferchaud, Institut de Biologie Intégrative et des Systèmes (IBIS), Université Laval, Québec, QC G1V 0A6, Canada. Email: annelaureferchaud@gmail.com
Funding information
MFFP; The Canadian Research Chair in Genomics and Conservation of Aquatic Resources; The Natural Science and Engineering Research Council of Canada NSERC
Abstract
Deleterious mutations have important implications for the evolutionary trajectories of populations. While several studies recently investigated the dynamics of deleteri-ous mutations in wild populations, no study has yet explored the fate of deleterideleteri-ous mutations in a context of populations managed by supplementation. Here, based on a dataset of nine wild and 15 supplemented Lake Trout populations genotyped at 4,982 single nucleotide polymorphisms (SNP)s by means of genotype by sequencing (GBS), we explored the effect of supplementation on the frequency of putatively deleterious variants. Three main findings are consequential for the management of fish populations. First, an increase in neutral genetic diversity in stocked populations compared with unstocked ones was observed. Second, putatively deleterious muta-tions were more likely to be found in unstocked than in stocked populacompared with unstocked ones was observed. Second, putatively deleterious muta-tions, suggest-ing a lower efficiency to purge deleterious mutations in unstocked lakes. Third, a population currently used as a major source for supplementation is characterized by several fixed putatively deleterious alleles. Therefore, other source populations with lower abundance of putatively deleterious mutations should be favored as sources of supplementation. We discuss management implications of our results, especially per-taining to the joint identification of neutral and deleterious mutations that could help refining the choice of source and sink populations for supplementation in order to maximize their evolutionary potential and to limit their mutation load.
K E Y W O R D S
conservation management, deleterious mutations, genetic diversity, Lake Trout (Salvelinus
Charlesworth, 2012; Chen, Glémin, & Lascoux, 2017; Laenen et al., 2018; Peischl et al., 2017; Renaut & Rieseberg, 2015; Zhang, Zhou, Bawa, Suren, & Holliday, 2016; Zhou, Massonnet, Sanjak, Cantu, & Gaut, 2017). Systems in which genetic drift prevails over nat-ural selection (e.g., small population size) are of major concern for conservation and management programs because they may allow random deleterious variants to increase in frequency (Lande, 1994; Lynch, Conery, & Burger, 1995; Wright, 1931). Moreover, inbreed-ing can unmask recessive deleterious mutations, affectinbreed-ing fitness of individuals (Charlesworth & Willis, 2009). In wild populations, the presence of deleterious mutation has been recently found in small populations and used to evaluate the mutation load and the poten-tial for accumulation of deleterious mutations (Benazzo et al., 2017; Perrier, Ferchaud, Sirois, Thibault, & Bernatchez, 2017). Predicting the functional effect of substitution is now possible and thus may be an important criterion to consider when implementing management actions that are currently not considered in conservation or manage-ment programs.
Lake Trout is an important recreational fish widely distributed in cold freshwater lakes of North America (Scott & Crossman, 1998). Pronounced genetic differentiation has been documented among natural/unstocked Lake Trout populations (Halbisen & Wilson, 2009; McCracken, Perry, Keefe, & Ruzzante, 2013; Northrup, Connor, & Taylor, 2010; Perrier et al., 2017; Piller, Wilson, Lee, & Lyons, 2005; Valiquette, Perrier, Thibault, & Bernatchez, 2014). Intrapopulation genetic diversity is typically low in this species (Bernatchez, Laporte, Perrier, Sirois, & Bernatchez, 2016; Valiquette et al., 2014) and pos-itively correlated with lake size (Perrier et al., 2017). Together, they indicate the major role of genetic drift for determining the genetic diversity in lakes after their isolation following the last glacial retreat (Wilson & Mandrak, 2003). In a study dealing specifically on wild (unstocked populations), Perrier et al. (2017) detected 124 putative deleterious variants across all lacustrine populations they surveyed. The frequencies of such deleterious mutations, relative to the entire
polymorphism within populations, were positively correlated with inbreeding, suggesting that the efficacy of purifying selection was negatively correlated with local level of inbreeding. Furthermore, approximately 46% of the Lake Trout populations in the southern part of province of Québec (Canada) have been stocked (mostly from wild populations), and the maintenance of several of these popula-tions is considered dependent on stocking relative to fishing pres-sure (communication with the wildlife Québec agency, Ministère de
la Forêt, de la Faune et des Parcs—MFFP). Based on 19 microsatellites
markers, an increase in genetic diversity and a twofold decrease in genetic differentiation among stocked compared to unstocked pop-ulations were reported across Lake Trout poppop-ulations (Valiquette et al., 2014). Furthermore, levels of admixture in stocked populations were correlated with stocking intensity, resulting in genetic homoge-nization of the heavily stocked populations (Valiquette et al., 2014). The potential effect of stocking on the accumulation of deleterious mutations has not been tested yet in Lake Trout nor in any other exploited fish species to our knowledge. The extensive analyses of the population genetic impacts of stocking and of the accumulation of deleterious mutations in wild Lake Trout populations have paved the way for asking the timely question of how stocking affects the accumulation of deleterious mutations, which is of broad relevance for stocking management in general.
The main objective of this study was to assess the effect of stock-ing on the accumulation of putative deleterious variants. Specifically, this study will answer this question: Do the putative deleterious variants accumulate differentially in unstocked and stocked popu-lations? We achieved this objective using a total of 578 fish from 24 populations in Québec, Canada, that we genotyped using a large single nucleotide polymorphism (SNP) panel designed by a genotyp-ing by sequencsingle nucleotide polymorphism (SNP) panel designed by a genotyp-ing approach. On the basis of the results obtained, we discuss how stocking practices could be adjusted toward im-proving their usefulness by maintaining the evolutionary potential of populations, and how the use of SNPs may help improving stocking
F I G U R E 1 Geographic location of
the 24 sampled Lake Trout populations in Québec (Canada). Gradient color corresponds to the average daily air temperature, and the symbols indicate whether the population has been stocked or not AC AL BO BS CA CE CR CY ES GR HA KI MA MG MI MZ OF PA PB PM PO TU TZ WA 47.5 50.0 52.5 55.0 −80 −75 −70 −65 Longitude Latitude −2.5 0.0 2.5 Mean temperature Stocking Stocked Unstocked
practices by increasing power to decipher population structure and through the identification of deleterious mutations.
2 | MATERIALS AND METHODS
2.1 | Sampling, study system and molecular analyses
Samples from 24 lakes from Québec (Canada) were selected from the study of Valiquette et al. (2014) (Figure 1, Table 1) to maximize the (a) representation of genetic groups previously identified (Valiquette et al., 2014), (b) variation in levels of stocking, and (c) quality of sam-ples for performing GBS. Stocking history information was extracted from the MFFP database. Among selected lakes, nine have never been stocked while 15 have been stocked at least once (Table 1). It is worthwhile to mention that Lake Trout lakes are generally not supplemented from hatchery, but from wild fish from another lakes (Supporting Information Table S1). The median number of individuals per lake was 23, ranging from 10 to 41 (Table 1).DNA was extracted from the same adipose fin clips for GBS genotyping using a modified version of salt extraction protocol (Aljanabi & Martinez, 1997). An RNAse A (Qiagen) treatment was applied following the manufacturer’s recommendation. DNA quality
was checked using agarose gel electrophoresis. DNA was quantified using a NanoDrop spectrophotometer (Thermo Scientific) and then using Quant- iT Picogreen dsDNA Assay Kit (Invitrogen). GBS librai-ries were prepared following a modified version of the two- enzyme GBS protocol, using PstI and MspI restriction enzymes (Poland, Brown, Sorrells, & Jannink, 2012), and single- end 100- bp- length sequencing on Illumina HiSeq2000 platform was conducted for all samples as detailed in Bernatchez et al. (2016).
2.2 | DNA sequencing, genotyping and
genetic diversity
Cutadapt version 1.9.dev0 was used to remove adaptor sequences with a maximum error rate set to 0.2 and processed reads shorter than 80 bp were removed. Sequence quality was then inspected using FastQC 0.11.1 (Andrews, 2010). Libraries were demultiplexed and filtered for overall quality using the module process_radtags from Stacks version 1.30 (Catchen, Amores, Hohenlohe, Cresko, & Postlethwait, 2011; Catchen, Hohenlohe, Bassham, Amores, & Cresko, 2013). One mismatch in individual tags was allowed for quality and ambiguous barcodes. To discard Illumina adaptors at the end of the read, reads were trimmed to 80 bp (Pujolar et al., 2013).
TA B L E 1 Population code and corresponding lake size (in hectares), sample size (N), administrative region, latitude, longitude, altitude (in
meters), and stocking state (see Supporting Information Table S1 for more details about stocking and air temperature)
Lake_code Lake size (hr) N Region Latitude Longitude Altitude Stocking
CA 746 17 Abitibi- Temiscamingue 46.54 −78.31 329 Unstocked
HA 39 36 Abitibi- Temiscamingue 48.47 −78.7 363 Unstocked
MG 622 19 Abitibi- Temiscamingue 46.53 −78.39 253 Unstocked
KI 30,044 17 Abitibi- Temiscamingue 46.91 −78.99 269 Stocked
PA 109 30 Outaouais 46.14 −76.2 252 Stocked CE 793 22 Outaouais 46.3 −76.11 181 Stocked AC 673 28 Outaouais 46.25 −77.1 283 Stocked CY 725 41 Outaouais 46.12 −76.27 194 Stocked BS 1,437 30 Outaouais 46.22 −76.05 164 Stocked MI 4,973 34 Outaouais 46.19 −75.81 159 Stocked BO 531 17 Laurentides 47.08 −75.85 299 Unstocked MA 919 18 Laurentides 47.03 −75.8 329 Unstocked TU 352 34 Laurentides 47.44 −74.85 436 Unstocked GR 137 19 Laurentides 46.65 −74.56 485 Stocked PM 357 26 Laurentides 46.39 −75.29 317 Stocked TZ 958 24 Laurentides 46.25 −74.64 226 Stocked CR 1,267 15 Laurentides 46.28 −75.5 209 Stocked PB 5,475 17 Laurentides 45.97 −75.74 198 Stocked AL 40,663 15 Nord- du- Quebec 50.9 −73.29 390 Unstocked OF 5,110 29 Nord- du- Quebec 54.55 −72.43 431 Unstocked WA 8,184 25 Nord- du- Quebec 50.15 −73.99 463 Unstocked ES 743 32 Bas- St- Laurent 47.19 −69.56 321 Stocked PO 894 10 Bas- St- Laurent 47.49 −69.27 207 Stocked MZ 1,864 23 Bas- St- Laurent 48.32 −67.8 271 Stocked
Sequence reads were aligned to the Rainbow Trout (Oncorhynchus
mykiss) genome (Berthelot et al., 2014) using the GSNAP version
2015- 12- 31v.9 (Wu & Nacu, 2010). Stacks pipeline version 1.40 was then used to discover loci and call genotypes. Pstacks was used to extract the stacks aligned to the reference genome and to identify SNPs at each locus with a minimum depth coverage of four to re-port a stack. Ten individuals per population (individuals with the highest number of sequence reads) were used to build the catalog using ctsacks. Set of stacks were then searched against the catalog using sstacks performing gapped alignment and using the –g option. The populations module was used to call genotypes for loci having a minimum genotype likelihood of −10. Subsequent filtering was ap-plied to retain SNPs that were biallelic, genotyped in a least 50% of the individuals of a given population, and had a global minor allele frequency (MAF) higher than 0.05. This filter was used to avoid the introduction of sequencing error in the dataset and to avoid restric-tion of MAF in local populations at the same time. Only a single SNP per locus was kept. All filtering details are presented in Supporting Information Table S2. The Stacks workflow used is available online (https://github.com/enormandeau/stacks_workflow), and conver-sion of VCF files was produced with stackr R package version 0.5.5 (Gosselin & Bernatchez, 2016), VCFTOOLS 0.1.14 (Danecek et al., 2011), and PGDSPIDER 2.0.7.2 (Lischer & Excoffier, 2012). At last, we retrieved microsatellite data for the individuals retained after fil- tering during the SNPs calling. SNP genomic diversity within popu-lations was reported as population averages for (a) the number of polymorphic reads per individual, (b) nucleotide diversity among variant sites, (c) proportion of SNPs genotyped, and (d) proportion of polymorphic SNPs (allele frequency different from 0 or 1).
2.3 | Removing markers under potential selection
Detection of putative outliers was performed using two approaches: (a) SNPs potentially under balancing and divergent selection were identified using BAYESCAN v.2.1 (Foll & Gaggiotti, 2008) and (b) SNPs under polygenic selection linked to temperature were de-tected using a random forest algorithm (Boulesteix, Janitza, Kruppa, & Konig, 2012; Chen & Ishwaran, 2012; Goldstein, Polley, & Briggs, 2011). This second step was produced because different seasonal temperature variables may impose different selective pressures on Lake Trout (Perrier et al., 2017). The putative outliers were subse-quently removed from the SNP datasets, such that only putative neutrals remained (hereafter called “neutral markers”) for the subse-quent analyses. Details of Bayescan and random forest are provided in Supporting Information Data S1.2.4 | Heterozygosity, neutral genetic
differentiation, and structure
GENEPOP version 4.2 (Raymond & Rousset, 1995; Rousset, 2008) was used to estimate observed and expected heterozygosities (HO and HE, respectively), and a t test was performed between HE of un-stocked versus un-stocked populations. The R package assigner v.0.3.9
(Gosselin, Anderson, & Bradbury, 2016) was used to estimate pair-wise FST (Weir & Cockerham, 1984) across all populations on both the neutral loci and the putatively deleterious mutation datasets and tested for significance with 1,000 bootstraps. Estimations of neutral admixture proportions of SNPs were performed with a discriminant analysis of principal components (DAPC). Because PCA methods do not accept missing data, imputations by lake were performed using the random forest algorithm implemented in the function “genomic_converter” from the “stackr” R package version 0.5.5. Then, the function “find.clusters” from the “adegenet” R package version 2.0.1 (Jombart & Ahmed, 2011) was used to assess the optimal num-ber of groups with the Bayesian information criterion (BIC) method, considering no prior on group individual populations and allowing a maximum of 30 clusters. At last, the posterior individual assignment probabilities to each group (Q matrix) were obtained running the “dapc” function using the optimal number of discriminant functions to retain the optimal α- score obtained from each dataset (Jombart, Devillard, & Balloux, 2010).
2.5 | Identifying deleterious mutations
Deleterious mutations were first estimated by performing a BLAST on all SNPs against the Rainbow Trout transcriptome using blastx. We used the Rainbow Trout transcriptome because it was the best transcriptome available among salmonids at the time we produced this work and for the sake of similarity with Perrier et al. (2017). All hits with a similarity higher than 25 amino acid of 26 possible (con-sidering 80- bp- long read) and more than 95% similarity between the query read and the transcriptome sequence were retained. As described in Perrier et al. (2017), we then identified the nonsynony-mous mutations across the significant hits. As the prediction of the functional effect of amino acid changes may depend on the direc-tion (i.e., the predicted effect of Gly to Asp does not equal an Asp to Gly change), for each nonsynonymous substitution, we identified the specific amino acid substitution and reported the structural/phys-icochemical category to each amino acid according to the classifica-tion reported in Supporting Information Table S3.
We employed PROVEAN (Protein Variation Effect Analyzer; Choi, Sims, Murphy, Miller, & Chan, 2012) and PolyPhen- 2 (Adzhubei et al., 2010) to predict a potential damaging effect of a missense mutation. Using linear model in R, we tested the correlation be-tween PolyPhen- 2 and Provean scores. The results inferred from the two methods were highly congruent (adj. R2 = 0.52; p < 0.001;
Figure 2 and Supporting Information Table S4), and we therefore show only PROVEAN scores for the subsequent analyses because unlike PolyPhen- 2, this method is not limited to human genes. Provean scores correlate with biological activity and may be used as an indicator for the degree of functional impact of a given protein variation. We investigated whether the values of these scores were significantly different across changes of amino acid categories by conducting two ANOVAs. In the first one, the direction of a category to another was kept whether in the second ANOVA, we clustered together two changes that implied the same categories with the goal
of confirming the importance of the directionality of change on the potential deleterious state of a mutation.
At last, a default deleterious threshold value of −2.5 in Provean scores, as commonly employed by other studies (e.g., Renaut & Rieseberg, 2015), was used to classify a nonsynonymous mutation as potentially deleterious (<−2.5) or neutral (>−2.5). We thus applied Provean scores to test whether local deleterious allele frequencies (considered as the minor allele frequency of SNPs harboring a pu-tative deleterious mutation) differ among populations using a mul-tivariate analysis of variance (MANOVA). Next, the proportion of deleterious mutations (defined as the number of SNPs showing a deleterious mutation in a given population over the number of SNPs harboring a deleterious mutation across all populations) and the ratio of the proportion of deleterious mutations over the proportion of polymorphic SNPs were estimated and compared among popula-tions. The latter ratio is expected to be lower in populations that purged deleterious mutations faster (see Perrier et al., 2017) and was compared between stocked and unstocked populations using a t test. Because deleterious alleles are negatively selected, it is ex-pected that their frequencies should be lower than nondeleterious ones (Fay, Wyckoff, & Wu, 2001). Thus, t tests were also used to ver-ify whether average “deleterious allele frequency” is lower than the ones of “nonsynonymous, but nondeleterious SNPs” and to the ones of “synonymous SNPs” within each stocked and unstocked groups.
2.6 | Effect of stocking on neutral genetic
variation and accumulation of deleterious mutations
The effects of stocking and spatial autocorrelation on the genetic variation of both neutral genetic structure and deleterious alleles were tested using a distance- based redundancy analysis (db- RDA; Legendre & Legendre, 1998). First, we estimated a pairwise FST dis-tance matrix (neutral loci or loci with potential deleterious muta-tions) and produced principal coordinates analyses (PCoAs) on this pairwise FST distance matrix to obtain the matrix to be explained bythe db- RDA tests. For neutral SNPs, the Q matrix (i.e., admixture pro-portions; DAPC averaged at population level) was also used to serve as proxies for genetic structure to be explained by a db- RDA test. Only PCo- axes explaining at least 5% of the variance were consid-ered meaningful and kept. As a proxy for stocking intensity, a matrix of the total weight (in kg) of fish stocked from 13 sources (column) to the 24 studied lakes (row) was extracted from the MFFP database (Supporting Information Table S1). Because the density of stocked fish in a lake is a good indicator of stocking pressure (Létourneau et al., 2017), each row was divided by the surface of the stocked lake in hectare. Furthermore, a Hellinger transformation was produced to avoid the effect of absence of stocking on the similarity among objects (Legendre & Legendre, 1998). A PCA was produced on the transformed database and a broken- stick distribution was thereafter used to choose the meaningful axes related to stocking pressure. To control for spatial autocorrelation, a distance- based Moran’s eigen-vector map (db- MEM) based on latitude, longitude, and altitude, all pretransformed in meter with the function “geoXY” of the R pack- age “SoDA,” was produced. The PC- axes related to stocking inten-sity and db- MEMs related to spatial components constituted the two explanatories matrices. To identify the best model, the function “ordistep” was used to select the best explanatory variables among stocking and spatial matrices. The function “rda” was finally used to compute the db- RDAs on the selected model (see Benestan et al., 2016; Laporte et al., 2016; Le Luyer et al., 2017; Marengo et al., 2017, for examples of similar methodology). In addition, to ensure that stocking variables explained a significant part of the variation, a partial db- RDA analysis was produced to test for the effect of the stocking variables after controlling for the spatial autocorrelation (db- MEMs). An analysis of variance (ANOVA; 1,000 permutations) was then performed to assess the global significance of the db- RDAs and partial db- RDAs, and the percentage of variance explained (PVE) was computed with the function “RsquareAdj.” When not mentioned, R functions were part of the “vegan” package.
2.7 | Comparison SNPs/microsatellites
Single nucleotide polymorphism database produced in this study con-tained the exact same individuals that the one of Valiquette et al. (2014) based on 19 microsatellites. We thus took advantage of both of the large dataset to compare their respective capacity to detect an effect of stocking on neutral genetic variation. Because results were similar between both datasets (although SNPs showed an increase in power given the much higher number of loci screened), this section is only presented in Supporting Information Data S2 for sake of comparison.
3 | RESULTS
3.1 | DNA sequencing, genotyping, and genetic
diversity
The total number of demultiplexed and cleaned reads was 1,143,048,513 with an average of 821,578 reads per individual.
F I G U R E 2 Relationship between Provean and PolyPhen- 2
scores. Only loci for which scores have been collected for both methods were considered for this comparison (130 of 214 nonsynonymous mutations) 0.00 0.25 0.50 0.75 1.00 −10 −5 0 5 10 Provean score Po lyPhen−2 scor e
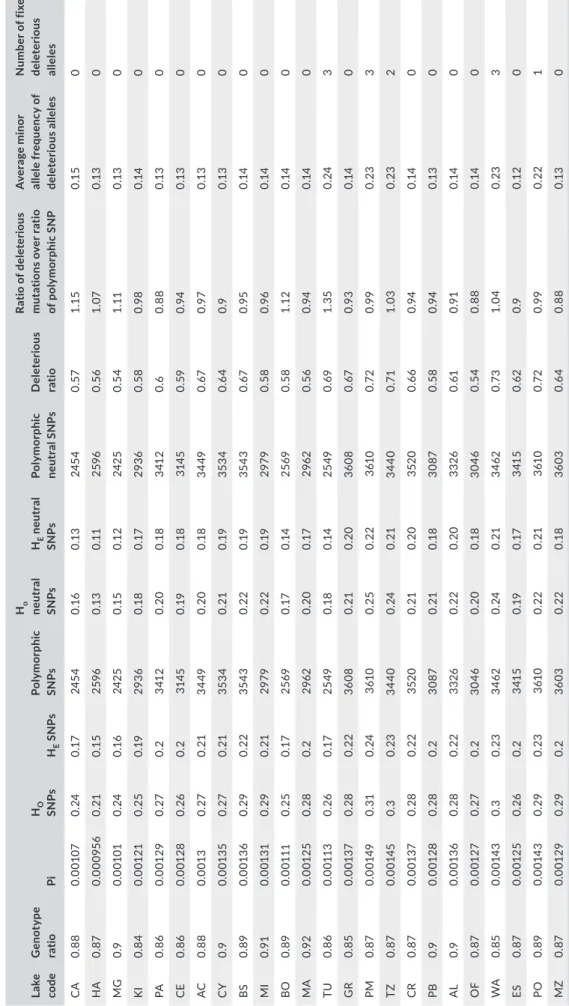
T A B LE 2 D es cr ip tiv e ge ne tic s ta tis tic s fo r e ac h sa m pl in g lo ca lit y. O bs er ve d an d ex pe ct ed h et er oz yg os ity fo r b ot h al l S N Ps (HO S N Ps , HE S N Ps ) a nd n eu tr al S N Ps (H O n eu tr al S N Ps a nd HE ne ut ra l S N Ps ), ge no ty pe ra tio , n uc le ot id e di ve rs ity (P i), n um be r o f po ly m or ph ic S N Ps , p ro po rt io n of d el et er io us m ut at io ns ; r at io o f d el et er io us m ut at io ns ov er ra tio o f p ol ym or ph ic S N P, a nd the a ver ag e m in or a llel e f re qu en cy o f del et er iou s a llel es a nd n um ber o f f ix ed del et er iou s a llel es La ke co de G en ot yp e ra tio Pi HO SN Ps HE S N Ps Po ly mo rp hi c SN Ps Ho neu tr al SN Ps HE n eu tr al SN Ps Po ly mo rp hi c neu tr al S NP s D ele ter iou s ra tio Ra tio o f d el et er io us m ut at io ns o ve r r at io of p ol ym or ph ic S N P A ve ra ge m in or al le le fr eq uen cy o f de le ter iou s al le le s N um be r o f f ix ed de le ter iou s al le le s C A 0. 88 0.0 01 07 0. 24 0. 17 24 54 0.1 6 0.1 3 24 54 0. 57 1.1 5 0.1 5 0 HA 0. 87 0.0 00 95 6 0. 21 0.1 5 259 6 0.1 3 0. 11 259 6 0. 56 1. 07 0.1 3 0 MG 0.9 0. 001 01 0. 24 0.1 6 24 25 0.1 5 0.1 2 24 25 0. 54 1. 11 0.1 3 0 KI 0. 84 0.0 01 21 0. 25 0. 19 293 6 0.1 8 0. 17 293 6 0. 58 0.9 8 0. 14 0 PA 0. 86 0.0 01 29 0. 27 0. 2 341 2 0. 20 0.1 8 341 2 0. 6 0. 88 0.1 3 0 CE 0. 86 0. 001 28 0. 26 0. 2 314 5 0. 19 0.1 8 314 5 0. 59 0.9 4 0.1 3 0 AC 0. 88 0.0 01 3 0. 27 0. 21 34 49 0. 20 0.1 8 34 49 0. 67 0.9 7 0.1 3 0 CY 0.9 0.0 01 35 0. 27 0. 21 35 34 0. 21 0. 19 35 34 0. 64 0.9 0.1 3 0 BS 0. 89 0.0 01 36 0. 29 0. 22 35 43 0. 22 0. 19 35 43 0. 67 0.9 5 0. 14 0 MI 0.9 1 0.0 01 31 0. 29 0. 21 297 9 0. 22 0. 19 297 9 0. 58 0.9 6 0. 14 0 BO 0. 89 0. 00 111 0. 25 0. 17 25 69 0. 17 0. 14 25 69 0. 58 1.1 2 0. 14 0 M A 0.9 2 0.0 01 25 0. 28 0. 2 296 2 0. 20 0. 17 296 2 0. 56 0.9 4 0. 14 0 TU 0. 86 0.0 01 13 0. 26 0. 17 25 49 0.1 8 0. 14 25 49 0. 69 1. 35 0. 24 3 G R 0. 85 0.0 01 37 0. 28 0. 22 36 08 0. 21 0. 20 36 08 0. 67 0.9 3 0. 14 0 PM 0. 87 0.0 01 49 0. 31 0. 24 361 0 0. 25 0. 22 361 0 0.7 2 0.9 9 0. 23 3 TZ 0. 87 0.0 01 45 0. 3 0. 23 34 40 0. 24 0. 21 34 40 0. 71 1. 03 0. 23 2 CR 0. 87 0.0 01 37 0. 28 0. 22 352 0 0. 21 0. 20 352 0 0. 66 0.9 4 0. 14 0 PB 0.9 0. 001 28 0. 28 0. 2 30 87 0. 21 0.1 8 30 87 0. 58 0.9 4 0.1 3 0 AL 0.9 0.0 01 36 0. 28 0. 22 33 26 0. 22 0. 20 33 26 0. 61 0.9 1 0. 14 0 O F 0. 87 0.0 01 27 0. 27 0. 2 30 46 0. 20 0.1 8 30 46 0. 54 0. 88 0. 14 0 W A 0. 85 0.0 01 43 0. 3 0. 23 34 62 0. 24 0. 21 34 62 0.7 3 1. 04 0. 23 3 ES 0. 87 0.0 01 25 0. 26 0. 2 341 5 0. 19 0. 17 341 5 0. 62 0.9 0.1 2 0 PO 0. 89 0.0 01 43 0. 29 0. 23 361 0 0. 22 0. 21 361 0 0.7 2 0.9 9 0. 22 1 MZ 0. 87 0.0 01 29 0. 29 0. 2 36 03 0. 22 0.1 8 36 03 0. 64 0. 88 0.1 3 0
After DNA control quality and filtering out individuals with more than 30% of missing genotypes, 578 of 629 individuals were kept for subsequent analyses. The assembly with the Rainbow Trout reference genome resulted in a catalog containing 1,359,992 dis-tinct SNPs. After filtering for quality and keeping only a single SNP per locus, 4,982 SNPs were retained (Supporting Information Table S5). The median value of SNPs genotyped per population was 4,335 (Table 2), and the median depth of coverage was 35. The median number of polymorphic SNPs per population was 3,178 (64%); the median value of Pi was 1.29E- 03, ranging from 9.56E- 04 (pop HA) to 1.49E- 03 (pop PM, Table 2).
3.2 | Removing markers under potential selection
Among the 4,982 SNPs, BAYESCAN identified 437 SNPs (8.8%) that were potentially under divergent selection and 722 SNPs (14.4%) under balancing selection (Supporting Information Data S1; Figure S1.1). Analyses with the random forest algorithm selected 135 and 139 SNPs associated with temperature for population structure with K = 21 and K = 24, respectively (Supporting Information Data S1). In each case, model performance was not improved by reduc-ing the number of selected loci accordS1). In each case, model performance was not improved by reduc-ing to the cross- validation. Subsequently, 3,557 SNPs were defined as neutral SNPs (Supporting Information Figure S1).3.3 | Heterozygosity, neutral genetic
differentiation, and structure
The median estimates of the observed and expected heterozygo-sity (HO and HE) were, respectively, 0.20 and 0.18 for the neutral SNPs. The mean HE was significantly higher among stocked popula-tions (mean HE SNPs stocked = 0.19) than among unstocked populations (mean HE SNPs unstocked = 0.16, pt.test = 0.016).
A pronounced pattern of population structure was observed among populations both Fst estimations and DAPC analyses. For neutral SNPs, pairwise FST ranged from 0.01 to 0.50 (mean = 0.22) and mean pairwise FST per population ranged from 0.15 (pop GR) to 0.36 (pop HA) (Supporting Information Data S2; Figure S2.1). The DAPC further confirmed the pronounced genetic structure ob-served among populations. The BIC values decreased as the number of K increased until K = 24 (Supporting Information Data S2; Figure S2.2). Thus, K = 24, which also corresponds to the total number of sampled populations, was used to estimate the posterior individual probabilities of assignment (Q matrix; Supporting Information Data S2; Figure S2.3).
3.4 | Identifying deleterious mutations
Among all the 4,982 genotyped loci, 529 loci had significant BLAST results against the Rainbow Trout transcriptome (Berthelot et al., 2014) and were retained to assess synonymy. Synonymous sub-stitutions were identified for 315 SNPs and nonsynonymous for 214 SNPs. Among the 214 nonsynonymous mutations, 90 were
predicted to be neutral and 113 (52.8% of all nonsynonymous SNPs) were predicted to be putatively deleterious (Figure 3). The eight remaining mutations could not be attributed to one or the other category. Those nonsynonymous substitutions corresponded to 36 different classes of amino acid category changes or were restricted to 21 classes when pooling together classes implying twice the same two categories independent of the direction of the substitution. Considering the 36 classes, Provean scores were significantly differ-ent across classes (df = 35, F = 1.627, p = 0.022; Figure 4a), whereas when masking the direction of substitution (i.e., considering 21 classes), the scores no longer differed significantly across classes (df = 20, F = 1.094, p = 0.359, Figure 4b), thus highlighting the im-portance of directionality in amino acid changes.
MANOVA revealed a significant effect of the population factor on deleterious allele frequencies (df = 23, F = 4.81, p < 0.001), indi-cating that the average frequency of deleterious alleles was signifi-cantly different among populations. The proportion of deleterious mutations varied from 0.54 to 0.73 among populations (Table 2) with a median value of 0.62. The ratio of the proportion of deleterious mutations over the proportion of polymorphic SNPs per population varied from 0.88 (pop MZ) to 1.35 (pop TU). Moreover, the relative abundance of deleterious alleles was significantly lower in stocked than in unstocked populations (mean ratiostocked = 0.94, mean ratio
un-stocked = 1.06; t = −2.3801; df = 8.863; p = 0.040). Among stocked
populations, the average local minor allele frequency for deleteri-ous mutations (0.15) was significantly lower than “nonsynonymdeleteri-ous but nondeleterious” SNPs (0.20; df = 2772.4; t = −5.6568; p < 0.001) as well as “synonymous” SNPs (0.23, df = 3297.5, t = −12.666,
p < 0.001). Among unstocked populations, these differences were
less pronounced but still significant (minor allele frequency: dele-terious mutations = 0.16, nonsynonymous/nondeledele-terious = 0.19, synonymous = 0.20; t test results were respectively df = 1677.6;
t = −3.04; p = 0.002; and df = 1104.2; t = −6.83; p < 0.001). The
av-erage proportion of minor allele for deleterious SNPs (i.e., predicted deleterious alleles) with a frequency lower than 5% was 52% across lakes (ranging from 34% (lake TU) to 61% (lake PA). This proportion of minor allele with low frequency (<5%) was higher than the same proportions observed for both nonsynonymous/nondeleterious and synonymous polymorphisms (respectively 41% (from 34% (lake CR) to % (lake MG)) and 36% (from 30% (lake AL) to 42% (lake MG)); Figure 5). Together, these results suggest that deleterious mutations are more likely to be lost than putatively neutral polymorphisms (es-pecially in stocked versus unstocked populations) but that there are still relatively common across all populations. At last, it is important to note that certain deleterious mutations were fixed in five popu-lations, including an important source population used for stocking other lakes (TZ Lake, Table 2).
3.5 | Effect of stocking on neutral genetic
variation and accumulation of deleterious mutations
Based on the broken- stick distribution, four stocking PC- axes were considered meaningful and thus retained. Together, theseexplained 82.5% of the variance of our dataset for stocked pop-ulations. The loading factors revealed that the first stocking PC- axis was associated with the source lakes 31- Miles (r = 0.67) and Blue Sea (r = 0.70), the second stocking PC- axis with the source lake Tremblant (TZ) (r = 0.81), and the third stocking PC- axis with the source lake Mitis (MZ) (r = 0.65; Supporting Information Table S6). No stocking source was highly associated (correlation >0.60) with the fourth stocking PC- axis (Supporting Information Table S6). In addition, 16 axes were obtained from the db- MEM analysis
(Supporting Information Table S7), which were all considered to test for the occurrence of spatial autocorrelation in all our RDA tests. For all variables retained of all RDA tests, maximum variance inflation factors were all under six (with majority under two), which is also under the suggested threshold of 10 (Hair, Black, Babin, Anderson, & Tatham, 1998).
For pairwise FST distance matrix, five PCo- axes (totalizing 60% of explained variance) each explaining at least 5% of the variance were kept. Global model retained three spatial variables
F I G U R E 3 Distribution of PROVEAN
scores among the 203 detected nonsynonymous mutations. The defaults threshold (−2.5) was used to detect 90 putatively neutral mutations and 113 putatively deleterious 0 5 10 15 20 25 −15 −10 −5 0 5 10 Provean score coun t Prediction Deleterious Neutral
F I G U R E 4 Boxplots of Provean scores according to the amino acid category considering (a) 36 different classes of substitutions
(directionality of the mutation was considered) or (b) 21 different classes of substitutions (directionality of the mutation was not
considered). The dashed red line indicates the Provean default threshold below which the substitution is considered potentially deleterious. Abbreviations correspond to what it is referenced in Supporting Information Table S3 (i.e., Pos, amino acid with positive electrically charged side chains; Neg, amino acid with negative electrically charged side chains; Unc, amino acid with polar uncharged side chains; Hyd, amino acid with hydrophobic side chain; Cys, cystein; Sel, selenocysteine; Gly, glycine; Pro, proline) 15 10 5 0 5 10 Cys_GlyCys_HydCys_P os Gly_HydGly_Ne g Gly_Po s Gly_UncHyd_Cy s Hyd_GlyHyd_HydHyd_NegHyd_ Pos Hyd_ProHyd_UncNeg_Gl y Neg_HydNeg_Ne g Neg_ Pos Neg_ Unc
Pos_CysPos_GlyPos_Hy
d
Pos_
Neg
Pos_P
os
Pos_ProPos_Un
c
Pro_HydPro_P
os Pro_Un c Unc_CysUnc_Gl y Unc_Hy d Unc_ Neg Unc_ Pos Unc_ Pro Unc_U nc Pro ve an score (a) 15 10 5 0 5 10
Cys = Gly Cys = Hyd Cys =
Pos Gly = Hy d Gly = Ne g Gly = P os Gly = Un c Hyd = Hyd Hyd = Ne g Hyd = Pos Hyd = P ro Hyd = Un c Neg = Ne g Neg = Pos Neg = Unc Pos = P os Pos = Pr o
Pos = Unc Pro = Un
c
Unc = Cy
s Unc = Un
c
Change of amino acid categories
Pro
vean score
(Db- MEM # 2,9 and 14) and one stocking variables (PC- 3, associ-ated with source lake Mitis) and explained 24.5% of the five PCo- axes (p < 0.001). A total of 15.7% of the variation was explained by the stocking variable alone after controlling for spatial variables (p < 0.01). For the Q matrix, 12 PC- axes (totalizing 61% of explained variance) each explaining at least 5% of the variance were kept. Global model retained five spatial variables (Db- MEM # 1, 2, 10, 12 and 14) and all four stocking variables and explained 26.5% of the 12 PCo- axes (p < 0.001). A total of 16.9% of the variation was explained by the stocking variables after controlling for spatial vari-ables (p < 0.001).
For deleterious mutations, two PCo- axes (totalizing 63.3% of explained variance) each explaining at least 5% of the variance in pairwise FST distance matrix were kept. The global model retained one spatial variable (Db- MEM #1) and one stocking variable (PC- 2, associated with source lake Tremblant), and marginally explained 13.2% of the five PCo- axes (p < 0.1). A total of 8.8% of the variation was also marginally explained by the stocking variable alone after controlling for spatial variables (p < 0.1).
4 | DISCUSSION
The main goal of this study was to assess the stocking impacts on the accumulation of putative deleterious mutations in an exploited fish, Lake Trout (Salvelinus namaycush). Our results highlighted an in-crease in neutral genetic diversity and a lower number of deleterious mutations in stocked populations compared with unstocked ones, as well as an effect on deleterious mutation variation related to a major source for supplementation characterized by several fixed putatively deleterious alleles (stocking PC- 2, Tremblant lake). Below we discuss the usefulness of GBS for monitoring putative deleterious alleles in source and stocked populations in order to mitigate potential harm-ful effects linked to stocking practice.
4.1 | Effect of stocking on neutral genetic
diversity and variation
An increase in genetic diversity (at both marker types, see Supporting Information Data S2 for a detailed discussion on this topic) was observed in stocked compared with unstocked lakes, as already reported by Valiquette et al. (2014). However, the percent-age of variance of genetic differentiation (FST) or admixture matrix explained by stocking had not been explored in previous studies to our knowledge. After controlling for spatial autocorrelation, we found a significant effect of stocking on both pairwise genetic dif-ferentiation (15.7% of variance explained) and the admixture matrix (16.9% of variance explained). It is interesting that only the stocking PC- 3 (source lake Mitis) showed an effect on pairwise genetic dif-ferentiation, whereas all stocking PC showed an effect on admixture matrix. This could be explained by a pronounced effect of genetic homogenization by stocking from Mitis Lake, which was previously reported by Valiquette et al. (2014). In the current study, the average pairwise FST for the three stocked populations using Mitis Lake as a stocking source (all from “Bas-St-Laurent” area) was 0.10 in compari- son with 0.22 for all other populations. Such important genetic ho-mogenization may explain why other stocking effects could not be detected by the multivariate analyses on pairwise Fst in comparison with Q matrix.
4.2 | Detection and analyses of putative
deleterious mutations
Our empirical GBS data on a nonmodel species highlights the fact that the prediction of the functional effect of amino acid change actually depends on the direction of amino acid substitution as sug- gested by Vasemägi et al. (2017). For several categories, one direc-tion exhibits mainly “neutral” nonsynonymous mutagested by Vasemägi et al. (2017). For several categories, one direc-tions, whereas the other direction presents mainly putative deleterious mutations.
F I G U R E 5 Boxplots of minor allele frequency of SNPs according three categories: nonsynonymous deleterious SNPs, nonsynonymous
nondeleterious SNPs, and synonymous SNPs. Lakes represented to the left of the black dashed line are unstocked populations, whereas the 15 lakes represented to the right of the line correspond to stocked populations. Then, in each side of the line, lakes were placed according to their geographical proximity
CA HA MG BO MA TU AL OF WA KI PA CE AC CY BS MI GR PM TZ CR PB ES PO MZ 0.00 0.25 0.50 0.75 1.00
Minor Allele Frequency
A total of 113 putative deleterious SNPs was detected in our data-set corresponding to almost 53% of all nonsynonymous variations, which is in accordance with the 124 (60%) deleterious variants de-tected with a different dataset of natural Lake Trout populations (Perrier et al., 2017). For comparison, the percentage of nonsynony-mous sites estimated to be deleterious in other species ranges from 3% in bacterial populations (Hughes, 2005) to 80% in the human genome (Fay et al., 2001). Such relatively abundant levels of del-eterious mutations in Lake Trout populations could be attributed to their colonization history and to their small effective population sizes (Perrier et al., 2017), which are known to accumulate deleteri-ous variants over time (Allendorf, Aitken, & Luikart, 2013; Balick, Do, Cassa, Reich, & Sunyaev, 2015; Benazzo et al., 2017; Frankham, Ballou, & Briscoe, 2010; Renaut & Rieseberg, 2015). Admittedly, the putative harmful mutations detected could also partly be linked to gene duplication and residual tetrasomic inheritance present in all salmonids due to their whole- genome duplication (WGD) (Dehal & Boore, 2005; Jaillon, Aury, Brunet, Petit, & Stange- Thomann, 2004; Macqueen & Johnston, 2014). Nevertheless, a recent study dem-onstrated that gene duplication can also impart fragility, not only robustness over mutations (Diss et al., 2017), suggesting that even duplicated regions remain strong candidates to harbor deleterious mutations. Furthermore, deleterious mutations should be kept at low frequency by natural selection (Kimura, 1983; Whitlock, Griswold, & Peters, 2003). The average proportion of minor alleles at poten-tial deleterious SNPs with a frequency lower than 5% was more important than the proportion of nonsynonymous/nondeleterious and synonymous polymorphisms for both stocked and unstocked populations. These observations are consistent with the action of an effective purifying selection (Fay et al., 2001). Nevertheless, those rare predicted deleterious alleles frequencies varied among tions and some of them segregate at high frequency in a few popula-tions, suggesting that the monitoring of markers harboring putative deleterious mutations has the potential to improve stocking prac-tices, for instance for guiding the choice of sources and sinks for supplementation.
4.3 | Effect of stocking on deleterious mutations
It is interesting that the average relative abundance of putative del-eterious alleles over the entire polymorphism found in a population is higher in unstocked than stocked populations. In stocked popu-lations, the addition of new individuals within a population from another lake could indeed both diminish the effect of drift as well as the subsequent fixation of putative deleterious, whereas in un-stocked populations, genetic drift remains the main driver allowing putative deleterious variants to increase in frequency as observed in natural Lake Trout populations (Perrier et al., 2017) and in small populations of another species (Benazzo et al., 2017). Nevertheless, the potential of the several harmful impacts of stocking must be kept in mind, including genetic homogenization, loss of genetic integrity, and the weakening of local adaptation (Halbisen & Wilson, 2009; Lamaze, Garant, & Bernatchez, 2012; Marie, Bernatchez, & Garant,2010; Valiquette et al., 2014). Thus, the use of stocking to potentially decrease deleterious mutations frequencies could generate other critical problems in natural populations. In addition, phenotypic evi-dence (e.g., fluctuating asymmetry and developmental survival rate) supporting the deleterious state of those 113 candidates would be necessary to ensure that stocking could be beneficial to purge del-eterious effect linked to low genetic diversity.
The redundancy analysis revealed that after controlling for spatial autocorrelation, a marginally significant effect of stocking (second stocking PC- axis, associated with source lake Tremblant; PVE = 8.8%) was observed on the variation of deleterious alleles. This supports the idea that stocking has had an impact on putative deleterious mutations frequencies. Lake Tremblant showed the fourth highest ratio of potential deleterious SNPs across all popula-tions and was the highest across source populafourth highest ratio of potential deleterious SNPs across all popula-tions (71% of the 113 putative deleterious SNPs are present in this population). Moreover, this lake is also characterized by the second highest average fre-quencies of potential deleterious alleles across all populations and the highest among source populations (average minor alleles’ fre-quencies of 0.23). It was also the only source population with fixed deleterious mutations. Its ratio of potential deleterious mutations over ratio of polymorphic SNPs exceeded the value of 1, suggest-ing a limited potential to purge deleterious alleles. Altogether, this suggests that the marginal effect of Lake Tremblant population ob-served by the redundancy analysis could be detrimental for stocked populations. This result highlights the importance of estimating the variability of deleterious alleles in all source populations to avoid the anthropogenic spreading of deleterious mutations.
5 | CONCLUSIONS AND MANAGEMENT
RECOMMENDATION
On the basis of a comprehensive empirical dataset, we presented the first study answering the timely question of how stocking can affect the accumulation of putative deleterious mutations and con-sequently addressed recommendations for Lake Trout management. Our results suggest a slightly more effective purifying selection on deleterious variation in stocked than in unstocked populations. Nevertheless, stocking may cause harmful effects on wild popula-tions, particularly when source populations are adapted to differ-ent environmdiffer-ents (i.e., hatcheries or remote populations inhabiting a distinct environment). In natural Lake Trout populations, lake size was positively associated with genetic diversity (Perrier et al., 2017), which points to the importance of avoiding small size lakes as stock-ing sources. In this study, an effect of stockstock-ing associated with the source lake Tremblant was observed on deleterious mutations vari-ability. Across our sampling of lakes, Tremblant is a medium size lake that showed relatively high frequency/fixed deleterious mutations. In addition, this lake appears to have difficulty purging its deleterious mutations, which overall suggests that fish supplementation from this source is not desirable and should be avoided. This result high-lights the importance of assessing the genetic variability (including
neutral and maladaptive alleles) before choosing a source for stock-ing and to avoid the spreadstock-ing of deleterious mutations in the wild. Moreover, choosing a stocking source from the same area with similar environmental conditions should be favored with the goal to minimize potential impacts on recipient population’s local adapta-tion. However, local adaptation is not always related to geography. For instance, ecotypic variation, such as piscivorous and planktivo-rous Lake Trout, could be intermingled across large geographic areas (Bernatchez et al., 2016). Therefore, phenotypic traits such as diet regime and growth rate could also represent other important cues to be considered before choosing a population as a source of stocking in Lake Trout.
ACKNOWLEDGEMENTS
We thank all biologists and technicians of the Ministère des Forêts, de la Faune et des Parcs du Québec (MFFP), particularly Isabel Thibault and Éliane Valiquette, for sampling. We are grate-ful to Clément Rougeux, Olivier Morissette, and Simon Bernatchez for assistance in the DNA extraction and the library preparation, to Éric Normandeau and Jérémy LeLuyer for the bio- informatics assistance. We are also thankful to four anonymous reviewers and editor Sean Hoban for their constructive comments on a previous version of the manuscript. This work was assisted through par-ticipation in the Next generation genetic monitoring Investigative Workshop at the National Institute for Mathematical and Biological Synthesis, sponsored by the National Science Foundation through NSF Award #DBI- 1300426, with additional support from The University of Tennessee, Knoxville. Any opinions, findings, and conclusions or recommendations expressed in this material are those of the author(s) and do not necessarily reflect the views of the National Science Foundation. This research was funded by the MFFP, The Canadian Research Chair in Genomics and Conservation of Aquatic Resources, and by a Strategic Project Grant from the Natural Science and Engineering Research Council of Canada (NSERC) to LB.
CONFLIC T OF INTEREST
The authors declare no conflict of interests.
AUTHORS CONTRIBUTION
L.B. and C.P. conceived the study. C.P. carried out laboratory work. A.- L.F. did bioinformatic analyses. A.- L.F. and M.L. carried out sta-tistical analyses and wrote the manuscript. All co- authors critically revised and contributed to editing the manuscript and approved the final version to be published.
DATA ARCHIVING STATEMENT
Individual read raw sequences have been submitted at the Sequence Read Archive (SRA) (Project Accession Number: SRP149671).
ORCID
Anne-Laure Ferchaud http://orcid.org/0000-0002-9577-5508
REFERENCES
Adzhubei, I. A., Schmidt, S., Peshkin, L., Ramensky, V. E., Gerasimova, A., Bork, P., … Sunyaev, S. R. (2010). A method and server for predict-ing damagBork, P., … Sunyaev, S. R. (2010). A method and server for predict-ing missense mutations. Nature Methods, 7(4), 248–249. https://doi.org/10.1038/nmeth0410-248
Agrawal, A. F., & Whitlock, M. C. (2012). Mutation load: The fitness of individuals in populations where deleterious Alleles are abundant.
Annual Review of Ecology, Evolution, and Systematics, 43, 115–135.
https://doi.org/10.1146/annurev-ecolsys-110411-160257
Aljanabi, S. M., & Martinez, I. (1997). Universal and rapid salt- extraction of high quality genomic DNA for PCR- based techniques. Nucleid
Acids Research, 25, 4692–4693.
Allendorf, F. W., Aitken, S. N., & Luikart, G. (2013). Conservation and the
genetics of populations. Oxford, UK: Wiley-Blackwell Publishing.
Andrews, S. (2010). FastQC: A quality control tool for high throughput sequence data.
Balick, D. J., Do, R., Cassa, C. A., Reich, D., & Sunyaev, S. R. (2015). Dominance of deleterious alleles controls the response to a pop-ulation bottleneck (G Coop, Ed,). PLoS Genetics, 11, e1005436–23. https://doi.org/10.1371/journal.pgen.1005436
Benazzo, A., Trucchi, E., Cahill, J. A., Maisano Delser, P., Mona, S., Fumagalli, M., … Ciucci, P. (2017). Survival and divergence in a small group: The extraordinary genomic history of the endan-gered Apennine brown bear stragglers. Proceedings of the National
Academy of Sciences, 114, E9589–E9597. https://doi.org/10.1073/
pnas.1707279114
Benestan, L., Quinn, B. K., Maaroufi, H., Laporte, M., Clark, F. K., Greenwood, S. J., … Bernatchez, L. (2016). Seascape genomics pro-vides evidence for thermal adaptation and current- mediated popu-lation structure in American lobster (Homarusamericanus). Molecular
Ecology, 25, 5073–5092. https://doi.org/10.1111/mec.13811
Bernatchez, S., Laporte, M., Perrier, C., Sirois, P., & Bernatchez, L. (2016). Investigating genomic and phenotypic parallelism between piscivo-rous and planktivopiscivo-rous lake trout (Salvelinusnamaycush) ecotypes by means of RADseq and morphometrics analyses. Molecular Ecology,
25, 4773–4792. https://doi.org/10.1111/mec.13795
Berthelot, C., Brunet, F. E. D. E. R., Chalopin, D., Juanchich, A., Bernard, M., Noël, B., … Guiguen, Y. (2014). The rainbow trout genome pro-vides novel insights into evolution after whole- genome duplication in vertebrates. Nature communications, 5, 1–10.
Bosshard, L., Dupanloup, I., Tenaillon, O., Bruggmann, R., Ackermann, M., Peischl, S., & Excoffier, L. (2017). Accumulation of deleteri-ous mutations during bacterial range expansions. Genetics, 207, 669–684.
Boulesteix, A.-L., Janitza, S., Kruppa, J., & Konig, I. (2012). Overview of random forest methodology and practical guidance with emphasis on computational biology and bioinformatics. WIREs Data Mining
and Knowledge Discovery, 2, 493–507. https://doi.org/10.1002/
widm.1072
Catchen, J. M., Amores, A., Hohenlohe, P., Cresko, W., & Postlethwait, J. H. (2011). Stacks: Building and genotyping loci de novo from short- read sequences. G3: Genes Genomes Genetics, 1, 171–182. https://doi. org/10.1534/g3.111.000240
Catchen, J., Hohenlohe, P. A., Bassham, S., Amores, A., & Cresko, W. A. (2013). Stacks: An analysis tool set for population genomics. Molecular
Ecology, 22, 3124–3140. https://doi.org/10.1111/mec.12354
Charlesworth, B. (2012). The effects of deleterious mutations on evo-lution at linked sites. Genetics, 190, 5–22. https://doi.org/10.1534/ genetics.111.134288
Charlesworth, D., & Willis, J. H. (2009). Fundamental concepts in genet-ics: The genetics of inbreeding depression. Nature Reviews Genetics,
10, 783–796. https://doi.org/10.1038/nrg2664
Chen, J., Glémin, S., & Lascoux, M. (2017). Genetic diversity and the effi-cacy of purifying selection across plant and animal species. Molecular
Biology and Evolution, 34, 1417–1428. https://doi.org/10.1093/
molbev/msx088
Chen, X., & Ishwaran, H. (2012). Random forests for genomic data analysis. Genomics, 99, 323–329. https://doi.org/10.1016/j. ygeno.2012.04.003
Choi, Y., Sims, G. E., Murphy, S., Miller, J. R., & Chan, A. P. (2012). Predicting the functional effect of amino acid substitutions and indels. PLoS ONE, 7, e46688–13. https://doi.org/10.1371/journal. pone.0046688 Danecek, P., Auton, A., Abecasis, G., Albers, C. A., Banks, E., DePristo, M. A., … 1000 Genomes Project Analysis Group (2011). The variant call format and VCFtools. Bioinformatics, 27, 2156–2158. https://doi. org/10.1093/bioinformatics/btr330 Dehal, P., & Boore, J. L. (2005). Two rounds of whole genome duplica-tion in the ancestral vertebrate (P Holland, Ed,). PLOS Biology, 3, e314–e319. https://doi.org/10.1371/journal.pbio.0030314
Diss, G., Gagnon-Arsenault, I., Dion-Côté, A.-M., Vignaud, H., Ascencio, D. I., Berger, C. M., & Landry, C. R. (2017). Gene duplication can impart fragility, not robustness, in the yeast protein interaction network. Science, 355, 630–634. https://doi.org/10.1126/science. aai7685
Fay, J. C., Wyckoff, G. J., & Wu, C.-I. (2001). Positive and negative selec-tion on the human genome. Genetics, 158, 1227–1234.
Foll, M., & Gaggiotti, O. (2008). A genome- scan method to identify se-lected loci appropriate for both dominant and codominant mark-ers: A Bayesian perspective. Genetics, 180, 977–993. https://doi. org/10.1534/genetics.108.092221
Frankham, R., Ballou, J. D., & Briscoe, D. A. (2010). Introduction to
conser-vation genetics, 2nd ed. Cambridge, UK: Cambridge University Press.
https://doi.org/10.1017/CBO9780511809002
Goldstein, B. A., Polley, E. C., & Briggs, F. B. S. (2011). Random forests for genetic association studies. Statistical Applications in Genetics and
Molecular Biology, 10, 32.
Gosselin, T., Anderson, E. C., & Bradbury, I. R. (2016). assigner: Assignment analysis with GBS/RAD data using R.
Gosselin, T., & Bernatchez, L. (2016). stackr: GBS/RAD data explora-tion, manipulation and visualization using R. R package version… Retrieved from https://github.comthierrygosselinstackr. doi.zenodo Hair, J. F., Black, W. C., Babin, B. J., Anderson, R. E., & Tatham, R. L.
(1998). Multivariate data analysis. Upper Saddle River, NJ: Pearson Prentice Hall.
Halbisen, M. A., & Wilson, C. C. (2009). Variable introgression from sup-plemental stocking in southern Ontario populations of Lake Trout.
Transactions of the American Fisheries Society, 138, 699–719. https://
doi.org/10.1577/T07-135.1
Hughes, A. L. (2005). Evidence for abundant slightly deleterious poly-morphisms in bacterial populations. Genetics, 169, 533–538. https:// doi.org/10.1534/genetics.104.036939
Jaillon, O., Aury, J.-M., Brunet, F., Petit, J.-L., & Stange-Thomann, N. (2004). Genome duplication in the teleost fish Tetraodon
nigro-viridis reveals the early vertebrate proto- karyotype. Nature, 432,
1–12.
Jombart, T., & Ahmed, I. (2011). adegenet 1.3- 1: New tools for the analy-sis of genome- wide SNP data. Bioinformatics, 27, 3070–3071. https:// doi.org/10.1093/bioinformatics/btr521
Jombart, T., Devillard, S., & Balloux, F. (2010). Discriminant analysis of principal components: a new method for the analysis of genetically. 1–15.
Keightley, P., & Lynch, M. (2003). Toward a realistic model of mu-tations affecting fitness. Evolution, 57, 683–685. https://doi. org/10.1111/j.0014-3820.2003.tb01561.x
Kimura, M. (1983). The neutral theory of molecular evolution. Cambridge, UK: Cambridge University Press. https://doi.org/10.1017/ CBO9780511623486
Kimura, M., Maruyama, T., & Crow, J. (1963). The mutation load in small populations. Genetics, 48, 1303–1312.
Laenen, B., Tedder, A., Nowak, M. D., Toräng, P., Wunder, J., Wötzel, S., … Slotte, T. (2018). Demography and mating sys-tem shape the genome- wide impact of purifying selection in
Arabisalpina. Proceedings of the National Academy of Sciences, 117,
201707492–201707496.
Lamaze, F. C., Garant, D., & Bernatchez, L. (2012). Stocking impacts the expression of candidate genes and physiological condition in intro-gressed brook charr (Salvelinus fontinalis) populations. Evolutionary
Applications, 6, 393–407.
Lande, R. (1994). Risk of population extinction from fixation of new deleterious mutations. Evolution, 48, 1460–1469. https://doi. org/10.1111/j.1558-5646.1994.tb02188.x
Laporte, M., Pavey, S. A., Rougeux, C., Pierron, F., Lauzent, M., Budzinski, H., … Bernatchez, L. (2016). RAD sequencing reveals within- generation polygenic selection in response to anthropogenic organic and metal contamination in North Atlantic Eels. Molecular Ecology,
25, 219–237. https://doi.org/10.1111/mec.13466
Le Luyer, J., Laporte, M., Beacham, T. D., Kaukinen, K. H., Withler, R. E., Leong, J. S., … Bernatchez, L. (2017). Parallel epigenetic modifi-cations induced by hatchery rearing in a Pacific salmon. Proceedings
of the National Academy of Sciences, 114, 12964–12969. https://doi.
org/10.1073/pnas.1711229114
Legendre, P., & Legendre, L. (1998). Numerical Ecology. New York City, NY: Elsevier Science.
Létourneau, J., Ferchaud, A.-L., Le Luyer, J., Laporte, M., Garant, D., & Bernatchez, L. (2017). Predicting the genetic impact of stocking in Brook Charr (Salvelinusfontinalis) by combining RAD sequencing and modeling of explanatory variables. Evolutionary Applications, 11, 577–592.
Lischer, H. E. L., & Excoffier, L. (2012). PGDSpider: An automated data conversion tool for connecting population genetics and genomics programs. Bioinformatics, 28, 298–299. https://doi.org/10.1093/ bioinformatics/btr642
Lynch, M., Conery, J., & Burger, R. (1995). Mutation accumulation and the extinction of small populations. American Naturalist, 146, 489–518. https://doi.org/10.1086/285812
Macqueen, D. J., & Johnston, I. A. (2014). A well- constrained estimate for the timing of the salmonid whole genome duplication reveals major decoupling from species diversification. Proceedings of the
Royal Society B: Biological Sciences, 281, 20132881. https://doi.
org/10.1098/rspb.2013.2881
Marie, A. D., Bernatchez, L., & Garant, D. (2010). Loss of ge-netic integrity correlates with stocking intensity in brook charr (Salvelinusfontinalis). Molecular Ecology, 19, 2025–2037. https://doi. org/10.1111/j.1365-294X.2010.04628.x
McCracken, G. R., Perry, R., Keefe, D., & Ruzzante, D. E. (2013). Hierarchical population structure and genetic diversity of lake trout (Salvelinusnamaycush) in a dendritic system in Northern Labrador.
Freshwater Biology, 58, 1903–1917. https://doi.org/10.1111/
fwb.12179
Northrup, S., Connor, M., & Taylor, E. B. (2010). Population structure of lake trout (Salvelinusnamaycush) in a large glacial- fed lake inferred from microsatellite DNA and morphological analysis. Canadian
Journal of Fisheries and Aquatic Sciences, 67, 1171–1186. https://doi.
Peischl, S., Dupanloup, I., Foucal, A., Jomphe, M., Bruat, V., Grenier, J. C., … Excoffier, L. (2017). Relaxed selection during a recent human expansion. Genetics, 208, 763–777.
Perrier, C., Ferchaud, A.-L., Sirois, P., Thibault, I., & Bernatchez, L. (2017). Do genetic drift and accumulation of deleterious mutations pre-clude adaptation? Empirical investigation using RADseq in a north-ern lacustrine fish. Molecular Ecology, 26, 6317–6335. https://doi. org/10.1111/mec.14361
Piller, K. R., Wilson, C. C., Lee, C. E., & Lyons, J. (2005). Conservation genetics of inland Lake Trout in the upper Mississippi River Basin: Stocked or native ancestry? Transactions of the American Fisheries
Society, 134, 789–802. https://doi.org/10.1577/T04-040.1
Poland, J. A., Brown, P. J., Sorrells, M. E., & Jannink, J.-L. (2012). Development of high- density genetic maps for barley and wheat using a novel two- enzyme genotyping- by- sequencing approach (T Yin, Ed,). PLoS ONE, 7, e32253–e32258. https://doi.org/10.1371/ journal.pone.0032253
Pujolar, J. M., Jacobsen, M. W., Frydenberg, J., Als, T. D., Larsen, P. F., Maes, G. E., … Hansen, M. M. (2013). A resource of
genome- wide single- nucleotide polymorphisms generated
by RAD tag sequencing in the critically endangered European eel. Molecular ecology resources, 13, 706–714. https://doi. org/10.1111/1755-0998.12117
Raymond, M., & Rousset, F. (1995). GENEPOP (version 1.2): Population genetics software for exact tests and ecumenicism. Journal of
Heredity, 86, 248–249. https://doi.org/10.1093/oxfordjournals.
jhered.a111573
Renaut, S., & Rieseberg, L. H. (2015). The accumulation of deleteri-ous mutations as a consequence of domestication and improve-ment in sunflowers and other compositae crops. Molecular Biology
and Evolution, 32, 2273–2283. https://doi.org/10.1093/molbev/
msv106
Rousset, F. (2008). Genepop’007: A complete reimplementation of the Genepop software for Windows and Linux. Molecular Ecology Resources,
8, 103–106. https://doi.org/10.1111/j.1471-8286.2007.01931.x
Scott, W., & Crossman, E. (1998). Freshwater fishes of Canada. Ottawa: Galt House Publications.
Valiquette, E., Perrier, C., Thibault, I., & Bernatchez, L. (2014). Loss of genetic integrity in wild lake trout populations following stocking: Insights from an exhaustive study of 72 lakes from Québec, Canada.
Evolutionary Applications, 7, 625–644. https://doi.org/10.1111/
eva.12160
Vasemägi, A., Sulku, J., Bruneaux, M., Thalmann, O., Mäkinen, H., & Ozerov, M. (2017). Prediction of harmful variants on mitochon-drial genes: Test of habitat- dependent and demographic effects in a euryhaline fish. Ecology and Evolution, 7, 3826–3835. https://doi. org/10.1002/ece3.2989
Weir, B. S., & Cockerham, C. C. (1984). Estimating F- statistics for the analysis of population structure. Evolution, 38, 1358–1370.
Whitlock, M. C., Griswold, C. K., & Peters, A. D. (2003). Compensating for the meltdown: The critical effective size of a population with del-eterious and compensatory mutations. Annales Zoologici Fennici, 40, 169–183.
Wilson, C. C., & Mandrak, M. (2003). History and evolution of lake trout in Shield lakes: Past and future challenges. In J. M. Gunn, R. J. Steedman & R. A. Ryder (Eds.), Boreal shield watersheds (pp. 1–15). Boca Raton, FL: CRC Press.
Wright, S. (1931). Evolution in Mendelian populations. Genetics, 16, 99–159.
Wu, T. D., & Nacu, S. (2010). Fast and SNP- tolerant detection of com-plex variants and splicing in short reads. Bioinformatics, 26, 873–881. https://doi.org/10.1093/bioinformatics/btq057
Zhang, M., Zhou, L., Bawa, R., Suren, H., & Holliday, J. A. (2016). Recombination rate variation, hitchhiking, and demographic history shape deleterious load in poplar. Molecular Biology and Evolution, 33, 2899–2910. https://doi.org/10.1093/molbev/msw169
SUPPORTING INFORMATION
Additional supporting information may be found online in the Supporting Information section at the end of the article.
How to cite this article: Ferchaud A-L, Laporte M, Perrier C,
Bernatchez L. Impact of supplementation on deleterious mutation distribution in an exploited salmonid. Evol Appl. 2018;11:1053–1065. https://doi.org/10.1111/eva.12660