Physics Procedia 00 (2008) 000–000
www.elsevier.com/locate/XXX
Proceedings of the JMSM 2008 Conference
Optical properties of ZnO/silica nanocomposites prepared by sol-gel
method and deposited by dip-coating technique
D. Djouadi
a,*, A. Chelouche
a, A. Aksas
a, M. Sebais
baLaboratoire de Génie de l’Environnement , Université de Béjaia, Route de Targa Ouzemmour 06000. bLaboratoire de Cristallographie, Université de Constantine, Route de Ain el Bey 25000.
Elsevier use only: Received date here; revised date here; accepted date here
Abstract
ZnO/silica nanocomposites films were prepared by sol-gel method and deposited by dip- coating technique. Fourier Transform Infrared (FTIR) spectroscopy revealed the inclusion of ZnO crystallites in silica thin films. The presence of excitonic peaks in optical absorption spectrum confirms the introduction of ZnO crystallites in silica matrix. The photoluminescence spectrum of studied nanocomposite shows a large luminescence (from 1.8 eV to 3.2 eV). This broad luminescence can be considered as a superposition of 4 bands centered on 2.93, 2.57, 2.22 and 2.03 eV. This result shows that the elaborated samples can be used for different technological applications.
© 2009 Elsevier B.V.
PACS: 81.40.Tv ; 70.30.-j ; 78.67.Bf
Key words: Nanocomposites, ZnO, sol-gel, dip-coating, photoluminescence.
Introduction
Due to their very interesting physical properties, nanomaterials have been the subject of intense scientific and technological activities. These features reside mainly in the influence of quantum confinement leading to the dependence of these properties to the size and shape of confined media. Embedded in a transparent matrix, nanoparticles found many applications in photocatalysis [1] lithography [2] and optics [3]. Zinc oxide (ZnO) is, among the nanostructured oxide semiconductor, the most promising for application in photonics and optoelectronics, because of its large gap (3.37 eV at room temperature) and its large exciton binding energy (60 meV). ZnO coatings have been elaborated by various methods such as thermal evaporation [4], spray pyrolysis [5] and the sol-gel method [6].
In this work we have elaborate ZnO/silica nanocomposite thin films by direct inclusion of ZnO particles in liquid state silica. Coatings deposition is carried out by dip-coating technique. Obtained samples were characterized by Fourier Transform Infrared (FTIR) spectroscopy, optical absorption and photoluminescence.
* Corresponding author. Tel.: +213 34 21 43 18; fax: +213 34 21 43 18.
E-mail address: djameldjouadi@yahoo.fr
Received 1 January 2009; received in revised form 31 July 2009; accepted 31 August 2009 Physics Procedia 2 (2009) 701–705
www.elsevier.com/locate/procedia
doi:10.1016/j.phpro.2009.11.013
1. Experimental procedure
ZnO powder used to elaborate ZnO/silica nanocomposite was obtained by mechanical crushing in an argon
atmosphere during 48 hours of the bulk ZnO. Silica sol was prepared by mixing TEOS [Si (OC2H5)4], water and
ethanol. The mixture was kept under magnetic stirring for a sufficient period to hydrolysis. HCl acid was used as a catalyst (a few drops). The obtained silica sol is clear, transparent and having low viscosity. The sol is then left for several days to acquire an adequate viscosity for coatings deposition. ZnO powder obtained by mechanical crushing was added to distilled water and then agitated to get a homogeneous solution. This latter solution is left for sedimentation during a few hours. The solution near the free surface (assumed to contain very small ZnO particles)
was separated and then mixed with ethanol and TEOS. The used glass substrate (25x25 mm2) is cleaned to ensure a
good adhesion of coatings on the substrate and to obtain a uniform thickness layers. The deposition is carried out at room temperature in air with a controlled withdrawal speed of 2 mm/min. Samples were then placed in an autoclave at 100 °C for drying. Then the films are annealing at 350 °C in order to eliminate organic products and to have a xerogel densification. After annealing, the elaborated coatings are transparent and adhere well to the substrate.
The FT-IR spectrum was recorded by the Shimadzu M-8101 FTIR spectrophotometer. Optical absorption measurement was carried out by a Shimadzu UV-3101 UV-Visible spectrophotometer. Photoluminescence characterization is done by using a Perkin-Elmer LS 50 spectrometer. All the different measurements carried out in this work were recorded at room temperature.
2. Results and Discussions
Optical absorption spectrum of silica sol is shown in Figure 1 (a). There is no absorption in the spectral range 350 - 240 nm and a significant increase is observed for energies greater than 5.2 eV. Silica optical gap estimated by second derivative spectrum method is equal to 6.2 eV (Figure 1 (a) Insertion). This gap value indicates the transparency of silica sol in UV and visible range. Optical absorption spectrum of silica sol in which ZnO crystallites are introduced is shown in Figure 1 (b). The peak at 4.52 eV is due to excitonic transition which is the result of discrete energy levels characteristic of nanocrystals. This result confirms the presence of nanomitric size ZnO crystals in silica sol used for coatings deposition.
Fig. 1. Optical absorption of silica sol (a) and ZnO particles embedded in silica sol (b). Inserts: silica sol (a) and ZnO particles embedded in silica sol (b) optical gaps
The optical gap of ZnO crystallites embedded in silica sol, determined by second derivative spectrum, is equal to 4.37 eV (Fig. 1 (b): insertion). This gap is shifted to the higher energies than bulk ZnO. This large shift (1 eV) testifies that ZnO particles sizes are nanometric. Crystallites size (assumed to be spherical) was calculated by the following formula [7]: D e m m D h bulk E nano E r h e g g 0 2 * * 2 2 2 8 . 1 1 1 2 ) ( ) ( ε πε − ¸¸¹ · ¨¨© § + + = (1) 4,0 4,5 5,0 5,5 6,0 0,0 0,5 1,0 1,5 2,0 2,5 3,0 3,5 (a) O p ti c a l d e n s ity (a .u ) Energy (eV) 4,0 4,5 5,0 5,5 6,0 -120 -100 -80 -60 -40 -20 0 20 40 60 80 6.2 S e cond der iv at iv e (a. u) Energy (eV) 2 3 4 5 -40 -20 0 20 40 4,37 eV S ec onde der ivat iv e (a. u) Energy (eV) 2 3 4 5 0,0 0,5 1,0 1,5 2,0 2,5 3,0 (b) 4,52 eV O p ti c a l d e n s ity (a .u ) Energy (eV)
Where *
e
m and *
h
m are effective masses of electron and hole respectively,
h
- is Planck's constant,ε
0- vacuumdielectric permittivity, εr- semiconductor relative dielectric permittivity,
e
- electron charge andD
is thecrystallites size.
The estimated average size of crystallites is about 2.6 nm. On the other hand, using the empirical Meulenkamp formula [8]: D c D b a+ − = 2 2 1 1240 λ (2) Where 2 1
λ
is the wavelength at which the absorption is 50 % of that at the excitonic peak,D
-represents thecrystallites average diameter and a, b, c are constants (a = 3.556; b = 799.9 and c =22.64). Using this formula, the average diameter is about 1.7 nm. ZnO crystallites dispersed in silica sol are so in strong confinement regime.
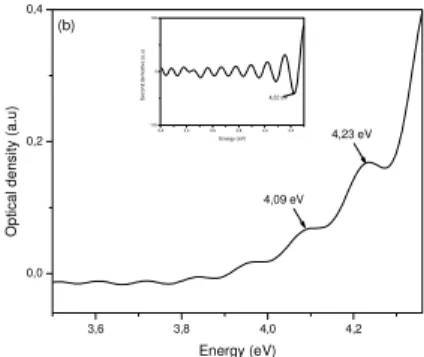
Optical absorption spectrum of ZnO/SiO2nanocomposite thin films deposited on a glass substrate by dip-coating
technique is shown in Figure 2. Spectrum in spectral range from 3.4 eV to 4 eV shows the Fabry-Perot interference. This phenomenon occurs when coating are deposited on both sides of substrate.
Fig. 2. ZnO/SiO2nanocomposites optical absorption.
Insertion :second derivative spectrum.
The shoulder observed at 4.09 eV is probably due to pores because the same shoulder appears in silica absorption spectrum. The relatively low intense band at 4.22 eV is due to band-to-band transition in ZnO crystallites. Optical gap of ZnO crystallites dispersed in silica matrix deposited by dip-coating technique is equal to 4.22 eV (Fig. 2: insertion). This result indicate that the gap is shifted (0.85 eV) to the higher energies than bulk ZnO. Crystallites radius calculated by formula (1) is about 1.4 nm. Using formula (2) we obtain a diameter of 1.8 nm.
The FT-IR spectrum of the ZnO/SiO2nanocomposite thin film deposited on a glass substrate is shown in fig. 3.
The broad band at 1100 cm-1is attributed to the stretching vibration of Si-O-Si and the band at 810 cm-1is due to
Si-O-Si deformation [9]. The bands located at 950 cm-1and 870 cm-1are due to Zn-O-Si and SiH
2stretching vibration
respectively. The band at 451 cm-1is assigned to the Zn-O stretching vibration in ZnO lattice [10]. This result
confirms well the incorporation of ZnO crystallites in silica matrix.
3,6 3,8 4,0 4,2 0,0 0,2 0,4 (b) 4,23 eV 4,09 eV Op ti c a l d e n s ity (a .u ) Energy (eV) 3,2 3,4 3,6 3,8 4,0 4,2 -100 0 100 4,22 eV S econd der ivat ive (a. u) Energy (eV)
500 1000 0 SiH2 stretching Zn-O stretching Si-O-Si deformation Zn-O-Si stretching Si-O-Si stretching In tens ity (a. u) Wavenumbers (cm-1 )
Fig. 3. FT IR spectrum of ZnO /SiO2 nanocomposite thin film
Silica thin layer obtained by sol-gel method and deposited by dip-coating technique provides a broad luminescence which ranges from 1.75 to 3.25 eV (Figure 4 (a)). This spectrum shows the contribution of 3 bands: One band of low intensity whose maximum is located at 2.89 eV, a second band of lesser intensity at 2.57 eV and a third one at 2.18 eV. The band at 2.89 eV is attributed to the transition from defect levels in the gap. Theses defects are mainly the pores [11]. Hreniah [12] observed a band luminescence in pure silica at 2.57 eV and suggested that the radical Si - OH is responsible for this luminescence. The very intense band at 2.18 eV is due to the presence of hydrogen on the silica surface [13]. The width of this band reflects the wide range of energy transition.
Fig. 4. Photoluminescence spectrum of pure silica (a) and ZnO/SiO2nanocomposite (b)
Photoluminescence spectrum of ZnO/SiO2nanocomposite thin film deposited on a glass substrate by dip-coating
technique and obtained by sol-gel method is shown in Figure 4 (b). A wide luminescence which ranges from 1.9 to 3.2 eV is observed. The spectrum can be considered as the superposition of 4 bands: one at 2.93 eV and slightly shifted to high energy compared to the band observed in the case of pure silica but with a greater intensity, the second at 2.55 eV is in the same position as that of pure silica, a third one at 2.22 eV and the last one at 2.03 eV. The violet luminescence is attributed to the recombination of an electron from a donor level (oxygen vacancy) with a hole in the valence band [14-16]. The band at 2.55 eV is probably due to the luminescence of silica because this one was observed in the same position as that of pure silica. It may be that there is also a contribution of ZnO crystallites luminescence regarding the relatively high intensity of this band. This latter was observed in the
ZnO/SiO2nanocomposite films deposited on silicon substrates and attributed to the radiative recombination [17].
The band at 2.22 eV is assigned to the emission from deep levels [18.19]. It is generally accepted that such emissions in the visible spectrum is due to the recombination of a photo-generated hole with an electron in an
monovalent oxygen site (O-). The small yellow luminescence, at 2.03 eV, is attributed to the radiative recombination
of an electron near the conduction band with a hole trapped in an oxygen interstitial position [20]. It should be noted that the luminescence observed in the nanocomposite films elaborated in this work is mainly due to defects.
1,5 2,0 2,5 3,0 3,5 0 500 1000 1500 (a) 2.89 2.57 2.18 Intensi ty (u.a) Energy (eV) 1,8 2,0 2,2 2,4 2,6 2,8 3,0 3,2 3,4 0 200 400 600 800 1000 1200 1400 1600 1800 (b) 2,03 2,22 2,55 2,93 In tens ity (u. a) Energy (eV)
3. Conclusion
In this work were studied the optical properties of ZnO/SiO2nanocomposites thin films, prepared by sol-gel
method and deposited on glass substrates by dip-coating technique. The IR spectroscopic analysis confirms the introduction of ZnO nanoparticles in silica sol. Photoluminescence and optical absorption characteristics allowed to brought out the effects of quantum confinement induced by the very small size of ZnO crystallites. These effects are reflected by optical properties shift to high energies. Optical absorption revealed the presence exciton peaks and determines the average size of introduced crystallites. Room temperature photoluminescence spectra studied composites show a strong green luminescence attributed to ZnO structural defects.
References
[1] M. Zhang, G. Gao, C.Q. Li, F.Q. Liu, Langmiur 20 (2004) 1420. [2] S.C. Ringwald, J.E. Pemberton, Env. Sc. Technol. 34 (2004) 259.
[3] T. Chen, T. Rajh, Z.Y. Wang, M.C. Thurnauer, J. Phys. Chem. 101 (1997) 10688. [4] P. Petrov, R. Singh, D.E. Brodie, Phys. Lett. 35 (1979) 930.
[5] T. Rajh, D.M. Tiede, M.C. Thurnauer, J. Non Cryst. Sol. 207 (1996) 815.
[6] A.L. Armelao, F.M. Fabrizio, G.S. Gialanella, Z.F. Zordan, Thin Sol. Film 394 (2001) 90. [7] B. Pejova, A. Tanusevski, I. Grozdanov, J. Solid State Chem. 174 (2003) 276. [8] E. A. Meulenkamp, J. Phys. Chem. B102 (1998) 5566.
[9] R. Moleski, E. Leontidis, F. Krumeich, J. Coll. Inter. Sci. 302 (2006) 246.
[10] V.V. Siva Kumar, F. Singh, Amit Kumar, D.K. Avasthi, Nucl. Instr. Met. Phys. Res.B. 244 (2006) 91. [11] Z. Chen, Y. Wang, H. He, Y. Zou, J.W. Wang, Y. Li, Sol. Com. 135 (2005) 247.
[12] D. Hreniak, M. Jasiorski, K. Maruszewski, L. Kepinski, L. Krajczyk, J. Misiewicz, W. Strek, J. Non-Cryst. Sol. 298 (2002) 146. [13] Y. Yang, B.K. Tay, X.W. Sun, H.M. Fan, Z.X. Shen, Phys. E 31 (2006) 218.
[14] S. Mahamuni, K. Borgohain, B.S. Bendre, V.J. Leppert, Subhash H. Risbud, J. Appl. Phys. 85 N° 5 (1999) 2861. [15] H. Wei, Y. Wu, L. Wu, C. Hu, Mat. Lett. 59 (2005) 271.
[16] M. Shim, P. Guyot-Sionnest, J. Am. Chem. Soc. 123 (2001) 11651.
[17] K-K. Kim, N. Koguchi, Y-W. Ok, T-Y. Seong, S-J. Park, App. Phys. Lett. 84 (2004) 3810. [18] A. Dijken, E.A. Meulenkamp, D. Vanmaekelbergh, A. Meijerink, J. Lum. 90 (2000) 123.
[19] S.T. Tan, X.W. Suna, X.H. Zhangb, B.J. Chena, S.J. Chuab, Anna Yongb, Z.L. Dongc, X. Huc, J. Crys. Grow. 290 (2006) 518. [20] U. Pal, J.G. Serrano, P. Santiago, G. Xiong,K.B. Ucer, R.T. Williams, Opt. Mat. 29 (2006) 65.