HAL Id: hal-01585222
https://hal.sorbonne-universite.fr/hal-01585222
Submitted on 11 Sep 2017HAL is a multi-disciplinary open access archive for the deposit and dissemination of sci-entific research documents, whether they are pub-lished or not. The documents may come from teaching and research institutions in France or abroad, or from public or private research centers.
L’archive ouverte pluridisciplinaire HAL, est destinée au dépôt et à la diffusion de documents scientifiques de niveau recherche, publiés ou non, émanant des établissements d’enseignement et de recherche français ou étrangers, des laboratoires publics ou privés.
of Lions, NW Mediterranean Sea
Paulo Bonifácio, Antoine Grémare, Olivier Gauthier, Alicia Romero-Ramirez,
Sabrina Bichon, Jean-Michel Amouroux, Céline Labrune
To cite this version:
Paulo Bonifácio, Antoine Grémare, Olivier Gauthier, Alicia Romero-Ramirez, Sabrina Bichon, et al.. Long-term (1998 vs. 2010) large-scale comparison of soft-bottom benthic macrofauna composition in the Gulf of Lions, NW Mediterranean Sea. Journal of Sea Research (JSR), Elsevier, 2018, 131, pp.32-45. �10.1016/j.seares.2017.08.013�. �hal-01585222�
Long-term (1998 vs. 2010) large-scale comparison of soft-bottom benthic macrofauna composition in the Gulf of Lions, NW Mediterranean Sea
Paulo Bonifácio, Antoine Grémare, Olivier Gauthier, Alicia Romero-Ramirez, Sabrina Bichon, Jean-Michel Amouroux, Céline Labrune
PII: S1385-1101(16)30340-9
DOI: doi:10.1016/j.seares.2017.08.013
Reference: SEARES 1595
To appear in: Journal of Sea Research
Received date: 29 November 2016 Revised date: 2 August 2017 Accepted date: 27 August 2017
Please cite this article as: Paulo Bonifácio, Antoine Grémare, Olivier Gauthier, Alicia Romero-Ramirez, Sabrina Bichon, Jean-Michel Amouroux, Céline Labrune , Long-term (1998 vs. 2010) large-scale comparison of soft-bottom benthic macrofauna composition in the Gulf of Lions, NW Mediterranean Sea. The address for the corresponding author was captured as affiliation for all authors. Please check if appropriate. Seares(2017), doi:
10.1016/j.seares.2017.08.013
This is a PDF file of an unedited manuscript that has been accepted for publication. As a service to our customers we are providing this early version of the manuscript. The manuscript will undergo copyediting, typesetting, and review of the resulting proof before it is published in its final form. Please note that during the production process errors may be discovered which could affect the content, and all legal disclaimers that apply to the journal pertain.
ACCEPTED MANUSCRIPT
Long-term (1998 vs. 2010) large-scale comparison of
soft-bottom benthic macrofauna composition in the Gulf of Lions,
NW Mediterranean Sea
Paulo Bonifácio a,b, Antoine Grémare a, Olivier Gauthier c, Alicia Romero-Ramirez a, Sabrina Bichon a, Jean-Michel Amouroux b, Céline Labrune b
a
Université de Bordeaux, CNRS, EPOC, UMR 5805, F-33400 Talence, France b
Sorbonne Universités, UPMC Université Paris 06, CNRS, LECOB, UMR 8222, Observatoire Océanologique, F-66650 Banyuls-sur-Mer, France
c
Laboratoire des Sciences de l’Environnement Marin (LEMAR), CNRS, UMR 6539, Institut Universitaire Européen de la Mer, Université de Bretagne Occidentale, rue Dumont d’Urville, F-29280 Plouzané, France
ACCEPTED MANUSCRIPT
Abstract
We achieved a long term (i.e., 1998 vs. 2010) large scale (i.e., whole Gulf of Lions) study of benthic macrofauna composition in the Gulf of Lions based on the resampling of 91 stations located along 21 inshore-offshore transects. Results show that the 3 main benthic communities identified in 1998 were still present in 2010 although their composi tion changed. Using only year and station of sampling we found a significant space-time interaction explaining changes in macrofaunal community composition, and, in this study, stations differ primarily in terms of depth and distance to the Rhône river mouth. Temporal changes in benthic macrofauna composition were clearly most important at shallow stations (i.e., in the Littoral Fine Sand community) than at deep ones (i.e., Terrigenous Coastal Mud community). These results are in good agreement with the current paradigm according to which climatic oscillations such as NAO (North Atlantic Oscillation) and WeMO (Western Mediterranean Oscillation) are indirectly (i.e., through changes in the frequency of occurrence and the intensity of storms) controlling benthic macrofauna composition in the Gulf of Lions. This hypothesis is further supported by a meta-analysis of changes in the average and maximal yearly abundances of the polychaete Ditrupa arietina. At last, the spatial modelling of 1998 and 2010 benthic macrofauna compositions both suggested a significant effect of Rhône River inputs on the spatial distribution of benthic macrofauna in the Gulf of Lions.
Keywords: Zoobenthos; Macrofauna; Temporal variations; Species diversity;
ACCEPTED MANUSCRIPT
1 Introduction
The distribution of benthic macrofauna is mainly structured by 2 types of factors: (1) abiotic factors such as climatic conditions, hydrodynamics, currents, physical and chemical nature of the sediment and most disturbances induced by anthropogenic actions (Pearson and Rosenberg, 1978; Posey et al., 1996; Tunberg and Nelson, 1998; Warwick et al., 2002; Akoumianaki and Nicolaidou, 2007; Guizien et al., 2010); and (2) biotic factors directly linked to the populations themselves (e.g., competition, predation or bioturbation) (Rhoads & Young, 1970; Weinberg, 1984; Dauwe et al., 1998). The composition of benthic macrofauna may, however, vary with time and even the identity of dominant species may change from one year to the other in response to climatic variations. Such changes have been reported by several authors around the world such as in Brazil (Bernadino et al., 2015), in New Zealand (Hewitt et al., 2016), in southwest England (Mieszkowska et al., 2014), in the southern North Sea (Kröncke et al., 1998, 2001, 2011), in western Sweden (Tunberg and Nelson, 1998; Hagberg and Tunberg, 2000) or in the Mediterranean Sea (Grémare et al., 1998a; Salen-Picard et al., 2002; Labrune et al., 2007b). These studies show a direct or indirect effect of climatic variations on macrofauna communities. For instance, Kröncke et al. (1998), seasonally sampled shallow water stations off Nordeney Island in order to evaluate the relationship between the large-scale climate variation and macrobenthos community compositions. They observed that the abundance and species richness of benthic macrofauna sampled from April to July was significantly correlated with the NAO index (North Atlantic Oscillation; Hurrell, 1995). They suggested that the intermediary between NAO and benthic macrofauna was sea surface temperature in late winter and early spring. This hypothesis was supported by subsequent studies (Tunberg and Nelson, 1998; Kröncke et al., 2001; Hagberg and Tunberg, 2000; Rees et al., 2006). As highlighted by Birchenough (2015), climatic changes have high influence on sea-water temperature, hydrodynamic patterns, ocean acidification and sea-level rise-coastal squeeze. However, the expected response of macrobenthic communities to these factors is not consistent across regions as they are also affected by local-scale abiotic and biotic conditions (Birchenough et al., 2015).
Benthic macrofauna communities in the Gulf of Lions were first described by Picard (1965) on the coast of Provence (eastern part of the Gulf of Lions), and later by Guille (1970) on the Catalan coast (south-western part of the Gulf of Lions). These studies were
ACCEPTED MANUSCRIPT
carried out independently and they resulted in slightly different typologies. Based on a large-scale study of benthic macrofauna in the whole Gulf of Lions carried out during 1998, Labrune et al. (2007a) proposed a new typology consisting of 3 community types and established the correspondence with the two previously proposed typologies (Picard, 1965; Guille,1970). Up to now, temporal changes in benthic macrofauna composition in the Gulf of Lions have only been assessed through small spatial scales studies and only at the 2 extremities of the Gulf of Lions. Historically, this spatial aggregation of local-scale studies is linked to the existence of two marine stations (Banyuls-sur-Mer and Endoume) each primarily working on their doorstep.
In the Bay of Banyuls-sur-Mer (south-western part of the Gulf of Lions) previous studies have suggested a relationship between climatic variability and changes in benthic macrofauna composition (Grémare et al., 1998a; Labrune et al., 2007b). These studies identified long-term changes in several communities between 1967/68, 1994 and 2003. These changes involved temporal fluctuations in: (1) total species richness, and (2) abundances of dominant species such as the polychaetes Ditrupa arietina, Scoloplos
armiger and Notomastus latericeus. Moreover, by coupling the studies of changes in
benthic macrofauna composition with autoecological studies of D. arietina (Medernach et al., 2000), they suggested that the NAO could drive changes in benthic macrofauna composition (Grémare et al., 1998a; Labrune et al., 2007b). Positive values of NAO are typically associated with stronger-than-average westerlies and storms over Northern Europe and milder weather with less-than-average storms over Western Europe and the Mediterranean Sea (Hurrell, 1995). NAO was therefore suggested to be one of the factors indirectly (Grémare et al., 1998a) or directly (Labrune et al., 2007b) structuring benthic macrofauna in the Gulf of Lions through changes in the frequency of strong resuspension events, which may affect recruitment success. In the eastern part of the Gulf of Lions, previous studies have also shown major changes in benthic macrofauna composition in relation with water and particulate flows from the Rhône River (Massé, 2000; Salen-Picard et al., 2002, 2003; Harmelin-Vivien et al., 2009; Bonifácio et al., 2014), which is the most important river of NW Mediterranean (Durrieu de Madron et al., 2000; Bourrin et al., 2006). The macrofauna present in the Rhône delta seems to be impacted by this sedimentation (Salen-Picard et al., 2002, 2003; Harmelin-Vivien et al., 2009; Bonifácio et al., 2014), while a positive effect could also be observed during the dry season with high diversity and abundance in flood impacted stations (Bonifácio et al., 2014). Furthermore,
ACCEPTED MANUSCRIPT
Rosenberg et al. (2003) highlighted the presence of trawls tracks in both regions (south-western and eastern) of the Gulf of Lions. Trawling is known to directly affect macrobenthic communities, leading to the loss of epifauna, the smoothing of sedimentary bed forms and the reduction of bottom roughness (Tuck et al., 1998).
Although, both the NAO and the Rhône River flows have been suggested to play important structuring roles for benthic macrofauna communities at small spatial scales (Salen-Picard et al., 2002), they are also likely to play a role over the whole Gulf of Lions (Grémare et al., 1998b). Based on a meta-analysis of benthic macrofauna data collected along the portion of coast between Barcelona (Spain) and Palavas-les-Flots (France) before 1970 and during the 1990s, Grémare et al. (1998b) showed that increases in density of Ditrupa arietina occurred over this whole area. Moreover, based on the 1998 large scale sampling, Labrune et al. (2007a, 2008) identified 2 slightly different modalities of the Littoral Sandy Mud community depending on the geographical distance to the Rhône River mouth, which suggests that this river may have large-scale effect on benthic macrofauna community composition.
In 1989, Conte et al. (1989) defined the Mediterranean Oscillation (MO) as a low-frequency variability pattern producing opposing barometric, thermal and pluviometric anomalies between the extremities of the basin. More recently, and based on the MO, Martin-Vide and Lopez-Bustins (2006) proposed the Western Mediterranean Oscillation index (WeMO) which, interestingly, does not correlate significantly with the NAO index. However, these two indices both contribute to explain rainfall in the Iberian Peninsula (Martin-Vide and Lopez-Bustins, 2006) although the WeMO was more relevant than the NAO to explain monthly precipitation variation (Martin-Vide and Lopez-Bustins, 2006; Martin-Vide et al., 2008). Due to its recent publication, the WeMO (Martin-Vide and Lopez-Bustins, 2006) has barely been used yet, and its relevance for fisheries or macrobenthic communities is not clear: on the one hand, positive phase of the WeMO index present significant positive correlations with sardine and anchovy landings per unit of effort for a 35 years of time-series (Martín et al., 2012); on the other hand, no correlation was observed between landing of Sepia officialis and WeMO over 45 years of time-series (Keller et al., 2014).
Within this context, the present study aimed to: (1) assess changes in benthic macrofauna composition in the Gulf of Lions between 1998 and 2010, (2) further investigate
ACCEPTED MANUSCRIPT
the current hypothesis regarding the effect of climatic indices (e.g. NAO, WeMO) on benthic macrofauna composition, and (3) directly test the hypothesis of an effect of the Rhône River on benthic macrofauna composition over the whole Gulf of Lions.
2 Materials and Methods
2.1 Study area
The Gulf of Lions (Figure 1) is located in the NW Mediterranean. It extends about 110 km from South to North and 140 km from West to East. Several rivers flow into the Mediterranean along its 400 km of coast (Bourrin et al., 2006) but the Rhône River has, by far, the most important effect on transport and fate of particulate matter in the gulf (Durrieu de Madron et al., 2000).
Figure 1. Locations of the 21 sampled transects and the 91 sampled stations in 1998 and 2010 along the coast of the Gulf of Lions, NW Mediterranean Sea.
ACCEPTED MANUSCRIPT
2.2 Sampling
Ninety-one stations were sampled for benthic macrofauna and surface sediment characteristics during August and September 2010 (REDIT-2010 cruise) on board of the R/V Thetys and Nereis II. These stations were located along 21 inshore/offshore transects (identified by letters, A to U) between the Spanish/French border and the mouth of the Rhône River (Figure 1). This scheme was designed to allow for a long term comparison with similar data collected during the REDIT-1998 cruise, which was carried out during September and October 1998 and involved sampling in 92 stations along the same transects (Labrune et al., 2007a, 2008). Most transects were sampled at 10, 20, 30, 40 and 50 m depth. In 1998 and 2010 transect F was not sampled at 30 m and transect O and P were not sampled at 10 m. In 1998 transect E was sampled at 40 m but not in 2010. In 2010 transect O, P, Q, R and S were not sampled at 40 and 50 m but not in 1998. Consequently, 91 stations were sampled during both years so that their benthic macrofauna compositions could be directly compared. In the following, each station will be designated by the combination of a letter and a number, which correspond to the sampled transect and the sampling depth, respectively.
Some sampling stations were located between 10 and 50 m depth, the corresponding macrobenthic communities are: (1) the Littoral Fine Sands (LFS; Labrune et al., 2007a, 2008) which is mainly composed of fine sand and corresponds to the Spisula subtruncata community and part of the Nephtys hombergii community described by Guille (1970) and to the Well Sorted Fine Sand community described by Picard (1965); (2) the Littoral Sandy Mud (LSM; Labrune et al., 2007a, 2008) which is mainly composed of sandy mud or muddy sand sediments and corresponds to part of the N. hombergii community and the Scoloplos
armiger community described by Guille (1970) and to the Muddy Detritic community
described by Picard (1965); and (3) the Terrigenous Coastal Mud (TCM; Labrune et al., 2007a, 2008) which is mainly composed of muddy or pure mud sediments and corresponds to the Nucula sulcata community described by Guille (1970) and to the Terrigenous Coastal Mud community described by Picard (1965).
ACCEPTED MANUSCRIPT
2.3 Rhône River flow
The hydrological basin of Rhône River covers around 98000 km2 with a mean annual
water flow about 1700 m3.s-1 and a mean daily flow between 600 and 11000 m3.s-1 (Figure
2) depending on seasons and flood (Pont, 1997; Pont et al., 2002; Antonelli et al., 2008).
This river is the main source of riverine particulate matter input in the Gulf of Lions and accounts for 80% of total particulate inputs (Aloisi et al., 1977; Durrieu de Madron et al., 2000). The Rhône River water flow data used during the present study were kindly provided by Banque Hydro (http://www.hydro.eaufrance.fr/).
Figure 2. Temporal variability in monthly average of the Rhône River water flow with its corre sponding annual average flow. Vertical lines indicate the years of sampling and the corresponding cruises.
2.4 Climatic indices
2.4.1 North Atlantic Oscillation (NAO)
The North Atlantic Oscillation is the major force governing climate variability (anomalies) in the atmospheric circulation causing changes in the surface westerlies across the North Atlantic onto Europe (Hurrell, 1995). These changes can be displayed through several indices of NAO calculated using different approaches. In the present study, the PC-based NAO index produced by NCAR (National Center for Atmospheric Research) Climate Analysis Section which is based on Hurrell et al. (2003) was used because it is the classical
ACCEPTED MANUSCRIPT
version of the index. It corresponds to the time series of the leading Empirical Orthogonal Function (EOF) of Surface Level Pressure anomalies over the Atlantic sector (20°-80°N, 90°W-40°E). This index is used to measure NAO throughout the year, tracking the seasonal movements of the Icelandic low and the Azores high pressure areas (Hurrell and Deser, 2010). NAO index data was provided by the National Center for Atmospheric Research (NCAR, 2016; https://climatedataguide.ucar.edu/climate-data/hurrell-north-atlantic-oscillation-nao-index-pc-based). Eight-years moving averages were calculated based on annual NAO indices. Despite seasonal variations in NAO cycle NAO, a 7.7 years frequency appears to adequately describe long-term variations (Da Costa & Verdiere, 2002).
2.4.2 Western Mediterranean Oscillation (WeMO)
The WeMO is a low-frequency variability pattern of atmospheric circulation (Martin-Vide and Lopez-Bustins, 2006). The WeMO index corresponds to the difference of standardised surface atmospheric pressures between San Fernando (Spain) and Padua (Italy). The North of Italy is subjected to relative high barometric variability owing the influence of the central European anticyclone and the Ligurian low pressure area, while SW Spain is frequently subject to the influence of the Azores anticyclone. The transect linking these two zones matches with the NW Mediterranean Sea. During the positive phase, the anticyclone over the Azores encloses SW Spain and the low pressures in the Ligurian Gulf result in winds blowing from the NW. During the negative phase, the central European anticyclone located north of Italy and a low-pressure centre, in the Iberian SW, result in winds blowing from the East. The WeMO index data used during the present study originate from http://www.ub.edu/gc/English/wemo.htm (WeMO, 2017).
2.5 Sediment characteristics
At each station, a 0.1 m2 van Veen grab was taken for granulometry and CHN analyses. The upper half centimetre of the grab content was sampled, homogenized, conditioned and frozen on board. Samples used for sedimentary organics assessments were later freeze-dried. Back in the laboratory, sediment granulometry was assessed using
ACCEPTED MANUSCRIPT
a Malvern Mastersizer® 2000 laser microgranulometer and expressed as median grain diameter (D0.5 in µm). The percentage of fines content (%<63 µm) was also calculated.
Organic carbon (OC) concentrations were measured on homogenized samples using a CHN Perkin Elmer 2400 (in 1998) and a CHN Thermo Finnigan Flash EA1112 (in 2010) analyser, after acidification with 1N HCl (overnight, at 50°C) to remove carbonates (Cauwet et al., 1990).
2.6 Benthic macrofauna
At each station, 3 other 0.1 m2 van Veen grab were collected. Samples were sieved on board over a 1 mm mesh and fixed with 5% formalin buffered in seawater. Macrofauna was then sorted, identified to the lowest tractable taxonomic level (most often species) and counted. All procedures were strictly identical to those used by Labrune et al. (2007a, 2008).
2.7 Data analysis
Synonyms of scientific names of species were updated using the World Register of Marine Species (WoRMS, 2017). Species with possible doubtful identifications were pooled to homogenise species lists and taxonomic resolutions between cruises.
Univariate alpha diversity descriptors of benthic macrofauna
Abundance, station species richness (αSR) and Pielou's evenness (J’) were used as descriptors of diversity. Pielou's evenness indicates how homogeneous the individual abundance of species within a station are.
Based on the total number of individuals and species recorded at each depth, we derived rarefaction and extrapolation curves after Colwell et al. (2012, 2013). Both curves were sample-based (with each station corresponding to a single sample unit) and thus derived from the Bernouilli product model (equations 17 and 18 in Colwell et al., 2012).
ACCEPTED MANUSCRIPT
Rarefaction and extrapolation curves, so called accumulation curves (Colwell et al., 2012) were nevertheless plotted using individuals as an index of sampling effort. The overall species richness at each sampled depth (γSR) was defined as the asymptotic value of the corresponding extrapolation component of the accumulation curve.
Paired t-tests with permutations were used to evaluate whether there were uniform changes across stations in diversity descriptors between 1998 and 2010. The null hypothesis was that the mean of the difference between all pairs was 0 (i.e., no uniform trend in temporal changes across stations). For each descriptor, the probability distribution under the null hypothesis was evaluated by restricted permutations of paired observations.
Multivariate analyses
Multivariate analyses were conducted using the Hellinger distance metric, which adequately captures ecological gradients and does not attribute too much weight to rare species (Legendre and Gallagher, 2001). The Hellinger transformation replaces raw abundance scores by the square root of relative abundances. Computing Euclidean distances on this new matrix yields the Hellinger distance matrix, the transformed matrix can thus be used as an input for methods that preserve the Euclidean distance between objects to reach ecologically meaningful results. All multivariate analyses are based on this transformed matrix.
In order to visualize spatiotemporal patterns, we used unconstrained ordination (Principal Component Analysis, PCA) and non-hierarchic clustering techniques (K-means). K-means clustering was computed for all sites and both sampling periods. We conducted clustering from k=2 to k=5 groups, with 100 random starts for each value of k. We used tile plots to visualize how k-means clusters relate to depth and sampling year. In these plots squared area of each tile is proportional to the frequency in the three-way (k-means cluster, depth, year) contingency table, which allows row-wise and column-wise comparisons. We also tested whether multivariate within-group dispersion was homogenous for groups obtained by crossing the depth and year factors (i.e., 10 groups) using the PERMDISP procedure (Anderson, 2001, 2006)
ACCEPTED MANUSCRIPT
The current work being based on stations that were sampled both in 1998 and 2010, another question of interest regarding β diversity was whether a Space-Time Interaction (STI) could explain a significant part of the variance in benthic community composition. Finding a significant STI implies that benthic community compositions differed between sampling times and that these changes were not consistent across stations, thus resulting in different spatial patterns in 1998 and 2010 that should be investigated separately. In the absence of a significant STI, a significant temporal effect would be consistent across space (stations) and a significant spatial effect would be consistent across sampling times. Because our sampling design was without replication, it was necessary to under-fit a model to test for the significance of a space-time interaction (Legendre et al., 2010). For the present study, we used Redundancy Analysis (RDA) of the Hellinger transformed community matrices and model 5 of Legendre et al. (2010) that under-fits the interaction term and has correct type I error.
As the STI was significant, we modelled spatial structures separately for each sampling year. This was achieved through spatial eigenfunction analysis and RDA of the Hellinger transformed community matrices. We used both distance-based Moran’s Eigenvector Maps (dbMEM; Dray et al., 2006) and Asymmetric Eigenvector Maps (AEM; Blanchet et al., 2008b) to model non-directional and directional spatial processes. The rationale for using directional spatial modelling is that the Rhône River exerts a NW-SW influence on the system (see above). For AEM construction, we set the origin of the connection graph East of the most Eastern sampling stations (i.e., towards the mouth of the Rhône River), and chose a rook connection patterns where only sites at the same depth were linked from East to West. For the non-directional spatial processes, we used the longest branch of the minimum spanning tree as a threshold for dbMEM construction. Moreover, if present, the linear spatial trend was removed prior to dbMEM analysis. Median grain diameter (D0.5), fines content (%<63 µm), and organic carbon (OC) concentration
were also used as a set of explanatory variables. Forward selection of explanatory variables was conducted for each set of variables (i.e. AEM, dbMEM, environmental) separately (Blanchet et al., 2008a). Variance was then partitioned among sets of explanatory variables – and an eventual linear trend – by way of partial RDA (Borcard et al., 1992, 2002).
ACCEPTED MANUSCRIPT
Unless stated otherwise, all analyses were conducted using the R language (R Core Team, 2014) and the following packages: AEM (Blanchet et al., 2013), indicspecies (De Cáceres and Legendre, 2009), packfor (Dray et al., 2013), PCNM (Legendre et al., 2013), SoDA (Chambers, 2013), STI (Legendre et al., 2012), vegan (Oksanen et al., 2013) and vcd (Meyer et al., 2013). t.paired.perm.R (P. Legendre) is available at http://adn.biol.umontreal.ca/~numericalecology/Rcode/.
Further, for each sampling depth, indicator species (Dufrêne and Legendre, 1997; De Cáceres and Legendre, 2009) were identified using the IndVal method based on specificity (i.e., presence at only a single sampling depth) and fidelity (i.e., presence at a majority of stations of this sampling depth).
Meta-analysis of the relationship between the climatic indices and the abundance of Ditrupa arietina
We compiled several scientific publications and some grey literature (e.g., impact assessment studies and reports; Supplementary material) concerning studies carried out at small or large spatial scales in the Gulf of Lions between 1989 and 2013. From these studies, we summarised maximal and average yearly abundances of the dominant species
Ditrupa arietina (at stations where it was present). Linear correlations between the
corresponding time series of abundances of D. arietina and (1) the NAO index (and its 8-years moving average), and (2) the WeMO index, were computed in order to assess the possible influence of these climatic indices on the abundance of this species.
ACCEPTED MANUSCRIPT
3 Results
3.1 Sediments characteristics
For most stations, temporal changes in D0.5, fines content (%<63 µm) and OC
contents were low (Figure 3A-C). Paired t-tests with permutations showed significant (p<0.05) temporal changes at stations located at 40 m of depth for D0.5 and at 40 and 50 m
of depth for fines content. Corresponding changes consisted in an increase in D0.5 and to a
decrease in fines content between 1998 and 2010. Conversely, there was no significant change in OC contents.
3.2 General characteristics of benthic macrofauna
For an almost similar sampling effort, the total number of individuals collected was much higher in 1998 (i.e., 26806) than in 2010 (i.e., 16066). Conversely, the number of identified taxa was slightly lower in 1998 (380 and 408 taxa in 1998 and 2010, respectively). Table 1. Table 1. Relative abundances of main benthos group between 1998 and 2010.
Taxa 1998 (%) 2010 (%) Annelida 62.7 41.1 Crustacea 14.3 24.2 Mollusca 18.7 19.0 Echinodermata 2.8 3.5 Sipuncula 0.9 9.4 Miscellaneous 0.6 2.8
During both sampling cruises, benthic macrofauna was composed mostly by polychaetes followed by crustaceans (and molluscs) (Table 1). Sipuncula account for 0.9% in 1998 and 9.4% in 2010. Miscellaneous group included echiurans, cnidarians, hemichordates, nemerteans, platyhelminthes and phoronideans. In 1998, Ditrupa arietina (Polychaeta) accounted for 27.5% of total abundance followed by Owenia fusiformis (Polychaeta) and Turritella communis (Mollusca) (9.8 and 6.4%, respectively). In 2010,
ACCEPTED MANUSCRIPT
abundant taxa (7.5 and 6.0%, respectively) followed by Galathowenia oculata (Polychaeta, 4.3%).
In 1998, the most frequent taxa were: Tanaidacea, Lumbrineris spp., Glycera spp. And Ampelisca diadema, which were present at 87.9, 86.8, 71.4 and 57.1% of the sampled stations, respectively. In 2010, the most frequent taxa were: Ampelisca sarsi, Glycera spp., Ampharetidae and Tanaidacea, which were present at 85.7, 84.6, 81.3 and 80.2% of the sampled stations, respectively. Dominant species, such as Ditrupa arietina, Owenia
fusiformis, Turritella communis, Aspidosiphon muelleri, Sternaspis scutata and Galathowenia oculata, were present, respectively, at 47.3, 42.9, 46.2, 26.4, 44 and 49.5%
of the stations sampled in 1998 versus 26.4, 40.7, 37.4, 36.3, 46 and 73.6% of the stations sampled in 2010.
3.3 Univariate descriptors of benthic macrofauna alpha diversity
Temporal changes in abundances were significant for the 10, 20 and 50 m deep stations (Figure 3D). Abundances decreased between 1998 and 2010 at shallow (i.e., 10 and 20 m) stations and conversely increased at deep (i.e., 50 m) stations. Temporal changes in species αSR were significant for the 20 and 50 m deep stations (Figure 3E). αSR decreased between 1998 and 2010 at 20 m deep stations and conversely increased at 50 m deep stations. Temporal changes in J’ were significant for the 10, 20 and 50 m deep stations (Figure 3F). J’ increased between 1998 and 2010 at shallow (i.e., 10 and 20 m) stations and conversely decreased at deep (i.e., 50 m) stations.
ACCEPTED MANUSCRIPT
Figure 3. Spatiotemporal changes in surface sediments characteri stics by depth: (A) mean of D0.5 (breaks in axes between 300 and 400 µm), (B)
mean of fines content (%< 63 µm) and (C) mean of organic carbon content; and in the diversity de scriptors of benthic macrofaun a by depth: (D) abundance (breaks in axes between 1300 and 1900 ind.0.3 m-2), (E) station specie s richness and (F) Pielou’s evenness. Re sults of corresponding paired t-test with permutations (999 permutations). p-value s < 0.05 are in bold and indicated by "*" in tables and by full symbol s in charts. The signal of the t-statistic indicates the direction of changes between 1998 and 2010. Diagonal line indicates y=x.
ACCEPTED MANUSCRIPT
Temporal changes in the accumulation curves at each sampling depth are shown in
Figure 4. Overall, differences between the 1998 and 2010 curves tended to decrease with
sampling depth. For 10 m deep stations, there were important differences in the rarefaction component of the two curves, which likely reflected the above-mentioned difference in equitability (Figure 4A). Conversely, the extrapolation components of the 2 curves (i.e., 267 and 271 species in 1998 and 2010, respectively) showed almost similar asymptotic γSR values. The same pattern was true to a lesser extent at the 20 and 30 m deep stations, which resulted in slightly higher γSR in 2010 than in 1998 (i.e., 361 versus 321 species, and 424 versus 317 species for 20 and 30 m deep stations, respectively; Figures 4B, C). For the 40 m deep stations, there was no difference in the rarefaction components of the accumulation curve and conversely a slightly higher γSR in 2010 than in 1998 (255 versus 181 species, respectively; Figure 4D). Finally, the accumulation curves of the 50 m deep stations were almost similar in 1998 and 2010 (γSR of 187 and 163 species, respectively;
ACCEPTED MANUSCRIPT
Figure 4. Sampled-based species accumulation curves (sensu Colwell et al., 2012) for each sampling depth and sampling years. Filled black circles correspond to reference samples (i.e., a pool of all samples collected at a given sampling depth during a given sampling year). The parts of the curves left to these points correspond to rarefaction curves, whereas the parts of the curves right to these points correspond to extrapolation curves. The asymptotes of the later are estimates of γSR (see text for details).
ACCEPTED MANUSCRIPT
3.4 Multivariate analyses: identification of community and community changes
The first axis of the PCA (Figure 5A) accounted for 18.9% of the total variance of benthic macrofauna composition. It mostly corresponded to a depth gradient with shallow stations on the left-hand side and deep stations on the right-hand side. The second axis explained 8.2% of the total variance of benthic macrofauna compositions. It was interpreted as a temporal axis separating the 2010 (upper part) from the 1998 (lower part) sampling years. Despite the relatively low amount of variance explained, these two axes efficiently display both spatial and temporal variation in benthic macrofauna composition. The fact that the projections of the same stations in 1998 and 2010 tended to be closer for deep than for shallow stations illustrate the significant space-time interaction (see item 3.7 Multivariate
analyses: Interaction between spatial and temporal effects, spatial modelling). The PCA plot
of species (Figure 5B) showed that Ditrupa arietina, Owenia fusiformis and Spisula
subtruncata were most associated with shallow stations, whereas conversely, Sternaspis scutata was the species most associated with deep stations. D. arietina, Turritella communis and Lumbrineris latreilli were most associated with the 1998 cruise, whereas Ampelisca sarsi, S. subtruncata and S. scutata were most associated with the 2010 cruise.
Figure 5. PCA di stance biplot based on the Hellinger transformed benthic macrofauna data matrix : (A) the projections of each combination of sampling stations and sampling ye ars di stribution of stations year-depth crosse d (grey lines for 1998 and black line s for 2010) and (B) major species of each group of station: Ampeli sca sarsi (Am sa), Ampeli sca diadema (Amdi), Ampharetidae (Amph), Aponuphi s
bilineata (Apbi ), Ditrupa arietina (Diar), Echinocardium mediterraneum (Ecme), Leptocheirus mariae
(Lema), Lumbrineris spp. (Lumb), Nephtys inci sa (Nein), Owenia fusi formi s (Owfu), Siphonoecetes
neapolitanus (Sine), Spi sula subtruncata (Spsu), Sternaspi s scutata (Stsc), Turritella communi s (Tuco)
ACCEPTED MANUSCRIPT
The results of K-means clustering are shown in Figure 6 for 3, 4 and 5 groups. With 3 groups, observations were rather clearly partitioned along a depth gradient, regardless of year, with deep (40-50 m) and shallow (10-20 m) stations clearly separated but both slightly overlapping with the cluster formed by intermediate (30 m deep) stations. With 4 groups, the shallow stations were further separated in 3 clusters related to sampling year, while other clusters remain unchanged. With 5 groups, the deeper stations also formed two distinct clusters related to sampling year, but the 30 m depth cluster remained unchanged. Here again, these results are compatible with the existence of a significant interaction of spatial and temporal effects on benthic macrofauna composition (see also above).
Figure 6. The benthic macrofauna grouping by the K-means in 3, 4 and 5 groups.
3.5 Changes in benthic macrofauna species composition
The indicator species best characterizing clusters corresponding to the 10 and 20 m deep stations (i.e., the Littoral Fine Sands community of Labrune et al., 2007a, 2008) were:
Nephtys hombergii, Euspira spp., Nephtys cirrosa, Eumida sanguinea and Timarete filigera
in 1998, versus Fustiaria rubescens, Callista chione, Lucinella divaricata, Thracia
phaseolina and Leucothoe pachycera in 2010 (Table 2). The most abundant species
ACCEPTED MANUSCRIPT
(16.4%), Spisula subtruncata (5.8%), Turritella communis (4.5%) and Tanaidacea (3.1%)
versus Galathowenia oculata (6.7%), S. subtruncata (5.5), Siphonoecetes neapolitanus
(5.1%), Tanaidacea (3.9%) and Dosinia lupinus (2.7%) in 2010 (Table 3).
In 1998, the indicators species best characterizing the cluster corresponding to the 30 m deep stations (i.e., the Littoral Sandy Mud community of Labrune et al., 2007a, 2008) were: Abra prismatica, Mysida, Prionospio cirrifera, Eteone foliosa and Pseudomystides
limbata versus Aspidosiphon muelleri, Aricidea spp., Syllis spp. Peresiella clymenoides and
Syllidae in 2010 (Table 2). The most abundant species associated with this community in 1998 were Ditrupa arietina (26.0%), Turritella communis (11.5%), Lumbrineris spp. (10.3%), Tanaidacea (6.1%) and Leptocheirus mariae (2.6%) versus Aspidosiphon muelleri (17.8%),
Lumbrineris spp. (7.4%), T. communis (5.3%), Nephtys kersivalensis (4.2%) and Galathowenia oculata (4.1%) in 2010 (Table 3).
TaTable 2. Indicator species of macrobenthic communities between 1998 and 2010. ***: p< 0.001, ** : p<0.01, *: p<0.05.
1998 2010
Littoral Fine Sands Statistic p-value Littoral Fine Sands Statistic p-value
Nephtys hombergii 0.946 0.005 ** Fustiaria rubescens 0.648 0.005 **
Euspira spp 0.688 0.005 ** Callista chione 0.646 0.005 **
Nephtys cirrosa 0.657 0.005 ** Lucinella divaricata 0.645 0.005 **
Eumida sanguinea 0.555 0.005 ** Thracia phaseolina 0.574 0.005 **
Timarete filigera 0.524 0.005 ** Leucothoe pachycera 0.405 0.015 *
Mendicula ferruginosa 0.516 0.005 ** Oxynoe olivacea 0.387 0.010 **
Autonoe angularis 0.463 0.005 ** Cylichna cylindracea 0.323 0.010 **
Mysta picta 0.447 0.005 ** Melinna cristata 0.316 0.035 *
Spio filicornis 0.445 0.005 **
Paradoneis fulgens 0.316 0.040 *
Littoral Sandy Mud Statistic p-value Littoral Sandy Mud Statistic p-value
Abra prismatica 0.549 0.005 ** Aspidosiphon muelleri 0.768 0.005 **
Mysida 0.504 0.005 ** Aricidea spp. 0.541 0.005 **
Prionospio cirrifera 0.493 0.005 ** Syllis spp. 0.530 0.005 **
Eteone foliosa 0.438 0.005 ** Peresiella clymenoides 0.410 0.005 **
Pseudomystides limbata 0.430 0.005 ** Syllidae 0.373 0.025 *
Medicorophium rotundirostre 0.399 0.01 ** Atylus vedlomensis 0.366 0.020 *
Anapagurus bicorniger 0.399 0.005 ** Cereus spp. 0.359 0.030 *
Urothoe elegans 0.387 0.015 * Spiophanes viriosus 0.349 0.005 **
Mediomastus spp. 0.374 0.020 * Aonides spp. 0.316 0.045 *
Ampelisca spinipes 0.347 0.040 * Nucula hanleyi 0.316 0.050 *
ACCEPTED MANUSCRIPT
Cossura spp. 0.293 0.045 *
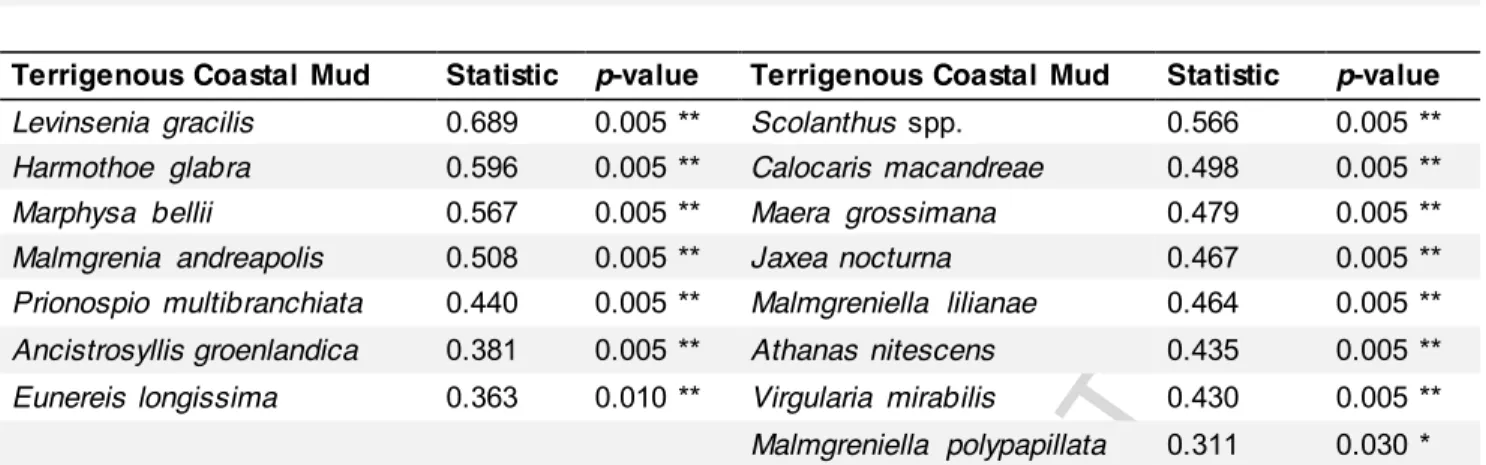
Terrigenous Coastal Mud Statistic p-value Terrigenous Coastal Mud Statistic p-value
Levinsenia gracilis 0.689 0.005 ** Scolanthus spp. 0.566 0.005 **
Harmothoe glabra 0.596 0.005 ** Calocaris macandreae 0.498 0.005 **
Marphysa bellii 0.567 0.005 ** Maera grossimana 0.479 0.005 **
Malmgrenia andreapolis 0.508 0.005 ** Jaxea nocturna 0.467 0.005 **
Prionospio multibranchiata 0.440 0.005 ** Malmgreniella lilianae 0.464 0.005 **
Ancistrosyllis groenlandica 0.381 0.005 ** Athanas nitescens 0.435 0.005 **
Eunereis longissima 0.363 0.010 ** Virgularia mirabilis 0.430 0.005 **
Malmgreniella polypapillata 0.311 0.030 *
In 1998, the indicator species best characterizing the cluster corresponding to the 40 and 50 m stations (i.e., the Terrigenous Coastal Mud community of Labrune et al., 2007a, 2008) were: Levinsenia gracilis, Harmothoe glabra, Marphysa belli, Malmgreniella
andreapolis and Prionospio multibranchiata versus Scolanthus spp., Calocaris macandreae, Maera grossimana, Jaxea nocturna and Malmgreniella lilianae in 2010 (Table
2). The most abundant species associated with this community in 1998 were Lumbrineris
spp. (14.8%), Sternaspis scutata (8.7%), Aspidosiphon muelleri (4.5%), Tanaidacea (4.3%) and Heteromastus filiformis (4.1%) versus Sternaspis scutata (21.1%), Leptocheirus mariae (11.7%), Ampelisca sarsi (7.9%), Ampharetidae (4.3%) and Tanaidacea (4.2%) in 2010 (Table 3).
Table 3. Relative abundances (%) of the five most abundant specie s for each macrobenthic community (most abundant species within each community are in bold) between 1998 and 2010. LFS : Littoral Fine Sands, LSM: Littoral Sandy Mud and TCM: Terri genous Coastal Mud.
1998 2010 Species LFS LSM TCM LFS LSM TCM Ampelisca sarsi 0.2 0.1 0.0 1.9 2.4 7.9 Ampharetidae 0.0 0.6 0.2 1.4 2.2 4.3 Aspidosiphon muelleri 0.1 0.9 4.5 2.4 17.8 1.5 Ditrupa arietina 32.5 26.0 1.5 2.2 3.1 0.0 Dosinia lupinus 0.1 0.3 0.0 2.7 0.6 0.0 Heteromastus filiformis 0.0 0.1 4.1 0.1 1.2 0.3 Leptocheirus mariae 0.0 2.6 1.7 0.1 0.6 11.7 Lumbrineris spp. 1.8 10.3 14.8 1.8 7.4 2.8 Galathowenia oculata 0.6 1.0 0.6 6.7 4.1 1.4 Nephtys k ersivalensis 0.0 0.0 1.1 2.6 4.2 0.3 Owenia fusiformis 16.4 0.1 0.0 1.9 1.0 0.0 Siphonoecetes neapolitanus 0.0 0.3 0.0 5.1 2.3 0.0 Spisula subtruncata 5.8 0.2 0.0 5.5 0.1 0.0 Sternaspis scutata 0.1 0.1 8.7 0.1 0.5 21.1
ACCEPTED MANUSCRIPT
Tanaidacea 3.1 6.1 4.3 3.9 3.7 4.2
Turritella communis 4.5 11.5 2.7 1.4 5.3 0.4
3.6 Ditrupa arietina case
The time series of average and maximal abundances of Ditrupa arietina and of the NAO and WeMO indices show close temporal pattern. (Figure 7). Three distinct time periods can be distinguished based on the 8-years moving average of the NAO index: (1) 1989-2000, which is characterized by positive values, (2) 2000-2010, which is characterized by values close to 0, and (3) 2010-2013, which is characterized by negative values. The first of these periods is also characterized by high (both average and maximal) abundances of D. arietina conversely to the two other ones. For the WeMO index, two distinct periods can be observed based in the annual values: (1) 1990-2002, which is characterized by positive values with high and heterogeneous values of abundance of D. arietina; and (2) 2003-2013, which is characterized by negative values presenting low and homogeneous values of abundance of this species. Values of average abundance were not correlated with climatic indices. However, maximal abundances were correlated with NAO 8-years average (r=0.64, p=0.005) and WeMO annual (r=0.48, p=0.049).
ACCEPTED MANUSCRIPT
Figure 7. Average (A) and maximal (B) abundances of Di trupa arietina observed between 1989 and 2012 along the Catalan French Coast in relation with changes in the yearly of the NAO (C) and WeMO (D) indices.
ACCEPTED MANUSCRIPT
3.7 Multivariate analyses: Interaction between spatial and temporal effects, spatial modelling
There was a significant interaction between spatial and temporal effects on benthic macrofauna composition (F=1.398, p=0.001). This interaction accounted for 20.3% of the total variance of overall (i.e., 1998 + 2010) benthic macrofauna composition.
Using (1) dbMEMs (together with a linear trend component), (2) AEM (Rhône River influence), and (3) environmental variables as sets of explanatory variables for each year separately, our models accounted for 44% (Adj-R2, F=2.780, p=0.005) and 42% (Adj-R2,
F=2.710, p=0.005) of the variance of benthic macrofauna composition in 1998 and 2010,
respectively (Figure 8). AEM explained 28 and 31% of variance in benthic macrofauna composition during 1998 and 2010, respectively, versus only 25 and 22% for dbMEMS. During both years, “pure” AEM and dbMEMs (i.e., not associated with environmental variables or linear trend) contributions accounted for 17% of the variance of benthic macrofauna composition. During both years, the joint effect of AEM and dbMEM was limited (3 and 4%) and the spatial linear trend was negligible (3%). Finally, while environmental variables accounted for 25 and 22 % of total variance in 1998 and 2010, respectively, their “pure” (i.e., non-spatial) contributions to the variance of benthic macrofauna composition remained negligible (3% during both sampling years).
Figure 8. Partitioning of the variances of 1998 and 2010 benthic macrofauna compositions between explanatory variables. AEM: Asymmetric Eigenvector Maps corre spondent to directional spatial proce ss coded in order to reflect the Rhône River NE to SW influence; dbMEM: di stance-ba sed Moran’s Eigenvector Maps corre spondent to non -directional spatial process; Trend: linear trend; and Environment corre sponding to a set of environmental variables (Median grain diameter, fines content (%<63 µm) and organic carbon (OC) concentration).
ACCEPTED MANUSCRIPT
4 Discussion
4.1 Changes in sediments characteristics
The spatial distribution patterns of the sediment characteristics assessed during the present study were similar to those observed in 1998 (Labrune et al., 2008). The classical decreasing inshore/offshore gradient in sediment granulometry (Durrieu de Madron et al., 2000; Grémare et al., 2002; Mutlu et al., 2010; Martins et al., 2012) and the corresponding opposite gradient in organic carbon concentrations (Durrieu de Madron et al., 2000; Tesi et al., 2007; Martins et al., 2012) was conserved as well as the negative correlation between these 2 variables (Martins et al., 2012). Despite, overall restricted changes in all 3 considered sediment characteristics, fines content at 40 and 50 m depth were significantly lower in 2010 than in 1998. Previous changes in sediment granulometry in the shallow areas of the Gulf of Lions have been attributed to changes in the frequency of strong resuspension events (Grémare et al., 1998a). Resuspension events associated with strong waves and currents can have a direct impact down to 30 m depth (Ferré et al., 2005) but extreme ones can affect sediments down to 60 m depth as observed along the Ebro shelf (Puig et al., 2001; Palanques et al., 2002. A higher frequency of strong resuspension events in 2010 than in 1998 is consistent with (1) the negative values of the NAO and WeMO indices (2) the negative 8-years moving average during this year. However, the hypothesis of a control of sediment granulometry through strong resuspension events (Grémare et al., 1998a) remains questionable, because it is not clear why such a mechanism would not have primarily resulted in changes of sediment granulometry of shallower stations.
Furthermore, a general trend of the trawler fleet and exploitation in the gulf was started in 1957 in Sète (France). It reveals an originally small fleet, doing bottom and pelagic trawling, and small-scale fishery that grew to 140 units in 1998 (UNEP-MAP-RAC/SPA, 2013). However, the number of French vessels of bottom and pelagic trawlers and dredges along all the French Mediterranean coast was 143 in 2002 and dropped to 97 in 2010 following the application of European management measures (Council Regulation, 2006; SIH, 2017). Since (1) stations located at 40 and 50 m are more likely to be trawled than shallower stations (minimal legal distance of 3 miles offshore), (2) fine content tends to decrease between 1998 and 2010 and (3) fishing effort decreases between 1998 and 2010,
ACCEPTED MANUSCRIPT
the changes in granulometry observed between 1998 and 2010 could also be attributed to the decrease of fishing activities. Although, managements measures have been done in order to reduce the trawling activities in the region, many traces of trawls have been observed through sediment profile images in almost 90% of stations located in 40 and 50 m depth (Romero-Ramirez, Personal Communication). Trawling is known to lead to resuspension of sediments which would lead to nutrient and organic release. However, the annual total erosion by trawl seems to be lower than the one attributed to natural meteorological events (Ferré et al., 2008; Dellapena et al., 2006). In the present study, there are no significant difference in sediment organic content between 1998 and 2010. One possibility, which should be further tested through long-term observations, is that the number and intensity of resuspension events in 1998 were already sufficient to clear shallowest sediments of their fines.
4.2 Conservation of the same benthic communities between 1998 and 2010
Based on the 1998 sampling, Labrune et al. (2007a, 2008) were able to homogenize the classification of Gulf of Lions macrobenthic communities, previously classified by Guille (1970) and Picard (1965): Littoral Fine Sands (LFS) community, Littoral Sandy Muds (LSM) community and Terrigenous Coastal Muds (TCM) community. Our results show those same 3 main communities present in 2010. Indeed, our 3 groups non-hierarchical clustering resulted in a strictly spatial grouping of stations with no temporal (i.e., between years) interference. Moreover, clustering in 4 and 5 groups showed that between-years changes were independently and differentially affecting these 3 communities (Figure 6). This suggests that between-years changes were largely and differentially superimposed on the structuration of benthic communities. Despite changes in their composition (see also 4.3
Temporal changes in benthic macrofauna composition between 1998 and 2010), the same
3 communities were thus clearly present in 1998 and 2010 and it is thus sound to describe changes in benthic macrofauna composition and infer possible causes independently for each community.
Based on the occurrence of two sub-clusters of stations associated with the NE and SW parts of the LSM community, Labrune et al. (2007a, 2008) first highlighted a possible large-scale influence of the Rhône River on benthic macrofauna composition. However,
ACCEPTED MANUSCRIPT
they did not statistically test this hypothesis and did not extend it, neither to LFS community nor to TCM community. During the present study, we used a model containing environmental variables together with both non-directional (i.e., dbMEMs) and directional (i.e., AEM, which were coded to reflect station proximity with the Rhône Rive r mouth at each depth) explanatory variables to account for changes in benthic macrofauna composition in 1998 and 2010, separately. In both cases, spatial effects were dominant, with AEM contributing more than dbMEMs, which supports the existence of a directional spatial effect, reflecting the distance to the Rhône River. It would now be interesting to further explore such an effect by: (1) repeating our statistical procedure using a more complex coding of spatial data (e.g., considering each community and no longer each depth for the basis of a rook coding), and (2) using the same statistical procedure independently on each community to assess possible different effects of the Rhône River.
4.3 Temporal changes in benthic macrofauna composition between 1998 and 2010
Using the same methods and tools to sample and analyse between 1998 and 2010, our results show a general trend of increasing α-, γ- and total diversity in the Gulf of Lions (Figure 3E, 4). Likewise, the study of Coll et al. (2010) highlighted that the diversity of invertebrates reported in the Mediterranean increased along the last decades, with 6338 species reported in 1992 (Fredj et al., 1992), 6575 species reported in 2000 (Bianchi and Morri, 2000), 7287 species in 2004 (Boudouresque, 2004) and 10901 species reported in 2009 (Coll et al., 2010). These authors attributed this increase to the recent efforts and improvement in analytical methods and instruments. Kröncke et al. (2011) compared North Sea macrobenthic communities between 1986 and 2000. They observed an increase in the abundance and diversity associated mostly to the sea surface temperature and primary production. Overall, they suggested these changes can be linked to the variability of North Sea hydro-climate influenced by the North Atlantic Oscillation. However, as observed in previous studies, the role of NAO on diversity remains imprecise with positive or negative responses being observed (Dippner et al., 2003; Beuchel et al., 2006; Rees et al., 2006; Kröncke et al., 2011; Birchenough et al., 2015).
ACCEPTED MANUSCRIPT
Interaction between spatial and temporal effects
Our results help to complement existing evidence of a significant interaction between spatial and temporal effects on benthic macrofauna composition. The non-hierarchical clustering with k=4 and k=5, showed that the between-years effect is stronger (i.e., at k=4) at 10 and 20 m deep stations (i.e., LFS community) and then at 40 and 50 m deep stations (i.e., TCM community). Results of the PCA further showed that the benthic macrofauna composition of the LSM community (i.e., 30 m deep stations) also changed between 1998 and 2010. The changes were not put in evidence using non-hierarchical clustering up to 5 and probably reflects the higher within-year heterogeneity in their macrofauna composition, which could be related with the Rhône River influence (shown earlier) as already noted by Labrune et al. (2007a, 2008) for the 1998 sampling year. Otherwise, our results suggest that LFS stations showed stronger changes in their macrofauna composition between 1998 and 2010 than TCM ones, which is consistent with those of Labrune et al. (2007b) who observed stronger temporal changes in the benthic macrofauna composition of sandy than of muddy communities between 1994 and 2003.
Shallow communities: Littoral Fine Sands (LFS) and Littoral Sandy Muds (LSM)
Based on: (1) long term comparisons (i.e., 1967/68, 1994 and 2003) of benthic macrofauna composition achieved at a limited number of stations in the Bay of Banyuls-sur-Mer (Grémare et al., 1998a; Labrune et al., 2007b), and (2) autoecologial studies carried out on the polychaete Ditrupa arietina (Medernach et al., 2000; Charles 2006), temporal changes in both LSF and LSM benthic macrofauna compositions are currently attributed to fluctuations in the frequency of storms in relation with the NAO (Labrune et al., 2007b) as already proposed in the North Sea (Kröncke et al., 1998, 2001; Tunberg and Nelson, 1998). The occurrence of important changes observed in macrofauna composition during the present study, could be caused by the sampling surveys were conducted over contrasted climatic events. For the NAO index, 1998 was the end of a positive period considering the 8-years moving average while 2010 was the beginning of a negative one. Whereas, for the WeMO index, 1998 was the beginning of a positive year and 2010 was among negative years.
ACCEPTED MANUSCRIPT
We further tested the hypothesis of a causal-effect relationship between the climatic conditions and the recruitment of Ditrupa arietina by using a meta-analysis combining several spatial surveys conducted over a long period of time, as achieved by Grémare et al. (1998b) who first established that temporal changes in benthic macrofauna in the Gulf of Lions were large-scale. This approach allowed the assessment of the relationship between changes in the NAO and WeMO indices and changes in the abundance of Ditrupa arietina. Our results are consistent with the ones of Charles (2006) who found a significant correlation (r=0.7, p=0.003) between recruitment intensity in April and NAO index of April between 1994 and 2003.
In the LFS community, we observed a significant decrease in αSR associated with a significant reduction of total abundance and an increase in evenness between 1998 and 2010, which were primarily attributable to the important reduction in the abundance and, consequently, in the dominance of D. arietina. Conversely, there were no significant changes in αSR, abundance and Pielou's evenness in the LSM community between 1998 and 2010. This resulted from the combined effect of the decrease of D. arietina and of the increase of Aspidosiphon muelleri. In 1998, A. muelleri was mostly present at 40 and 50 m depth (i.e., in the TCM community), whereas in 2010 it was mostly found at 30 m (i.e., in the LSM community). Ferrero-Vincente et al. (2013) observed that A. muelleri does not show any significant preference for muddy or sandy sediments and tends to be present in similar abundances in both environments. However, these authors also showed that individuals of
A. muelleri preferentially live in D. arietina tubes. The increase in the availability of these
tubes resulting from the decline of D. arietina within the LSM community in 2010 may thus account for the corresponding increase of A. muelleri. Moreover, changes in availability of empty shelter shells, together with competition with sipunculans, can also influence the distribution of Tanaidacea (Ferrero-Vicente et al., 2013). In this sense, the most important changes in benthic macrofauna composition that occurred within the LSM community can also be considered as related to those regarding the abundance of D. arietina.
Deep community: Terrigenous Coastal Muds (TCM)
All benthic macrofauna alpha diversity descriptors changed significantly between 1998 and 2010 with higher values of abundance and species richness, and lower values of
ACCEPTED MANUSCRIPT
Pielou's evenness in 2010. High abundances and low evenness in 2010 were associated with the increase of Sternaspis scutata, which is a typical species of the TCM community (Picard, 1965; Salen-Picard et al., 2003; Labrune et al., 2007b; Bonifácio et al., 2014).
Our results suggest that major storms, which occurred during the negative NAO year 2010, induced changes in sediment granulometry and macrofauna, as already proposed by Grémare et al. (1998a). Interestingly, and based on the sampling of the same stations as Grémare et al. (1998a), Labrune et al. (2007b) reported only minor changes in the benthic macrofauna composition of the TCM community between 1994 and 2003. Nevertheless, the analysis of the NAO time-series shows that this period was associated with either positive or close to 0 values of the 8-years moving average of the NAO index, which suggests that strong resuspension events may have then only seldom occurred.
Trawl fisheries effort in the Gulf of Lions clearly decreased during last decades (UNEP-MAP-RAC/SPA, 2013). This may have facilitated the reestablishment of the TCM community reflected by the increase in abundance and diversity between 1998 and 2010. This hypothesis could be tested further by studying a long-term time series of macrofauna composition in a fishery free zone.
Conclusion
Our data demonstrate that the 3 main benthic communities identified in 1998 were still present in 2010 although their composition significantly changed and the changes were not homogeneous over the study area. The communities are clearly spatially structured by abiotic factors such as depth, granulometry and by the Rhône River inputs. As suggested by Hewitt et al. (2009) in coastal communities, where environmental factors act in a small scale, the effect on regional scale by the climatic variation will be inconsistent between all communities/stations, being difficult to be evaluate. Temporal changes are mainly attributed to climatic changes, probably combined with the decrease of trawling effort in the Terrigenous Coastal Mud (TCM) community between 1998 and 2010. Further, this idea was suggested by Kröncke et al. (2011) to explain differences in macrofauna communities between 1986 and 2000 in North Sea. Indeed, the negative period of climatic indices in 2010 may be linked with more frequent easterly storms which would have reduce the
ACCEPTED MANUSCRIPT
success of recruitment of several species of macrofauna and then reduce (significantly or not) species richness and abundance in the shallow communities. However, the concurrent decrease of trawling activity would have counterbalanced this tendency in the TCM community and resulted in an increase in abundance and species richness. This last hypothesis is supported by the decrease in fine contents of the sediment of the TCM community.
In order to estimate the impact of trawling on the changes in macrofauna composition, “small scale” data of trawling effort in the Gulf of Lions should be correlated with macrofauna data. Furthermore, the interactions between climatic oscillations, storm frequency and intensity, and benthic macrofauna composition should now be better assessed based on long-term monitoring.
Acknowledgements
We thank the captains and crew members of N.O. Thetys and Nereis II for technical assistance during samplings. Many thanks to Javier Martin-Vide and Joan López-Bustins for kindly provide to us an updated WeMO index and the Banque Hydro for provide the Rhône River flow. Special thanks to Guy Bachelet, Nicolas Desroy, Paulo Santos, Jacques Grall, Rafael Sardá and the two anonymous referees for the revision of this paper.
Funding: This work is part of the PhD Thesis of P. Bonifácio who was funded by the "Agence de l'Eau Corse-Méditerranée" (convention n°2010 0871), the "Agence des Aires Marines Protégées" (Marché N° 2009-AAMP-16; Lot N°9; ASCONIT/GIS Posidonie), LECOB (UMR CNRS – UPMC) and EPOC (UMR CNRS – Université Bordeaux 1). Further discussions, some meetings were funded by the ANR-13-BSV7-0006 – BenthoVal.
ACCEPTED MANUSCRIPT
References
Aloisi, J.C., Auffret, G.A., Auffret, J.P., Barusseau, J.P., Hommeril, P., Larsonneur, C., Monaco, A., 1977. Essai de modélisation de la sédimentation actuelle sur les plateaux continentaux français. Bulletin de la Société Géologique Française 7, 182–195.
Akoumianaki, I., Nicolaidou, A., 2007. Spatial variability and dynamics of macrobenthos in a Mediterranean delta front area: the role of physical processes. Journal of Sea Research 57, 47–64.
Amouroux, J.M., Grémare, A., 1995. Etude d'impact de la construction d’une station d’épuration sur l’émissaire de Narbonne-Plage Gruissan. 9 pp.
Amouroux, J.M., Grémare, A., 2001a. Etude des populations benthiques présentes au large d'Argelès sur mer: choix du site pour une opération de clapage. Conseil Général des P.O. pour le port de Port-Vendres. 10 pp.
Amouroux, J.M., Grémare, A., 2001b. Etude de la macrofaune marine benthique de la baie de Paulilles avant la réalisation des travaux de réhabilitation du site post-industriel de Paulilles Rapport pour le Conservatoire du Littoral. 13 pp.
Amouroux, J.M., Grémare, A., 2003. Etude d’impact de l’émissaire de la station d’épuration de Banyuls sur mer. 5 pp.
Amouroux, J.M., Grémare, A., 2006. Etude d’impact de l’émissaire de la station d’épuration de Banyuls sur mer. 5 pp.
Anderson, M.J., 2001. A new method for non-parametric multivariate analysis of variance. Austral Ecology 26, 32–46.
Anderson, M.J., 2006. Distance-based tests for homogeneity of multivariate dispersions. Biometrics 62, 245–253.
Antonelli, C., Eyrolle, F., Rolland, B., Provansal, M., Sabatier, F., 2008. Suspended sediment and
137Cs fluxes during the exceptional December 2003 flood in the Rhone River, southeast
France. Geomorphology 95, 350–360.
Bernardino, A. F., Netto, S. A., Pagliosa, P. R., Barros, F., Christofoletti, R. A., Filho, J. S. R., Colling, A., Lana, P. C., 2015. Predicting ecological changes on benthic estuarine assemblages through decadal climate trends along Brazilian Marine Ecoregions, Estuarine, Coastal and Shelf Science 166, 74-82, http://dx.doi.org/10.1016/j.ecss.2015.05.021.
Beuchel, F., Gulliksen, B., Carroll, M. L., 2006. Long-term patterns of rocky bottom macrobenthic community structure in an Arctic fjord (Kongsfjorden, Svalbard) in relation to climate variability
(1980–2003), Journal of Marine Systems 63: 35-48
http://dx.doi.org/10.1016/j.jmarsys.2006.05.002.
Bianchi, C.N., Morri, C., 2000. Marine biodiversity of the Mediterranean Sea: Situation, problems and prospects for future research. Marine Pollution Bulletin 40: 367–376.
Birchenough, S. N. R., Degraer, S., Reiss, H., Borja, A., Braeckman, U., Craeymeersch, J., De Mesel, I., Kerckhof, F., Kröncke, I., Mieszkowska, N., Parra, S., Rabaut, M., Schröder, A., Van