polyethylene using molecular dynamics simulations
The MIT Faculty has made this article openly available. Please share
how this access benefits you. Your story matters.
Citation
Henry, Asegun et al. “1D-to-3D transition of phonon heat conduction
in polyethylene using molecular dynamics simulations.” Physical
Review B 82.14 (2010) : n. pag. © 2010 The American Physical
Society
As Published
http://dx.doi.org/10.1103/PhysRevB.82.144308
Publisher
American Physical Society
Version
Final published version
Citable link
http://hdl.handle.net/1721.1/63142
Terms of Use
Article is made available in accordance with the publisher's
policy and may be subject to US copyright law. Please refer to the
publisher's site for terms of use.
1D-to-3D transition of phonon heat conduction in polyethylene using molecular dynamics
simulations
Asegun Henry,1,2,
*
Gang Chen,1,†Steven J. Plimpton,3and Aidan Thompson31Department of Mechanical Engineering, Massachusetts Institute of Technology, 77 Massachusetts Avenue, Cambridge, Massachusetts
02139, USA
2Georgia Institute of Technology, George W. Woodruff School of Mechanical Engineering, 801 Ferst Drive, Atlanta, Georgia 30332, USA 3Sandia National Laboratories, Albuquerque, New Mexico 87185-1110, USA
共Received 2 August 2010; published 26 October 2010兲
The thermal conductivity of nanostructures generally decreases with decreasing size because of classical size effects. The axial thermal conductivity of polymer chain lattices, however, can exhibit the opposite trend, because of reduced chain-chain anharmonic scattering. This unique feature gives rise to an interesting one-dimensional-to-three-dimensional transition in phonon transport. We study this transition by calculating the thermal conductivity of polyethylene with molecular dynamics simulations. The results are important for designing inexpensive high thermal-conductivity polymers.
DOI:10.1103/PhysRevB.82.144308 PACS number共s兲: 65.40.⫺b, 66.10.cd, 66.30.hk, 63.20.⫺e
Classical size effects on the thermal conductivity of thin-films, nanowires, superlattices, and nanocomposites have re-ceived significant attention both theoretically and experimen-tally, with reasonable agreement.1–4 The basic picture depicted by this area of research is that shrinking the size of crystalline materials results in lower thermal conductivity be-cause of increased phonon scattering at boundaries. Although size reduction generally leads to lower thermal conductivity, some nanostructures such as carbon nanotubes5–7 and poly-mer chains8–11exhibit starkly contrasting behavior and have high thermal conductivity. Using molecular dynamics simu-lations, Moreland et al.12predicted that the thermal conduc-tivity of diamond nanowires is much smaller than that of carbon nanotubes of comparable diameter. This is because a nanotube is one-dimensional 共1D兲 in the sense that there is only one dimension of spatial periodicity in the atomic ar-rangement, which occurs along the tube axis. This reduction in dimensionality limits the number of phonon scattering events that can satisfy energy and momentum conservation, which subsequently leads to longer phonon mean free paths and higher thermal conductivity.
In fact, in the 1950s, Fermi, Pasta and Ulam13discovered that a 1D lattice chain can have divergent 共infinite兲 thermal conductivity when anharmonic interactions 共nonlinear forces兲 are included. Their pioneering work inspired exten-sive literature on anomalous heat conduction in 1D lattices.10,14–19 More recently, molecular dynamics simula-tions have shown that an individual polyethylene chain can also have divergent thermal conductivity.8,10Bulk polyethyl-ene, on the other hand, has a low thermal conductivity ⬃0.35 W/m K,9,20 because the chains are entangled and their orientations are highly disordered.
The transition from high thermal conductivity in a single polymer chain to low thermal conductivity in bulk polymers is quite interesting from both a fundamental and practical stand point. Experiments on mechanically stretched bulk polyethylene9,21 report thermal conductivities as high as ⬃42 W/m K 共comparable to that of steel兲 along the stretch-ing direction9 due to greater alignment of the constituent chains. Although we anticipate that the thermal contact
resis-tance between chains will play a crucial role, anharmonic interactions between chains can lead to increased phonon-phonon scattering, which can diminish the high/diverging thermal-conductivity of individual chains. From a practical stand point, it is important to understand this effect for the design and structural optimization of inexpensive high thermal-conductivity polymers.9,11From a fundamental per-spective, the strongly anisotropic bond chemistry 共i.e., stiff covalent bonding along the chain backbone versus weak van der Waals bonding in the lateral directions兲 gives rise to an interesting size effect on thermal conductivity. A similar ef-fect was reported by Berber, Kwon, and Tomanek5 who ob-served an order of magnitude decrease in thermal conductiv-ity when comparing a single 关two-dimensional 共2D兲兴 graphene sheet to关three-dimensional 共3D兲兴 graphite. Similar observations were also reported by Nika et al.22 More re-cently, this 2D-3D transition was observed experimentally by comparing the thermal conductivity of sheets of graphene with one to four layers.23,24 Here we provide a systematic investigation of this phenomenon in the context of a polymer chain lattice, by studying how the thermal conductivity changes as we gradually build a lattice from 1D as a single chain, to 2D as a single sheet, to 3D as a single crystal.
In polyethylene, the weakly attractive van der Waals forces between polymer chains give rise to a lattice structure in both 2D and 3D. This feature, allows for observation of both a 1D-to-2D and 2D-to-3D transition in phonon trans-port. Starting from a single polyethylene chain, which is ex-pected to have high thermal conductivity,8,10 we anticipate a transition to 2D behavior as more chains are added to form a single lattice plane 共1D-to-2D transition兲. The 2D lattice plane should then exhibit lower thermal conductivity, as a result of anharmonic scattering induced by neighboring chains. A second transition from 2D-to-3D is also expected as additional lattice planes are stacked, leading to even more interchain anharmonic scattering, which should lower the thermal conductivity even further.23The strongly anisotropic phonon transport in polymer chain lattices9 can therefore cause the axial thermal conductivity to increase with decreas-ing crystal size, which is the opposite trend observed in most nanostructures and bulk materials.
In this paper we use molecular dynamics simulations to predict the thermal conductivity of polyethylene at each stage of the anticipated 1D-to-3D transition. Here, we are principally interested in isolating the effects of anharmonic phonon-phonon scattering. We do not include other potential scattering mechanisms that can further reduce the thermal conductivity, such as defects and interface/boundary resis-tance between chain ends. To study this 1D-to-3D transition we employ the widely used Green-Kubo approach,25–27 which is based on linear response theory, where the axial thermal conductivity is given by
= V kBT2
冕
0⬁
具Qz共t兲Qz共t + t
⬘
兲典dt⬘
, 共1兲 where kB is Boltzmann’s constant, T is the system tempera-ture, V is the system volume and 具Qz共t兲Qz共t+t⬘
兲典 is the heat flux autocorrelation共HFAC兲 function. Hardy’s expression for the heat flux operator28 was used to determine the axial z component of the heat flux, Qz共t兲, which is directed along the polyethylene chain backbone. This equilibrium molecular dynamics approach has shown good agreement with experiments2,11,29–32 and is used here to examine how the axial thermal conductivity of each group of interacting poly-ethylene chains decreases as additional chains are added.In order to study the proposed 1D-to-3D transition, we require a model that can describe both intramolecular 共cova-lent兲 and intermolecular 共van der Waals兲 interactions. The most crucial aspect of atomistic simulation is having an ac-curate description of the interatomic forces. Although ab ini-tio methods are very accurate, their computaini-tional cost cur-rently renders them unfeasible for studying polyethylene at the length scales of interest. Empirical potentials, on the other hand, are much less expensive, but can suffer from inaccuracy. For hydrocarbon systems, such as polyethylene, the second generation Brenner potential33is the most widely used, and has shown good agreement with experiments on the thermal conductivity of diamond.29This highly success-ful potential, however, only describes covalent interactions
for atoms separated by less than 2 Å. Stuart et al.34built on Brenner’s pioneering work and alleviated this constraint by adding a Lennard-Jones term, which has a large cutoff, as well as a four-body potential for preferred dihedral angles in polymeric systems. The resulting adaptive intermolecular re-active empirical bond order potential34 共AIREBO兲 was cho-sen for the precho-sent investigation because it has a Lennard-Jones term that allows neighboring chain molecules to interact, leading to enhanced phonon-phonon scattering. The sixth power dependence of this van der Waals chain-chain interaction is well established.34The key point of this study was to examine the extent to which the weaker intermolecu-lar interactions could interfere with the much stronger in-tramolecular covalent forces, in order to induce phonon-phonon scattering and reduce thermal conductivity.
Parallel molecular dynamics simulations were used be-cause of the requisite nanometer length scales and nanosec-ond time scales. In this investigation, the AIREBO potential34was implemented in theLAMMPSparallel molecu-lar dynamics package developed at Sandia National Laboratories.35The simulations described in this report were run using Sandia’s high-performance computing facilities, with processor grids ranging from 2–30 processors. To inves-tigate the 1D-to-3D phonon transport transition, twelve dif-ferent systems of polyethylene chains were studied by vary-ing the usage of periodic boundary conditions, as listed in TableI. In all 12 cases each molecular chain consisted of 80 carbon atoms 共40 unit cells long兲.8,10 All simulations em-ployed periodic boundary conditions along the length of the chains in the z direction; the use of periodic boundaries in the other two directions is indicated in TableI. Periodic bound-ary conditions were used in the x direction to represent infi-nite sheets, and additionally in the y direction to represent bulk material. Figure 1 shows the equilibrium atomic posi-tions associated with a 1D single chain, 2D single sheet 共single lattice plane兲, and the 3D bulk single crystal while the arrows denote the x and y directions where the usage of periodic boundary conditions was varied.
As mentioned, the AIREBO potential34 allows for a user-specified cutoff in the Lennard-Jones term. In the present TABLE I. Simulation domain details.
Phonon transport Molecules stacked in x direction Periodic boundaries in x direction Layers stacked in y direction Periodic boundaries in y direction Number of molecules Number of atoms 1D 1 No 1 No 1 240 1D-2D 2 No 1 No 2 480 1D-2D 4 No 1 No 4 960 1D-2D 6 No 1 No 6 1440 1D-2D 12 No 1 No 12 2880 2D 12 Yes 1 No 12 2880 2D-3D 6 Yes 1 No 6 1440 2D-3D 6 Yes 2 No 12 2880 2D-3D 6 Yes 3 No 18 4320 2D-3D 6 Yes 4 No 24 5760 2D-3D 6 Yes 5 No 30 7200 3D 6 Yes 5 Yes 30 7200 144308-2
work, this cutoff was chosen as three times the minimum energy separationijfor the Lennard-Jones interaction of the associated atomic species, which corresponded to ⬃10 Å for carbon-carbon interactions and ⬃8 Å for hydrogen-hydrogen interactions. This allowed for chain-chain interac-tions between third and fourth nearest-neighboring chain molecules. The minimum-energy positions for each chain in the zigzag conformation and bulk orthombic crystalline structure36 were obtained by standard conjugate-gradient energy-minimization methods inLAMMPS. The resulting unit cell size was 共7.13 Å⫻5.01 Å⫻2.55 Å兲, which is within 4% of the values measured experimentally.37All simulations were run at constant energy, volume, and number of atoms. Preliminary testing indicated that a 0.25 fs time step was needed for good energy conservation ␦E/E0⬍.0001% over the course of several nanoseconds of simulation time.8,10 Other preliminary thermal-conductivity calculations indi-cated that 10 ns of simulation time were required for thermal conductivity convergence within ⬃30%.8,10 For each case listed in Table I, ten independent simulations were run. The simulations were started with all atoms at their equilibrium 共minimum energy兲 positions and random velocities corre-sponding to a quantum corrected temperature of 300 K.8,38 This choice of temperature definition corresponds to⬃85 K, if the more standard definition based on equipartition is used. It should be emphasized here that the primary objective of this study is to probe the qualitative trends associated with a 1D-to-3D transition in phonon transport. Therefore the actual thermal-conductivity values obtained herein are most mean-ingful with respect to each other, as opposed to taking pri-mary interest in comparing these results to experiments, which has already been pursued elsewhere.11
The HFAC in all simulations exhibited large oscillations around 56 THz, which are attributed to the carbon-carbon bending modes.8,10,39 Although these oscillations are large and remain correlated for a very long time, they do not con-tribute to the thermal transport because they are symmetric about zero. These optical mode vibrations essentially amount to a background overlay, as it is well known that optical modes make up a significant portion of the energy content but are insignificant heat carriers due to their low group velocities.2,8,39–41 Thus, in Fig. 2 we show the HFAC after these strong oscillations have been filtered out so that the
decaying features of the autocorrelations can be studied. For comparison, Fig.2共a兲shows how the HFAC function decays for a single chain and two chains. In a single chain, there are modes that carry heat and can remain correlated indefinitely, leading to divergence.8,10 When a second chain is added, however, there are two consequences. First, the van der Waals interaction perturbs the modes in each chain that have the potential to remain correlated, which is evidenced by the fact that the decay rate increases significantly in Fig.
2共a兲, and the thermal conductivity is convergent in all simu-lations of two chains. Second, there are additional low-frequency vibrations that occur between the two chains, which may explain why the HFAC is slightly higher at very short times, when the vibrations are still correlated. Nonethe-less, the comparison suggests that the transition from 1D-to-2D behavior is sharp and chain-chain phonon-phonon scattering is substantial when only two chains are present. Figure 2共b兲 shows how the decay of the HFAC function changes for the 1D chain, 2D sheet, and 3D bulk cases, shown in TableI. Here the 1D case has a long tail, which is associated with the divergence8,10while the 2D and 3D cases on the other hand do not exhibit this feature and decay more rapidly. This is consistent with purely diffusive behavior and can be seen by the similarity between the 2D and 3D behav-ior after 15 ps.
FIG. 1. 共Color online兲 Cross-sectional depiction of the 1D, 2D, and 3D chain lattice structures.
FIG. 2. 共Color online兲 Normalized HFAC functions. 共a兲 and 共b兲 show the average HFAC function for 10 independent simulations of the 1D, 2D, and 3D cases in TableI, as well as the second case with
two chains. 共b兲 shows the long time behavior of the HFAC
func-tions for the 1D, 2D, and 3D cases in TableI. In both共a兲 and 共b兲 the data has been smoothed over 1ps intervals to filter out high fre-quency oscillations for clearer representation of the decaying features.
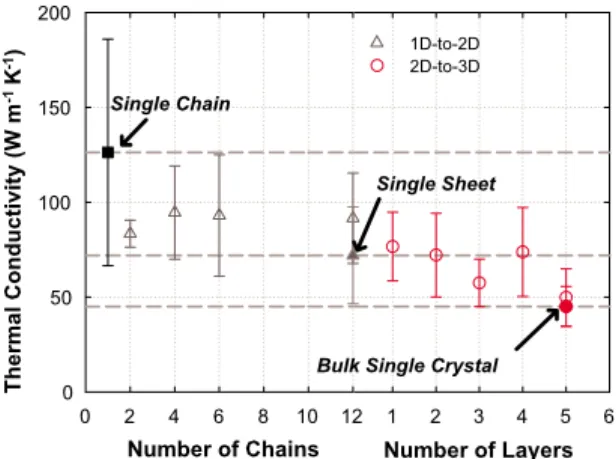
The results in Fig.3show the thermal conductivity values obtained for all 12 cases described in Table I. This figure shows the full 1D-2D and 2D-3D transitions with respect to the number of chains or layers in the corresponding dimen-sion. Numerical integration of the HFAC functions after sev-eral nanoseconds exhibited oscillations due to cumulative noise associated with the longitudinal acoustic phonons, which are the most dominant heat carriers.8,10As a result, the ⬁ integration limit in Eq. 共1兲, was truncated to 500 ps, which
sufficiently captures the autocorrelation decay for the 2D and 3D cases, as shown in Fig.2共b兲. For the 1D cases, this trun-cation captures the normal diffusive transport behavior ex-hibited in convergent simulations, and prevents the persistent HFAC functions that lead to divergent thermal conductivity from offsetting the results. Each point in Fig. 3 therefore represents the average thermal conductivity of all ten inde-pendent simulations while the error bars show the standard deviation. Despite the spread in the results, the 1D-to-3D transition and overall trend of decreasing thermal conductiv-ity with increasing size is nonetheless apparent. The results of Fig.3also show that the transition from 1D-2D is sharper than the transition from 2D-3D. The single chain thermal conductivity is large, as expected.8,10 However, when two chains are allowed to interact the thermal conductivity de-creases by⬃40%, which is also evident from Fig.2共a兲. As more chains are added to form a single layer of chains the thermal conductivity does not change as drastically. Once periodic boundary conditions are employed in 2D, the
tran-sition to 3D is less abrupt, and the thermal conductivity de-creases from the planar limit by another ⬃30%. Once five layers of chains have been stacked, Fig. 3 shows that the thermal conductivity is quite close to that of the bulk value predicted when periodic boundaries are employed in all three dimensions. This result is consistent with the findings re-ported by Ghosh et al., where it was observed that only four layers of graphene共2D兲 were required to approach the ther-mal conductivity of high-quality bulk graphite 共3D兲.23
Intuitively we know that whenever a new mode is intro-duced into a system, two competing effects are manifested. For one, an additional mode can contribute to the energy content of the material as measured in the specific heat and it can carry heat if the energy propagation velocity is signifi-cant, thus serving to increase the thermal conductivity. The secondary effect is that adding another mode to a system also opens up new routes for phonon-phonon scattering, which serve to decrease the thermal conductivity. The net effect of adding a mode to a system depends on the sum of these two effects and is evidenced by whether or not the thermal con-ductivity increases or decreases. In the case of polymer chain lattices, we know that when starting from a single chain, as more molecular chains are added to the simulation domain, new modes are added to the system and begin propagating in the perpendicular directions and at intermediate angles in between.42 These phonons contribute to the axial thermal conductivity by carrying heat, but can also detract from the high thermal conductivity of each individual chain, by scat-tering the most efficient heat carrying phonons, which propa-gate along each chain’s carbon backbone. The vital charac-teristic that allows for the 1D-to-3D transition shown in Fig.
3, is that these phonons detract from the axial heat conduc-tion more than they can contribute, thus reducing the net thermal conductivity. The fact that the thermal conductivity decreases as more modes are added 共1D-to-2D-to-3D兲, con-firms that the secondary effect of increased scattering is stronger than the primary effect of having additional heat carriers. Our results therefore show that the anharmonic scat-tering induced by weak van der Waals forces can cause sig-nificant attenuation of modes propagating along the stiff co-valently bonded polymer chain backbone 关Fig. 2共a兲兴. This provides important quantitative insight into heat conduction in polymer lattices, which will be necessary for designing and manufacturing low-cost high thermal-conductivity polymers.9,11
We acknowledge funding resources provided by the DOE to A. H., computing resources provided by Sandia National Laboratories, and NSF under Grant No. CBET-0755825. Our implementation of the AIREBO potential 共Ref. 34兲 is now
part of the open-source LAMMPS molecular dynamics pack-age, which is available for download from lammps.sandi-a.gov.
FIG. 3. 共Color online兲 Thermal conductivity results from the Green-Kubo analysis, showing the 1D-2D共left兲 and 2D-3D 共right兲 transitions. The left portion of the horizontal axis is given in num-ber of molecular chains for the 1D-2D transition while the right portion of the horizontal axis is given in terms of the number of 2D layers being stacked for the 2D-3D transition. Dashed lines indicate the values obtained for the 1D single chain limit, the 2D sheet limit, and the 3D bulk crystal limit, which show the increasing trend with decreased dimensionality.
1D. G. Cahill et al.,J. Appl. Phys. 93, 793共2003兲.
2A. Henry and G. Chen, J. Comput. Theor. Nanosci. 5, 141
共2008兲.
3K. E. Goodson and Y. S. Ju, Annu. Rev. Mater. Sci. 29, 261
共1999兲.
4D. Li et al.,Appl. Phys. Lett. 83, 2934共2003兲.
5S. Berber, Y.-K. Kwon, and D. Tomanek, Phys. Rev. Lett. 84, 4613共2000兲.
6P. Kim, L. Shi, A. Majumdar, and P. L. McEuen,Phys. Rev. Lett. 87, 215502共2001兲.
7C. Yu et al.,Nano Lett. 5, 1842共2005兲.
8A. Henry and G. Chen,Phys. Rev. Lett. 101, 235502共2008兲. 9C. L. Choy et al.,J. Polym. Sci., Part B: Polym. Phys. 37, 3359
共1999兲.
10A. Henry and G. Chen,Phys. Rev. B 79, 144305共2009兲. 11S. Shen et al.,Nat. Nanotechnol. 5, 251共2010兲.
12J. F. Moreland, J. B. Freund, and G. Chen,Nanoscale Microscale Thermophys. Eng. 8, 61共2004兲.
13E. Fermi, J. Pasta, and S. Ulam, Los Alamos Science Laboratory
Report No. LA1940, 1955共unpublished兲.
14T. Prosen and D. K. Campbella,Chaos 15, 015117共2005兲.
15D. K. Campbell, P. Rosenau, and G. M. Zaslavsky,Chaos 15,
015101共2005兲.
16B. Li and J. Wang,Phys. Rev. Lett. 91, 044301共2003兲. 17S. Lepri, R. Livi, and A. Politi,Phys. Rev. E 68, 067102共2003兲. 18R. Livi and S. Lepri,Nature共London兲 421, 327 共2003兲. 19S. Lepri, R. Livi, and A. Politi, Anomalous Transport:
Founda-tions and ApplicaFounda-tions共Wiley-VCH, Wein, 2008兲.
20E. Skow, Mechanical Engineering 共Massachusetts Institute of
Technology, Cambridge, 2007兲, p. 63.
21D. B. Mergenthaler et al.,Macromolecules 25, 3500共1992兲. 22D. L. Nika et al.,Appl. Phys. Lett. 94, 203103共2009兲. 23S. Ghosh et al.,Nature Mater. 9, 555共2010兲.
24A. A. Balandin et al.,Nano Lett. 8, 902共2008兲.
25J. Hansen and I. McDonald, Theory of Simple Liquids
共Aca-demic Press, London, 1986兲.
26G. P. Srivastava, Physics of Phonons共Adam Hilger, New York,
1990兲.
27G. Chen, Nanoscale Energy Transport and Conversion: A
Par-allel Treatment of Electrons, Molecules, Phonons, and Photons
共Oxford University Press, Oxford, 2005兲.
28R. Hardy,Phys. Rev. 132, 168共1963兲. 29J. Che et al.,J. Chem. Phys. 113, 6888共2000兲.
30A. J. H. McGaughey and M. Kaviany,Phys. Rev. B 69, 094303
共2004兲.
31L. Sun and J. Murthy,Appl. Phys. Lett. 89, 171919共2006兲. 32S. G. Volz,Phys. Rev. Lett. 87, 074301共2001兲.
33D. W. Brenner et al.,J. Phys.: Condens. Matter 14, 783共2002兲. 34S. Stuart, A. B. Tutein, and J. A. Harrison,J. Chem. Phys. 112,
6472共2000兲.
35S. Plimpton,J. Comput. Phys. 117, 1共1995兲.
36L. H. Sperling, Introduction to Physical Polymer Science共Wiley,
Bethelehem, Pennsylvania, 2006兲.
37L. Yin et al.,Polymer 44, 6489共2003兲.
38J. Lukes and H. Zhong,J. Heat Transfer 129, 705共2007兲. 39A. Henry and G. Chen,Nanoscale Microscale Thermophys. Eng.
13, 99共2009兲.
40G. P. Srivastava,J. Phys. Chem. Solids 41, 357共1980兲. 41D. A. Broido et al.,Appl. Phys. Lett. 91, 231922共2007兲. 42M. Dove, Introduction to Lattice Dynamics共Cambridge