HAL Id: hal-01981292
https://hal-enpc.archives-ouvertes.fr/hal-01981292v2
Submitted on 31 May 2021
HAL is a multi-disciplinary open access archive for the deposit and dissemination of sci-entific research documents, whether they are pub-lished or not. The documents may come from teaching and research institutions in France or abroad, or from public or private research centers.
L’archive ouverte pluridisciplinaire HAL, est destinée au dépôt et à la diffusion de documents scientifiques de niveau recherche, publiés ou non, émanant des établissements d’enseignement et de recherche français ou étrangers, des laboratoires publics ou privés.
To cite this version:
Nicolas Coulombel, Virginie Boutueil, Liu Liu, Vincent Viguie, Biao Yin. Substantial rebound effects in urban ridesharing: Simulating travel decisions in Paris, France. Transportation Research Part D: Transport and Environment, Elsevier, 2019, 71, pp. 110-126. �10.1016/j.trd.2018.12.006�. �hal-01981292v2�
HAL Id: hal-01981292
https://hal-enpc.archives-ouvertes.fr/hal-01981292
Submitted on 4 Dec 2019
HAL is a multi-disciplinary open access archive for the deposit and dissemination of sci-entific research documents, whether they are pub-lished or not. The documents may come from teaching and research institutions in France or abroad, or from public or private research centers.
L’archive ouverte pluridisciplinaire HAL, est destinée au dépôt et à la diffusion de documents scientifiques de niveau recherche, publiés ou non, émanant des établissements d’enseignement et de recherche français ou étrangers, des laboratoires publics ou privés.
To cite this version:
N. Coulombel, V. Boutueil, L. Liu, V. Viguié, B. Yin. Substantial rebound effects in urban rideshar-ing: Simulating travel decisions in Paris, France. Transportation Research Part D: Transport and Environment, Elsevier, 2019, 71, pp.110-126. �10.1016/j.trd.2018.12.006�. �hal-01981292�
1
Substantial rebound effects in urban ridesharing:
simulating travel decisions in Paris, France
Coulombel N.a,*, Boutueil V.a, Liu L.b, Viguié V.c, Yin B.d
aLaboratoire Ville Mobilité Transport, Ecole des Ponts ParisTech, Université Paris-Est, Champs-sur-Marne, France bSorbonne Universités, Université de Technologie de Compiègne, Labo Avenues EA 7284, Compiègne, France
cCentre International de Recherche sur l'Environnement et le Développement, Ecole des Ponts ParisTech, Nogent-sur-Marne, France dEngineering Division, New York University Abu Dhabi, Abu Dhabi, United Arab Emirates
Abstract
This paper investigates how and to what extent changes in user behavior may mitigate the environmental benefits of urban ridesharing, a phenomenon commonly referred to as “rebound effect”. Ridesharing reduces both the individual cost of car travel (through cost splitting) and road travel times (by decreasing congestion). This may trigger a number of behavioral changes among transportation users, including: making less detours to avoid congestion (route choice effect), switching from public transit and active modes to the car, as a ridesharer or as a solo-driver even (modal shift effect), travelling longer distances (distance effect), and relocating further from the urban center (relocation effect). Taking Paris region as a case study, this research applies an integrated transportation/land-use model to evaluate several ridesharing scenarios and quantify the four rebound effects. The overall rebound effect is found to be substantial, cancelling out from 68 to 77% of CO2 emission reductions
and from 52 to 73% of aggregated social benefits (including congestion, air quality…) expected from ridesharing. This is primarily the result of the modal shift effect, supplemented as ridesharing develops by the distance effect. Although the simplified representation of ridesharing in the baseline model calls for caution regarding these estimates, a sensitivity analysis corroborates the main findings and the prevalence of substantial rebound effects. The paper also investigates to what extent three complementary policies - improving public transit, reducing road capacity or increasing the cost of car travel – might limit the overall rebound effect and thereby maximize the benefits of urban ridesharing.
Keywords: ridesharing; users; rebound effect; climate change
1
1. Introduction
Reducing demand is generally a key concern in low-emission development strategies (Creutzig et al., 2016; Stern, Sovacool, and Dietz, 2016). This is especially true in the transportation sector, for which the Avoid-Shift-Improve framework is a well-established method to design sustainable mobility strategies (see e.g. Hidalgo and Huizenga, 2013; Nakamura and Hayashi, 2013). Yet, demand-oriented solutions are generally less studied and more poorly understood than technological or infrastructural solutions (Creutzig et al., 2018). Ridesharing (also known as carpooling and vanpooling) is the epitome of travel demand management measures (Chan and Shaheen, 2012; Furuhata et al., 2013). Its definition was recently standardized by SAE International as “the formal or informal sharing of rides between drivers and passengers with similar origin-destination pairings” (SAE International, 2018). Ridesharing may take various forms in practice, whether it is acquaintance-based (e.g., “fampools” between family members), organization-based, or yet casual (e.g., “slug lines”); whether it is planned or dynamic; and whether it is short-distance (local) or long-distance (Chan and Shaheen, 2012).
By raising vehicle occupancy, ridesharing is expected to reduce overall car use, and subsequently road congestion and pollutant emissions. As such, it is actively promoted by local and regional authorities in an increasing number of countries, including the U.S., Canada, Germany, France and China, using various tools such as the provision of carpool lanes, fuel tax reductions, or support for mobile technologies to make the matchmaking easier and faster (Caulfield, 2009; Wang et al., 2018; Yin et al., 2018). If ridesharing is a simple, fast, efficient, and relatively inexpensive way of reducing the environmental impact of road traffic on paper, in practice the extent of its decarbonation potential remains controversial (Litman, 2013; Shaheen et al., 2016).
Besides the questions of how to foster ridesharing adoption and what level can reasonably be achieved, a key issue is whether the development of ridesharing might trigger changes in user behavior that would cancel out all or part of the expected reduction in car use, and subsequently the associated environmental benefits. Changes in user behavior are especially likely to occur inasmuch as ridesharing tends to make car travel altogether more attractive, doubly so as it reduces both the individual cost of car travel and road congestion. Transportation users might leverage the improved conditions in car travel to switch mode for
2
the car (RIDES, 1999; Shaheen et al., 2016), to travel longer distances or even to relocate further from the city center (Salomon and Mokhtarian, 1997). The resulting “rebound effects” are similar to those commonly observed when improving energy efficiency to reduce energy consumption, where the initial gain is mitigated by the overconsumption reaction from users (Greening et al., 2000; Berkhout et al., 2000). Though discussed in the literature, the various rebound effects of ridesharing have seldom been examined together in a systematic manner, so that a fine knowledge of their extent – including how they interact with each other – and of possible measures to mitigate them, is still lacking.
This paper investigates how and to what extent user (and non-user) behavior may amplify or mitigate the expected benefits of ridesharing, focusing on the case of urban ridesharing.1
More specifically, it seeks to assess the magnitude of each elementary feedback effect in order to better understand the main drivers of the overall rebound effect. This is intended to help design complementary policies aiming to mitigate the rebound effect. Regarding the expected benefits of ridesharing, special emphasis is put on CO2 emissions considering the urgency of
limiting climate change (IPCC, 2013). The social cost of road traffic is also used to capture other benefits of urban ridesharing in terms of travel conditions (travel cost and travel time savings) and environmental impacts (e.g., local pollutants, noise).
The methodology relies on the use of an integrated transportation land-use model (ITLUM) to simulate ridesharing scenarios and quantitatively assess four elementary rebound effects associated with four user decisions: route choice, mode choice, destination choice, and location choice. The ITLUM is then used to test three alternative complementary policies - improving public transit, reducing road capacity, or increasing the cost of car travel - and to compare their respective merits as regards limiting the overall rebound effect and maximizing the benefits of urban ridesharing. The methodology is applied to the Paris region, one of the most heavily congested in Europe. The regional mobility authority currently puts great hope in urban ridesharing to reduce road congestion as well as to meet its CO2 abatement objectives
(Ile-de-France Mobilités, 2017).
1 This restricts the scope of ridesharing to such instances where drivers and passengers with similar
origin-destination pairings share rides within a metropolitan area. This encompasses the most usual forms of ridesharing, including “fampools”, coworker carpools, employer vanpools. Long-distance ridesharing is however beyond the scope of this paper, which focuses on daily mobility within a metropolitan area.
3
This paper extends the urban ridesharing literature along two main lines. It provides empirical evidence regarding the magnitude of each rebound effect, improving our understanding of the role of user behavior in amplifying or mitigating the expected benefits of low-carbon transportation innovations, here in the case of urban ridesharing. Incidentally, it develops a comprehensive framework to jointly assess demand-oriented solutions (ridesharing) and supply-oriented solutions (public transit network extensions, reductions in road capacity, road pricing), and discuss whether and how these two types of solutions interact, hence addressing the criticism of Litman (2013) that they are frequently studied separately.
2. Literature review
Ridesharing among family members and friends has a long history. In its more organized forms, ridesharing can be traced back to World War II and it later emerged as a regular, cost effective means of transportation for commuting in the 1970s, following the first oil crisis (Chan and Shaheen, 2012; Furuhata et al., 2013). More recently, the advent of mobile technologies has enabled dynamic ridesharing, leading to renewed interest in ridesharing from the academic community. Recent works cover a wide range of topics, including optimizing ride-matching (see the review by Agatz et al., 2012), analyzing supply and demand characteristics (Brownstone and Golob, 1992; Dong et al., 2018), and evaluating the effects on traffic conditions, travel behaviors, and the environment (Alexander and González, 2015; Caulfield, 2009; Cici et al., 2014; Santi et al., 2013).
Considering the scope of this paper, the review focuses on papers from the latter strand, which investigates the benefits of ridesharing (Table 1). Ridesharing is altogether considered a promising Travel Demand Management (TDM) tool (Litman, 2013) as it holds many promises as regards reducing the number of on-road vehicles (Cici et al., 2014), saving travel time and costs (Recker et al., 2001; Santi et al., 2013), and improving the environment by reducing fuel consumption and pollutant emissions (Caulfield, 2009). Moreover, ridesharing allows people to access locations that are poorly served by public transportation (Teubner and Flath, 2015). Recent works have corroborated the potentially significant benefits of ridesharing through several case studies (Caulfield, 2009; Cici et al., 2014; Wang et al., 2018; Yin et al., 2018).
4
However, concerns have risen regarding the potential rebound effects of shared mobility services – including ridesharing – which would partly, if not largely, offset their expected benefits (Font Vivanco et al., 2015; Schaller, 2017; Shaheen et al., 2016). Shared vehicles would for instance take up road space from private cars and parking space at transit stations (Bondorová and Archer, 2017). Similarly, ridesharing would shift demand across modes (Li et al., 2017; Xu et al., 2015). The studies of RIDES (1999) and Shaheen et al. (2016) show for instance that casual carpooling attracts riders from public transit. Xu et al. (2015) also indicate that when traffic congestion costs decrease thanks to ridesharing, more travelers become solo drivers while less people engage in ridesharing. More generally, several works document rebound effects in the context of transportation, and how these mitigate expected environmental benefits (Briceno et al., 2005; Font Vivanco et al., 2015; Rabbitt and Ghosh, 2013; Replogle, 1993b). Font Vivanco et al. (2015) suggest that innovations that reduce transportation costs potentially lead to greater changes in income and consequently to larger rebound effects, which are generally overlooked in Europe.
Table 1: Overview of the literature on the benefits and rebound effects of ridesharing
Benefits of ridesharing
Traffic congestion Meyer (1999); Fellows & Pitfield (2000) a; Minett & Pearce (2011);
Santi et al. (2013); Cici et al. (2014); Alexander & González (2015); Xu et al.(2015); Bahat & Bekhor (2016); Zhu et al. (2016); Li et al. (2017); Wang et al. (2018)
CO2 emissions Caulfield (2009); Firnkorn & Müller (2011); Ma & Wolfson (2013);
Rabbitt & Ghosh (2013)a; Ma et al. (2016); Laakso (2017); Li et al.
(2017);
Air quality Replogle (1993a, 1993b); Meyer (1999); Fellows & Pitfield (2000) Others (e.g.,
energy savings, accessibility…)
Recker et al. (2001); Jacobson & King (2009); Minett & Pearce (2011); Teubner & Flath (2015); Shaheen et al. (2016); Li et al. (2017)
Rebound effects
Route choice Fellows and Pitfield (2000);Alexander and González (2015); Cici et al. (2014); Xu et al. (2015a, 2015b); Li et al. (2016)
Mode choice Salomon & Mokhtarian (1997); Britton (1999) a; Briceno et al. (2005) a
Font Vivanco et al. (2015); Shaheen et al. (2016); Schaller (2017); Li et al. (2017)
Destination choice Morency (2007)
Relocation Salomon & Mokhtarian (1997); Britton (1999)
5
While numerous works investigate the environmental benefits of ridesharing, few take the reactions of users into account, most of which focus on the rebound effects associated with route choice and mode choice only. Yet, as urban ridesharing develops, the decrease in travel costs – both in time and money – might provide transportation users an incentive to travel longer distances or yet relocate to a more remote location within the metropolitan area. This paper seeks to fill this gap by considering four elementary rebound effects that could result from ridesharing, each associated with a specific user decision regarding route choice, mode choice, destination choice, or location choice.
3 Methodology
3.1 The integrated transportation-land use model
As discussed in the literature, transportation innovations - ridesharing included - may trigger an array of behavioral responses from users, such as changing route, changing mode, or relocating home (Salomon and Mokhtarian, 1997). By representing the main residential and travel decisions, integrated transportation-land use models (ITLUMs) allow capturing most of these effects. The ITLUM used in this paper couples an equilibrium land-use model, NEDUM, with a four-step transportation model called MODUS. As is standard for coupled ITLUMs (Chang, 2006), MODUS feeds NEDUM with travel costs (travel times and network distances between zones), whereas NEDUM provides jobs and population per traffic analysis zone to MODUS (Figure 1). Both models are calibrated for the Paris region; they have been validated using historical validation for NEDUM, and based on extensive real-case and prospective studies for MODUS. The coupled model is therefore expected to provide sound and reliable results.2
2 Several tests have been carried out to confirm the quality of the calibration of the coupled model, as well as to
6
Figure 1: Coupling of MODUS and NEDUM
The following paragraphs outline the key features of MODUS and NEDUM. A detailed presentation of each model, including references, is available as Online Annexes.
MODUS is a multimodal transportation model based on the standard four-step structure (Ortuzar and Willumsen, 2011). Travel demand is segmented according to six trip purposes (e.g., commuting, shopping, leisure) and two types of individuals (based on whether one has a private vehicle at his disposal or not). Three transportation modes are represented: cars (C), public transit (PT), and active modes (AM). The model specifications are relatively standard. The generation step is based on a linear regression model. In the gravity distribution model, the impedance variable used is the multimodal disutility of travel (computed as the opposite of the multimodal utility), which is derived from the mode choice multinomial logit model. Modal utilities include a time cost component and a monetary cost component, with parameters - e.g., Value of Travel Time Savings (VTTS) - that vary depending on the travel demand segment. Route choice is based on a standard multipath assignment procedure. MODUS was calibrated using the Paris region trip survey and road count data (DRIEA-IF, 2012). It is run using the TransCAD software.
NEDUM is designed to operationalize the monocentric model from urban economics and to extend it to a polycentric structure. It represents households’ location choices - and induced land prices and real estate development - by considering the trade-off between housing prices and commuting costs (in time and money). The spatial distribution of jobs is taken as an input, implying that NEDUM only simulates household location.
7
3.2 Representing urban ridesharing
Car trips are represented in MODUS through a single mode, which does not distinguish drivers from passengers. Urban ridesharing is thus not modelled explicitly as a distinct mode; rather, it is considered through average vehicle occupancy (AVO). In MODUS, AVO varies depending on the trip purpose and origin-destination (O-D) type. For instance, while the AVO in the Paris region is 1.28 for year 2010, this value falls to 1.06 when considering only commuting trips. Similarly, AVO typically decreases with trip distance for most purposes (DRIEA-IF, 2012).
Urban ridesharing scenarios are represented through increases in AVO, in consistency with the specification of MODUS. More specifically, a uniform increase (e.g., +10%) is applied, which is the same for all trip categories. Monetary costs of car trips are updated accordingly, assuming that travel costs are split evenly among ridesharers.
To illustrate, consider an urban ridesharing scenario that leads to an AVO increase of 25%. In the model, this initially decreases the volume of car trips by 20%,3 as fewer vehicles are
required to carry the same amount of people as before (Figure 2). Similarly, the individual (monetary) cost of car travel is reduced by 20%, the same overall costs being shared among a larger number of individuals. These however are only the initial effects. Lower traffic volumes mean less congestion, which is likely to result in more straightforward routes during road assignment - as less users make detours to avoid congestion - and subsequently to a reduction in trip distances (route choice effect). On the other hand, by reducing the individual monetary cost (through cost splitting) and the time cost (through reduced congestion) of car travel, ridesharing doubly reduces the generalized cost of car, making it more attractive relative to other modes. Therefore, it raises the utility of the car alternative during the mode choice step. This may cause part of the users of public transit and active modes to switch for the car, either as a ridesharer or even as a solo driver (modal shift effect). With the utility of car travel increasing across all O-Ds, the multimodal disutility mechanically decreases, hence increased trip distances during the distribution step as travelling becomes easier (distance effect). Finally, ridesharing is expected to result in urban sprawl in NEDUM as the decreases in the
8
monetary and time costs of car travel provide households a twofold incentive to relocate further from the city center (relocation effect). Unlike the route choice effect, all three other effects - modal shift effect, distance effect, relocation effect - are expected to increase car use. Trip induction is not considered in this study, however.4 As the ITLUM iterates until
convergence, the initial benefit of the 25% increase in AVO may be either mitigated or amplified depending on the relative magnitude of the two groups of effects (positive and negative) upon reaching the final equilibrium.
Figure 2: Model flowchart and integration of urban ridesharing
The simplified integration of ridesharing in the model involves two main assumptions. Indeed, urban ridesharing is not represented here explicitly, in contrast to other works which model it as a specific alternative (Bahat and Bekhor, 2016; Xu et al., 2015a, 2015b). This means,
4 Because the generation model only depends on socioeconomic variables, not on travel conditions (see Online
Annex A), ridesharing does not impact the overall mobility demand volume: no new trips are induced, i.e., the total number of trips (all modes included) remains constant whatever the AVO level. Rather, ridesharing leads to changes in the spatial structure of trips, in modal split (and thus in the volume of car trips), and in routes.
9
on the one hand, that the whole matching process, including pick-up(s) and drop-off(s), is assumed to be perfectly costless: engaging in ridesharing involves neither transaction costs, nor detours for drivers or for passengers. It also implies, on the other hand, that all car users – solo drivers, ridesharing drivers and passengers – are assumed to have the same behavior (being characterized by a same utility function). The significance of such assumptions is assessed further during the sensitivity analysis (subsection 5.2.2).
3.3 Key performance indicators
Several key performance indicators (KPI) are used to evaluate the ridesharing scenarios: vehicle-kilometers travelled (VKT) and vehicle-hours travelled (VHT);
CO2 emissions;
the social cost of road traffic.
The VKT and VHT are two standard road traffic indicators. The former measures the overall level of traffic and is closely related to pollutant emissions, whereas the latter captures congestion.5 Together, they afford a good overview of how ridesharing influences road traffic.
Both are standard outputs of road assignment procedures.
Considering the environmental focus of the paper, CO2 emissions represent the central KPI.
These are computed at the road link level using unit emission factors, estimated by Airparif (the regional air quality agency for Paris) for gasoline and diesel vehicles and for year 2012 based on the COPERT IV methodology applied to the Paris region vehicle fleet (Airparif, 2014). Considering a share of diesel vehicles in the regional fleet of 70% (Airparif, 2014), this study uses an average emission factor of 186 gCO2/km (0.7*182 + 0.3*195).
In addition to abating CO2 emissions, ridesharing is expected to yield a number of other
benefits, including reducing the cost of travel, curbing congestion, and improving air quality. The social cost of road traffic, defined here as the sum of private costs - including monetary costs and time-related costs - and external costs, allows one to capture these various effects (Parry and Small, 2009). External costs typically include the costs associated with CO2
emissions, local pollutants, and noise, to which this study adds the costs of other externalities
5 VHT is but a very basic indicator of congestion. Several more sophisticated indicators exist, such as the Excess
Delay or the Travel Time Index (Toledo, 2011). Still, VHT is used here for its simplicity, and because it is straightforwardly related to time costs within the social cost.
10
associated with road damages and lifecycle effects.6 To compute these, the outputs of the
road assignment model are crossed with spatialized socioeconomic data and cost parameters provided in the French guidelines for the economic evaluation of transportation projects (CGSP, 2013). The cost parameters are reported in Appendix, Table A.1.
3.4 Measuring the rebound effects
Consider an increase in AVO of x%. In the short run, the number of cars decreases by
x/(1+x)%. Accordingly, for KPIs related to road traffic (e.g., VKT, VHT, CO2 emissions), the initial
effect of ridesharing is defined as being –x/(1+x)%. This corresponds to the (virtual) immediate
effect where one considers only the change in the number of vehicles, assuming that all other things (distances travelled, travel times, modal shares…) remain unchanged. The actual effect taking into account the various changes in users’ decisions is then estimated by running the full ITLUM. The specification of the ITLUM used in this study allows capturing four effects: route choice, mode choice, destination choice, and location choice. For a given variable of interest (e.g., CO2 emissions), the rebound effect is finally defined as the relative gap between
the initial effect –x/(1+x)% and the actual effect computed by the ITLUM.
The weight of each of the four effects within the overall rebound effect is then estimated by running each submodel successively. For instance, to estimate the effect of route choice, the O-D matrices are kept constant - modulo the effect of the AVO increase on the car matrix - and only the assignment procedure is run (Figure 2). Next, by running both the mode choice and assignment submodels, the joint effect of mode choice and route choice is evaluated.7
The mode choice effect is deduced through subtraction; and so on for the destination and location choices.8
6 Lifecycle effects encompass a combination of externalities that are indirectly linked to road and car usage. This
includes externalities linked to the production and supply of energy, the lifecycle of vehicles (production, maintenance, disposal), and the lifecycle of infrastructures.
7 Starting from the mode choice model, “loops” (or iterations) must be performed in order to reach the
convergence of the 2-, 3- or 4-step transport model.
8 By doing so, a hierarchy is implicitly assumed in the sequence of user decisions, which is that users update their
choices in this order: 1) route, 2) mode, 3) destination, and last 4) location. This is consistent with the view that changes in the land-use/transport system occur within different time frames: changes in routes in the short run, modal shift in the medium run, changes in destination in the long run, and relocations in the very long run (Wegener, 1996).
11
4 Case study
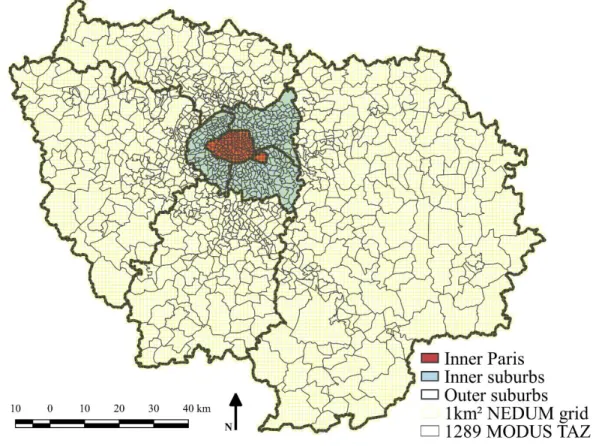
The Paris region – officially named Île-de-France – is a territory spanning over 12,000 km2.
With a population of 12 million inhabitants in 2015, it is the densest of the French regions with 1000 inh./km2 (Insee, 2017). Yet, it features important geographical disparities, the population
density in inner Paris being around 50 times greater than the density in the outer ring. Regarding mobility, Parisians spend on average 92 minutes each day in transportation (OMNIL, 2012), while suffering heavy congestion both on the road and in public transit (Hubert, 2009). The low vehicle occupancy (1.3 persons per vehicle on average) is often pointed out as a major cause of the heavy road congestion observed in the region, especially during rush hours. Indeed, 75% of all vehicles on the roads travel with only the driver on board, 19% with one passenger, and only 6% with two or more passengers besides the driver (OMNIL, 2017). Consequently, regional and local authorities have started to actively promote ridesharing, e.g., through the Sustainable Urban Mobility Plan for the Paris region and the Climate, Air quality and Energy Plan for the Greater Paris metropolitan area.
12
The Paris region is divided into 1289 traffic analysis zones (TAZ) in MODUS, and using a finer 1km² square grid in NEDUM (Figure 3). Socioeconomic input data required by NEDUM, such as population, household income, or employment, are collected from census and fiscal data, and correspond to year 2015. Transportation input data required by MODUS include the description of the road network (links, length, speed, capacity) and of the public transit system (transit lines, frequencies, fares…).9
5 Results
5.1 Effects of ridesharing scenarios
Ridesharing scenarios are represented by changes in average vehicle occupancy (AVO) ranging from 0 to +50%, with a +5% step. This corresponds to AVOs ranging from 1.3 to 2.0.10
The analysis focuses on the morning peak, as the period with the heaviest congestion level. Results for other times of day are discussed within the sensitivity analysis (subsection 5.2.1).
5.1.1 Road traffic
Developing urban ridesharing does decrease the overall traffic level, but significantly less so than one might have expected (Figure 4). Relatively to the initial effect that raising AVO by x% decreases VKT by x/(1+x)%, changes in route choice entail a small additional decrease in VKT: as traffic decreases, less drivers make detours to avoid congestion (route choice effect). On the other hand, the decrease in road congestion (and therefore travel times), together with the lower individual cost of ridesharing, make car travel more attractive. This encourages users to switch mode from public transit and active modes to private cars (modal shift effect), to travel longer distances (distance effect) and to relocate further from the urban center (relocation effect). The three effects altogether strongly mitigate the decrease in road traffic. Although the modal shift effect prevails at first, the distance effect becomes more significant as AVO increases. The relocation effect remains marginal.
9 See Online Annexes for more information regarding the input data.
10 Assuming that the ridesharing scenarios only decrease the share of solo trips, but do not alter the relative
shares of trips with 1 or 2 or more passengers, a +25% (resp. +50%) increase in AVO would imply that the share of solo trips decreased from 75% to 50% (resp. 25%).
13
Figure 4: Influence of ridesharing (as measured by AVO) on road traffic (VKT) and cumulative impacts of the different rebound effects
Regarding congestion, the actual decrease is coincidentally very close to the initial effect (Figure 5). As AVO increases, the lower road traffic leads to lower travel times (through the volume-delay functions), causing VHT to strongly decline if only considering route changes.11
Yet again, the modal shift and distance effects strongly mitigate the decrease in congestion, whereas the relocation effect remains negligible.
Figure 5: Influence of ridesharing (as measured by AVO) on road congestion (VHT) and cumulative impacts of the different rebound effects
11 The initial effect –x/(1+x)% only accounts for the decrease in the number of vehicles, not the lower travel times
14
5.1.2 CO2 emissions
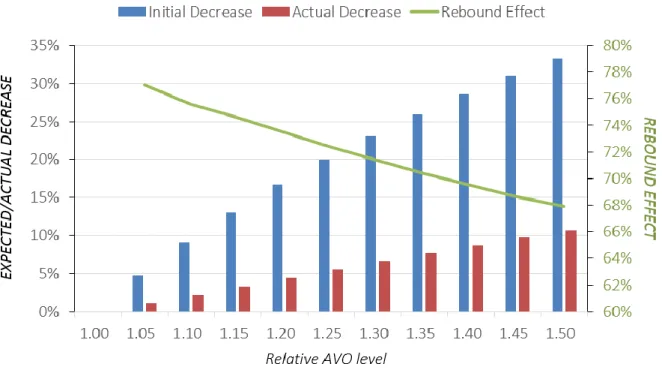
Altough raising AVO does abate CO2 emissions, the actual decrease is substantially more
limited than the initial one (Figure 6), in line with the previous results regarding road traffic. The rebound effect varies between 68% and 77% over the range considered. Such high values corroborate that one cannot neglect rebound effects in the case of urban ridesharing. Moreover, the rebound effect is found to decrease marginally as AVO increases. As previously discussed, the rebound effect stems from the combination of reduced monetary costs and lower travel times associated with car travel, which both make the car more attractive (they reduce the generalized cost of car travel) and consequently lead to an increase in car use (through modal shift). Given that the magnitude of both effects declines as AVO increases,12
so does the rebound effect. Complementary analyses show that the two effects – the effect on travel times (decongestion effect) and on travel costs (cost splitting) – have similar weights, each contributing to approximately half the overall rebound effect.
Figure 6 – Influence of ridesharing (as measured by AVO) on the decrease in CO2 emissions
12 Individual monetary costs become smaller and smaller as AVO increases, eventually converging toward 0.
15
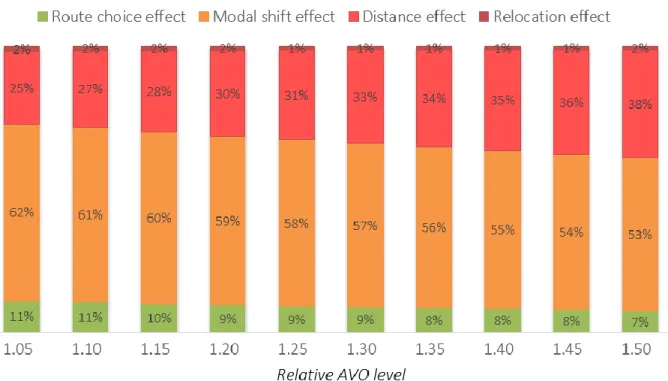
Next, the rebound effect is broken down according to the four main user decisions represented in our model: route choice, mode choice, destination choice, and location choice. For each level of AVO, the rebound effect is normalized to 100% and the relative weight of each decision is computed. Seeing that the route choice effect actually decreases CO2
emissions, weights are measured in absolute terms.
The modal shift effect largely prevails over the range of AVOs considered (Figure 7). Still, the breakdown of the rebound effect varies with the AVO level. As ridesharing develops, congestion decreases. With drivers traveling increasingly direct routes, there are lower CO2
gains to expect, hence the decrease in the route choice effect. Similarly, the modal shift effect declines for high AVO levels as the car is already very attractive. Conversely, the distance effect increasingly prevails as a result of the improvement in travel conditions (reduced travel times) combined with the decrease in the individual (monetary) cost of car travel. The relocation effect (i.e., urban sprawl) remains negligible compared to the other effects: users reinvest the travel time and travel cost savings resulting from ridesharing in accessing further destinations rather than choosing more remote residential locations.
16
5.1.3 Other effects
Besides reducing CO2 emissions, ridesharing generates additional benefits (Figure 8).
Consider a 25% increase in AVO. The ensuing 5% decrease in VKT causes user monetary costs and environmental external costs - air pollution, CO2, noise… - to decrease commensurately,
as all are strongly driven by traffic volumes. Unexpectedly, ridesharing has almost no effect on user time costs. Those are given by:
𝑇𝑜𝑡𝑎𝑙 𝑇𝑖𝑚𝑒 𝐶𝑜𝑠𝑡𝑠 = 𝑉𝐻𝑇 × 𝐴𝑉𝑂 × 𝑉𝑇𝑇𝑆. (1) Accordingly, as ridesharing develops, total time costs decrease less rapidly than VHT due to the increase in AVO.13 Here, the increase in AVO almost perfectly offsets the decrease in VHT
(Figure 8). The social cost of road traffic only decreases by 2.3% as a result, reflecting that time costs prevail over other private and external costs under the current economic evaluation guidelines in France.
Figure 8: Effects of ridesharing on the social cost and other key performance indicators, and cumulative impact of the rebound effects. Medium ridesharing scenario (+25% AVO)
13 Consider the case of two people with VTTS = 10$/h making a 1-hour car trip (with no congestion). If each of
them travels in their own car, the total time cost is 20$. If they rideshare, VHT are halved (from 2h to 1h), but the aggregate time cost remains the same (20$). Ridesharing only yields indirect benefits regarding time costs, i.e., those linked to reduced travel times (decongestion effect). The initial benefit of ridesharing regarding time costs is therefore set to 0 instead of –20% in Figure 8, hence an initial benefit of -6% regarding the social cost.
17
5.2 Sensitivity analysis
5.2.1 Influence of the time of day
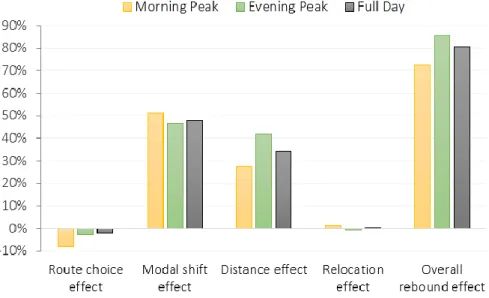
The effect of a 25% increase in AVO on CO2 emissions is compared for three times of day:
the morning peak hour (7a.m.-9a.m.), the evening peak hour (5p.m.-7p.m.), and the full day. The various rebound effects vary to a limited extent with respect to the time of day (Figure 9). Being directly related to congestion, the route choice effect is more limited for the evening peak hour and the full day, which feature lower congestion levels than the morning peak hour. Similarly, the modal shift effect is slightly weaker over the same periods. The gap is less important, however: unlike the route choice effect, the modal shift effect is also driven by the decrease in the cost of car travel, which is independent from the time of day. The distance effect is stronger for the evening peak hour. Unlike the morning peak hour, the evening peak hour includes a sizable share of non-commuting trips (e.g., for shopping, leisure purposes). Non-commuting trips being more sensitive to the generalized cost than commuting trips,14 the
decrease in the generalized cost resulting from ridesharing entails a greater increase in travelled distances during the evening peak than during the morning peak; the same applies for the full day. All in all, the overall rebound effect is slightly stronger for the evening peak hour and for the full day than for the morning peak hour.
Figure 9: Influence of the time of day on the various rebound effects, CO2 emissions
14 I.e. the generalized cost elasticity of trip distance is greater for non-commuting trips than for commuting trips
18
5.2.2 Sensitivity analysis
The representation of ridesharing adopted in this study (as an altered version of car travel rather than a self-standing mode) entails two major simplifying assumptions (see section 3.2): ridesharing involves no detour or transaction cost, and drivers and passengers have the same preferences (and therefore the same values of time). Yet, both assumptions are challenged by empirical findings. Delucchi (1998) finds that carpools increase average trip distance by 10% (due to pick-ups and drop-offs), while a study from the Victoria Transport Policy Institute (2018) shows that ridesharing increases travel times by 20%. The same study also finds the VTTS of ridesharing passengers to be around 30% lower than that of drivers.
Based on these findings, a sensitivity analysis investigates the effects on CO2 emissions of:
1) a 15% decrease in the average VTTS of car users,15 2) a 10% increase in trip distance, and 3)
a 20% increase in travel time.16 The three effects are tested first independently, then together.
The AVO variation is +25%.
A 15% decrease in VTTS only very slightly increases the overall rebound effect (Figure 10). As users place greater emphasis on monetary cost over time, public transit and active modes become more competitive relatively to ridesharing, leading to lower levels of modal shift. Limited modal shift implying less congestion, the better road conditions in the -15% VTTS scenario lead to a stronger distance effect, which balances the weaker modal shift effect.
By making car travel (relatively) less attractive, the 10% increase in trip distance and 20% increase in travel times both reduce the modal shift and distance effects to various extents. Whereas travel times do not affect emissions per se,17 trip distances directly influence CO
2
emissions, implying a strong, positive route choice effect in the +10% trip distance scenario. This leads to very contrasted results regarding the overall rebound effect: whereas the 20% increase in travel time strongly mitigates it, the 10% increase in trip distance alone leads to an overall rebound effect greater than 100% (implying ridesharing would actually raise CO2
emissions). When considering the two effects together, the overall rebound effect remains
15 Implying a 50/50 mix of drivers and passengers.
16 The increase in travel time and trip distance being limited to the private car mode.
17 Save for the relationship between speed and emission factors. Here mean emissions factors are used, so that
19
lower than in the baseline model, as the cost in time and distance (thus money) of pick-ups and drop-offs greatly limits the mode choice effect and the destination choice effect.
Last, when taking all effects into account, the various cons linked to ridesharing (+20% in travel time and +10% in trip distance), combined with the lower VTTS of ridesharers actually leads to a negative modal shift (i.e., to an increased use of public transit and active modes). The route choice effect and the distance effect remain substantial, leading to a rebound effect that is weaker than in the baseline model, but still significant.
Figure 10: Sensitivity analysis, CO2 emissions
Despite the strong simplifying assumptions in the baseline model, the results of this sensitivity analysis tend to corroborate that the main findings are robust and that ridesharing is characterized by strong rebound effects, as illustrated here in the case of the Paris region.
5.3 Complementary policies
Given the magnitude of the rebound effect, one could seek to limit it by combining ridesharing schemes with other transportation or land-use policies. Three alternatives are tested: improving public transit, reducing road capacity, and increasing the cost of car travel. Land-use policies are not considered, as the analysis has shown the overall rebound effect to be mostly driven by transportation-related effects.
20
5.3.1 Improving public transit
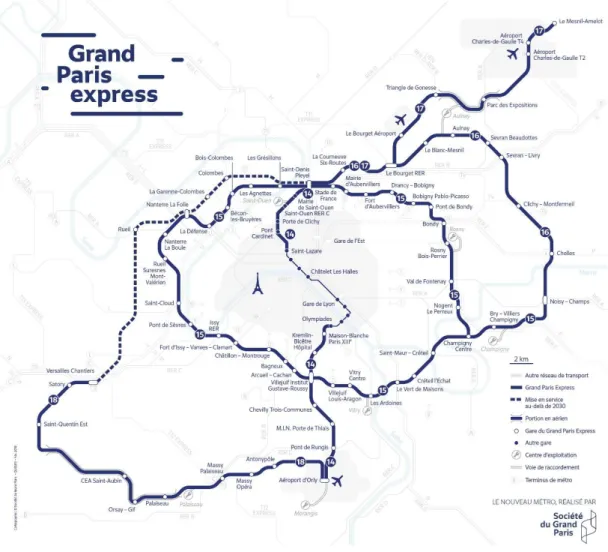
Seeing that the modal shift effect prevails within the rebound effect, simultaneously improving the public transit network might prevent users from switching modes from public transit to car travel. The Grand Paris Express mega-project is a prime example of such a policy, which lies at the core of the transportation strategy of the Paris region for the next decades. The project consists in the construction and the extension of several automatic subway lines, with an estimated cost of more than € 35 billion (Figure 11).
Figure 11: The Grand Paris Express network (source: Société du Grand Paris)
Unexpectedly, improving public transit has a limited impact on the overall rebound effect, as illustrated here in the case of a +25% increase in AVO (Figure 12). Combining the two policies significantly abates the modal shift effect, as intended. Yet, by reducing the generalized cost of travel, the Grand Paris Express spurs users to travel longer distances and to relocate to more remote locations within the Paris region, thereby amplifying both the distance and relocation effect.
21
Figure 12: Impact of improving public transit on the various rebound effects
Note: rebound effects above are measured relatively to the same reference, defined as the initial effect of a +25% increase in AVO in the 2015 baseline scenario.
To identify whether synergies (positive or negative) exist between the two policies, their effect on CO2 emissions and on the social cost is evaluated first independently, then together.
Combining the two policies leads to a smaller effect than the sum, especially for the social cost (Table 2). Both policies causing modal shift, but in opposite directions, each of them effectively reduces the efficiency of the other policy. Improving public transit would therefore prove a poor match to ridesharing schemes.
Table 2: Interactions between policies – Ridesharing and improved public transit
AVO +25% Grand Paris
Express Both Theoretical cumulative impact if no interaction b CO2 emissionsa -5,5% -4,1% -8,8% -9,4% Social costa -2,3% -10,3% -10,5% -12,3%
a Relative variation w.r.t. the baseline scenario
22
5.3.2 Reducing road capacity
As the rebound effect is strongly linked to the decongestion effect, another possibility is to simultaneously reduce road capacity so as to keep a constant level of service on the road. Considering that a 25% increase in AVO triggers an initial road traffic decrease of 20%, road capacity is assumed to be reduced by the same amount (-20%). This time, each rebound effect is mitigated (Figure 13). This includes the route choice effect: as the 20% decrease in road capacity exactly offsets the decongestion effect from the 25% AVO increase, travel times remain unchanged (and therefore, so do route choices), hence the null rebound effect.18 By
substantially limiting the gain in attractiveness that urban ridesharing provides to the car, decreasing road capacity reduces the overall rebound effect, here by one half.
Figure 13 – Impact of reducing road capacity on the various rebound effects
Note: rebound effects above are measured relatively to the same reference, defined as the initial effect of a +25% increase in AVO in the 2015 baseline scenario.
Whereas the effects of the two policies are almost additive regarding CO2 emissions, strong
synergies exist regarding the social cost. Reducing road capacity abates CO2 emissions by
making the car less attractive, yet it exacerbates congestion, thereby occasioning a heavy cost for users and subsequently for society as a whole (Table 3). Ridesharing schemes and decreases in road capacity act in perfect combination in this regard, as the decrease in road
23
capacity is an additional incentive for users to rideshare, ultimately entailing a -13% reduction in CO2 emissions for a limited 9% increase in social cost.
Table 3: Interactions between policies – Ridesharing and reduced road capacity
AVO +25% Road capacity
-20% Both Theoretical cumulative impact if no interaction b CO2 emissionsa -5,5% -7,4% -13,1% -12,5% Social costa -2,3% 16,0% 8,7% 13,4%
a Relative variation w.r.t. the baseline scenario
b Computed by multiplying (rather than adding) both effects
5.3.3 Increasing the cost of car travel
While the decrease in road capacity sought to address the time-related rebound effects, its money-related counterpart is to raise the cost of car travel by a dedicated tax (e.g., on fuel prices or on road use) in reaction to the lower cost of ridesharing. The cost of car travel is raised by 25% in the model. Considering the concomitant 25% increase in AVO, this leads to a constant kilometric cost compared to the baseline scenario. Increasing car travel cost strongly limits the modal shift effect and the distance effect, again halving the overall rebound effect (Figure 14).
Figure 14: Impact of increasing car travel cost on the various rebound effects
Note: rebound effects above are measured relatively to the same reference, defined as the initial effect of a +25% increase in AVO in the 2015 baseline scenario.
24
Table 4: Interactions between policies – Ridesharing and increased cost of car travel
AVO +25% Cost of car travel +25% Both
Theoretical cumulative impact if no interaction b CO2 emissionsa -5,5% -9,6% -13,1% -14,6% Social costa -2,3% -15,0% -13,9% -16,9%
a Relative variation w.r.t. the baseline scenario
b Computed by multiplying (rather than adding) both effects
Regarding interactions between the two policies, the effects of each policy are this time slightly sub-additive, meaning that one should not expect synergies (Table 4).
6 Discussion
6.1 Main findings
The development of urban ridesharing has two main implications for transportation users. As ridesharers split costs, it decreases the individual (monetary) cost of the car. By reducing the number of on-road vehicles, ridesharing also decreases congestion, causing road users to enjoy better travel conditions (i.e. lower travel times). Both mechanisms reduce the generalized cost of travel, thereby making the car more attractive relative to other modes. This increased attractiveness causes some users to change mode, while the general decrease in travel costs encourages users to travel longer distances or even relocate further from the city center, inducing urban sprawl. All three rebound effects - modal shift, distance, relocation - mitigate the initial benefits of ridesharing, be it in terms of road traffic or pollutant emissions. The lower congestion allowing drivers to take more direct routes (route choice effect), this generates a decrease in distances traveled that partly balances the previous rebound effects. In the Paris case study, the overall rebound effect is very substantial in all the ridesharing scenarios considered, offsetting more than two thirds of the initial reduction in CO2 emissions.
The modal shift effect is the most important, accounting for more than half of the overall rebound effect. Whereas the other effects are likely to occur in all cities, this significant modal shift effect is intrinsically specific to cities with a large public transit modal share like Paris.
25
Cities with a lower public transportation supply would logically present a much weaker modal shift effect, as there would be less potential “mode switchers” to start with. Conversely, the relocation effect remains marginal in all simulations, suggesting that more attention should be heeded to mobility rebound effects than to land-use rebound effects, at least in the case of the Paris region.
The findings are subject to several caveats. Urban ridesharing is not explicitly modelled, being instead represented as an increase in AVO. Indeed, the paper does not investigate how to achieve a certain level of ridesharing,19 but rather how users would react were this level to
be achieved. Although introducing ridesharing as a distinct mode would make the behavioral model more consistent, it would involve considerable technical challenges, recalibrating the whole model, while forfeiting all the advantages of using an already calibrated transportation model – MODUS – that has been validated through numerous real-case studies. Moreover, the basic mechanisms operating in this simplified model would still hold, so that doing so would change the results quantitatively yet (likely) not qualitatively.
The capacities and limitations of the model used in this study also imply that only a certain number of rebound effects are accounted for, excluding e.g. trip induction (subsection 3.2). Similarly, other effects such as changing departure time or reducing the frequency of telework due to the better travel conditions are not considered, nor possible effects on firm location. The latter point stems from the scope of NEDUM, which only models household location. Considering the focus of this paper, this should not be detrimental inasmuch as changes in travel conditions firstly impact households in the short run, then firms only in the longer run (Garcia-López et al., 2017).
Emissions and costs linked to public transit were not included in the computations. Regarding CO2 emissions, the issue is not trivial. Assuming a constant public transit supply,
there are no significant changes to expect save for the impact of occupancy on CO2 emissions,
which is likely to be of the second order. Adjusting the public transit supply consecutive to the decrease in users (as ridesharing leads to modal shift) could yield additional reductions in CO2
emissions. Yet, this would imply modelling how the public transportation authority adjusts
19 For instance by making the match-making process easier or subsidizing the use of the service (see e.g. Sassi
26
frequency to patronage, which would incidentally create an additional feedback in the transportation model as service frequency would become endogenous and depend on public transit demand.
Finally, only simple ridesharing scenarios were considered, with uniform increases in AVO. Considering the importance of the modal shift effect, targeting ridesharing policies at distant O-D pairs that would be poorly served by public transit could lead to a lower rebound effect. This will be the object of future works.
6.2 Policy recommendations
Given the importance of the rebound effect, a central question is which complementary measures transportation authorities can take in order to maximize benefits of ridesharing schemes, while accompanying users to avoid unintended reactions from their part.
Based on the capacities and limitations of our model, three main alternatives were tested: improving public transit, reducing road capacity, and increasing the cost of car. The findings strongly support either of the latter two options, which directly target the car mode in order to counterbalance the gain in attractiveness provided by ridesharing. Reducing road capacity seems the most promising on paper. It efficiently reduces the rebound effect, while involving strong synergies regarding the social cost, so that the two measures are truly complementary. To limit the unpopularity of capacity reductions, these could be achieved by converting road lanes into dedicated bus lanes, bike lanes, or even HOV lanes to provide an additional incentive to rideshare. Still, because the decongestion effect only arises after ridesharing has reached a certain level of development, the question is whether decreasing road capacity will actually encourage users to rideshare, or whether it will trigger other reactions, such as using public transportation, teleworking, or even quitting work were travel conditions to become excessively bad. Though not involving synergetic effects like for road capacity measures, increasing the cost of car travel (e.g. by road pricing) might be more promising in that regard. Unlike for time costs, a simple way to cope with increases in monetary costs is to engage in ridesharing. Road pricing could therefore be an efficient way to simultaneously encourage urban ridesharing while limiting the associated rebound effects. Conversely, public transit improvements seem less promising, as they do address the modal shift effect, yet amplify the other rebound effects (increased trip distance and urban sprawl). All in all, the findings
27
corroborate the idea that to achieve their low-carbon transitions, cities should not rely solely on one type of solution (technological, infrastructural, or behavioral), but rather on a combination of these.
Besides these “macro-solutions”, other “micro-measures” could help maximizing the benefits of ridesharing. Raising awareness about climate change, air pollution, and more generally about sustainable mobility might help users better realize that they are part of the solution, and to reflect more on their decisions (such as refraining from switching from active modes or public transit to the car were road travel conditions to improve). In a similar vein, ridesharing apps could advertise other alternatives to users such as cycling or public transit whenever those would offer a quality of service comparable to ridesharing.
To conclude, shared mobility holds many promises to meet the urgency of achieving low-carbon transitions to limit climate change. Yet, user behaviors must be carefully considered when designing such policies to limit unintended consequences. While modelling can help anticipating users’ reactions, large-scale experiments are also needed first to validate these models, and even more importantly to better associate users to the design of these solutions.
Acknowledgments
This research is supported by the DRAGON project (ORA-Chine) and by the VITE! project, both funded by the French National Research Agency (grant numbers: ANR-14-ORAR-0005 and ANR-14-CE22-0013), as well as by the “Chaire éco-conception des ensembles bâtis et des infrastructures” sponsored by Vinci. The authors especially acknowledge the Île-de-France Regional Department for Equipment and Planning (DRIEA IF) for providing data and technical support on the MODUS model, and Quentin Lepetit for his help in improving the coupling between MODUS and NEDUM.
28
Appendix A.
Table A.1 – Private and external cost parameters
Private cars
Monetary costs (€/km) 0.195
Including specific taxes (€/km) 0.049
Individuals’ value of time (€/h) 10.7
CO2 emissions (€/km) 0.005
Local pollutants (€/km) 0.048
Noise (€/km) 0.001
Road damages (€/km) 0.008
Life cycle effects (€/km) 0.009
Total of pure externalities (€/km) 0.071
29
References
A. Greening, Lorna, David L. Greene, et Carmen Difiglio. 2000. « Energy efficiency and consumption — the rebound effect — a survey ».
Energy Policy 28 (6): 389‑401. https://doi.org/10.1016/S0301-4215(00)00021-5.
Agatz, Niels, Alan Erera, Martin Savelsbergh, et Xing Wang. 2012. « Optimization for dynamic ride-sharing: A review ». European Journal of
Operational Research 223 (2): 295‑303. https://doi.org/10.1016/j.ejor.2012.05.028.
Airparif, 2014. Etat de l'air - Émissions : air et climat - Les émissions en quelques chiffres.
Alexander, Lauren P., et Marta C. González. 2015. « Assessing the impact of real-time ridesharing on urban traffic using mobile phone data ».
Proc. UrbComp, 1–9.
Avner, Paolo, Vincent Viguié, et Stéphane Hallegatte. 2013. « Modélisation de l’effet d’une taxe sur la construction ». Revue de l’OFCE, no 128(juin): 341‑64. https://doi.org/10.3917/reof.128.0341.
Bahat, Oren, et Shlomo Bekhor. 2016. « Incorporating ridesharing in the static traffic assignment model ». Networks and Spatial Economics 16 (4): 1125‑49. https://doi.org/10.1007/s11067-015-9313-7.
Ben-Akiva, Moshe E., et Steven R. Lerman. 1985. Discrete Choice Analysis: Theory and Application to Travel Demand. MIT Press.
Berkhout, Peter H. G., Jos C. Muskens, et Jan W. Velthuijsen. 2000. « Defining the rebound effect ». Energy Policy 28 (6): 425‑32. https://doi.org/10.1016/S0301-4215(00)00022-7.
Bondorová, B, et G Archer. 2017. « Does sharing cars really reduce car use? » Transport & Environment. https://www.transportenvironment.org/sites/te/files/publications/Does-sharing-cars-really-reduce-car-use-June%202017.pdf.
Briceno, Tania, Glen Peters, Christian Solli, et Edgar Hertwich. 2005. « Using Life Cycle Approaches To Evaluate Sustainable Consumption Programs: Car-Sharing ». https://brage.bibsys.no/xmlui/handle/11250/242569.
Britton, Eric. 1999. « Car Sharing 2000 - a hammer for sustainable transport ». Journal of World Transport Policy and Practice 5 (3): 351. Brownstone, David, et Thomas F. Golob. 1992. « The effectiveness of ridesharing incentives: Discrete-choice models of commuting in Southern California ». Regional Science and Urban Economics 22 (1): 5‑24. https://doi.org/10.1016/0166-0462(92)90023-T.
Caulfield, Brian. 2009. « Estimating the environmental benefits of ride-sharing: A case study of Dublin ». Transportation Research Part D:
Transport and Environment 14 (7): 527‑31. https://doi.org/10.1016/j.trd.2009.07.008.
CGSP. 2013. « L’évaluation socio-économique des investissements publics, rapport du Commissariat Général à la Stratégie et à la Prospective ». Commissariat Général à la Stratégie et à la Prospective, Chaired by Quinet, E. Tome 1 – rapport final: 354.
Chan, Nelson D., et Susan A. Shaheen. 2012. « Ridesharing in north america: Past, present, and future ». Transport Reviews 32 (1): 93–112. Chang, J. S. 2006. Models of the relationship between transport and land‐use: A review. Transport Reviews, 26(3), 325-350.
Cici, Blerim, Athina Markopoulou, Enrique Frias-Martinez, et Nikolaos Laoutaris. 2014. « Assessing the potential of ride-sharing using mobile and social data: a tale of four cities ». In Proceedings of the 2014 ACM International Joint Conference on Pervasive and Ubiquitous Computing, 201–211. ACM.
Courel, J. 2008. « 170 millions de kilomètres par jour ». Les distances parcourues par les Franciliens quotidiennement. IAU-IdF, Paris. Creutzig, Felix, Blanca Fernandez, Helmut Haberl, Radhika Khosla, Yacob Mulugetta, et Karen C. Seto. 2016. « Beyond Technology: Demand-Side Solutions for Climate Change Mitigation ». Annual Review of Environment and Resources 41 (1): 173‑98. https://doi.org/10.1146/annurev-environ-110615-085428.
Creutzig, Felix, Joyashree Roy, William F. Lamb, Inês M. L. Azevedo, Wändi Bruine de Bruin, Holger Dalkmann, Oreane Y. Edelenbosch, et al. 2018. « Towards Demand-Side Solutions for Mitigating Climate Change ». Nature Climate Change 8 (4): 260‑63. https://doi.org/10.1038/s41558-018-0121-1.
Delucchi, Mark. 1998, Emissions of Criteria Pollutants, Toxic Air Pollutants, and Greenhouse Gases, from the Use of Alternative Transportation
Modes and Fuels: 344, UC Transport. Center (Berkeley).
Dong, Yongqi, Shuofeng Wang, Li Li, et Zuo Zhang. 2018. « An empirical study on travel patterns of internet based ride-sharing ».
Transportation Research Part C: Emerging Technologies 86 (janvier): 1‑22. https://doi.org/10.1016/j.trc.2017.10.022.
Fellows, N. T., et D. E. Pitfield. 2000. « An economic and operational evaluation of urban car-sharing ». Transportation Research Part D:
Transport and Environment 5 (1): 1‑10. https://doi.org/10.1016/S1361-9209(99)00016-4.
Firnkorn, Jörg, et Martin Müller. 2011. « What will be the environmental effects of new free-floating car-sharing systems? The case of car2go in Ulm ». Ecological Economics 70 (8): 1519‑28. https://doi.org/10.1016/j.ecolecon.2011.03.014.
Font Vivanco, David, René Kemp, et Ester van der Voet. 2015. « The relativity of eco-innovation: environmental rebound effects from past transport innovations in Europe ». Journal of Cleaner Production 101 (août): 71‑85. https://doi.org/10.1016/j.jclepro.2015.04.019. Furuhata, Masabumi, Maged Dessouky, Fernando Ordóñez, Marc-Etienne Brunet, Xiaoqing Wang, et Sven Koenig. 2013. « Ridesharing: The state-of-the-art and future directions ». Transportation Research Part B: Methodological 57 (novembre): 28‑46. https://doi.org/10.1016/j.trb.2013.08.012.
30
Hidalgo, Dario, Germán Lleras, et Enrique Hernández. 2013. « Methodology for calculating passenger capacity in bus rapid transit systems: Application to the TransMilenio system in Bogotá, Colombia ». Research in Transportation Economics, THREDBO 12: Recent developments in the reform of land passenger transport, 39 (1): 139‑42. https://doi.org/10.1016/j.retrec.2012.06.006.
Hubert, J.-P. 2009. « Dans les grandes agglomérations, la mobilité quotidienne des habitants diminue, et elle augmente ailleurs ». Insee
première 1252: 1–4.
IAU-IF. 2010. « La circulation routière en Île-de-France en 2010 ». https://www.iau-idf.fr/savoir-faire/nos-travaux/edition/la-circulation-routiere-en-ile-de-france-en-2010.html.
Ile-de-France Mobilités, 2017. “Avec le covoiturage, Ile-de-France Mobilités veut faire de la voiture un mode de transport en commun complémentaire”, communiqué de presse, https://www.iledefrance-mobilites.fr/wp-content/uploads/2017/05/Communique-Avec-le-covoiturage-Ile-de-France-Mobilités-veut-faire-de-la-voiture-un-mode-de-transport-en-commun-complémentaire-180917.pdf (Accessed 02.10.17)
INSEE. 2017. « Démographie de l’Île-de-France en 2015 - Insee Flash Ile-de-France - 17 ». https://www.insee.fr/fr/statistiques/2555753. IPCC. 2013. Climate Change 2013: The Physical Science Basis. Contribution of Working Group I to the Fifth Assessment Report of the Intergovernmental Panel on Climate Change. Cambridge, United Kingdom and New York, NY, USA: Cambridge University Press. www.climatechange2013.org.
Jacobson, Sheldon H., et Douglas M. King. 2009. « Fuel saving and ridesharing in the US: Motivations, limitations, and opportunities ».
Transportation Research Part D: Transport and Environment 14 (1): 14‑21. https://doi.org/10.1016/j.trd.2008.10.001.
Laakso, Senja. 2017. « Giving up cars – The impact of a mobility experiment on carbon emissions and everyday routines ». Journal of Cleaner
Production 169: 135‑42. https://doi.org/10.1016/j.jclepro.2017.03.035.
Lemonsu, A., V. Viguié, M. Daniel, et V. Masson. 2015. « Vulnerability to heat waves: Impact of urban expansion scenarios on urban heat island and heat stress in Paris (France) ». Urban Climate 14 (décembre): 586‑605. https://doi.org/10.1016/j.uclim.2015.10.007.
Li, Ziru, Yili Hong, et Zhongju Zhang. 2016. « An Empirical Analysis of On-Demand Ride Sharing and Traffic Congestion ». SSRN Scholarly Paper ID 2843301. Rochester, NY: Social Science Research Network. https://papers.ssrn.com/abstract=2843301.
Litman, Todd. 2013. « Comprehensive evaluation of energy conservation and emission reduction policies ». Transportation Research Part A:
Policy and Practice 47 (janvier): 153‑66. https://doi.org/10.1016/j.tra.2012.10.022.
Ma, Ruimin, Maozhu Jin, et Peiyu Ren. 2016. « Greenhouse Gas Emission Savings with Dynamic Ride-Sharing ». Revista de La Facultad de
Ingeniería 31 (5): 152‑162.
Ma, Shuo, et Ouri Wolfson. 2013. « Analysis and evaluation of the slugging form of ridesharing ». Proceedings of the 21st ACM SIGSPATIAL
International Conference on Advances in Geographic Information Systems - SIGSPATIAL’13, no March 2016: 64‑73. https://doi.org/10.1145/2525314.2525365.
Masson, V., C. Marchadier, L. Adolphe, R. Aguejdad, P. Avner, M. Bonhomme, G. Bretagne, et al. 2014. « Adapting cities to climate change: A systemic modelling approach ». Urban Climate, ICUC8: The 8th International Conference on Urban Climate and the 10th Symposium on the Urban Environment, 10 (décembre): 407‑29. https://doi.org/10.1016/j.uclim.2014.03.004.
Meyer, Michael D. 1999. « Demand management as an element of transportation policy : using carrots and sticks to influence travel behavior ». Transportation Research Part A: Policy and Practice 33: 575‑99.
Minett, Paul, et John Pearce. 2011. « Estimating the energy consumption impact of casual carpooling ». Energies 4 (12): 126‑39. https://doi.org/10.3390/en4010126.
Morency, Catherine. 2007. « The Ambivalence of Ridesharing ». Transportation 34 (2): 239‑53. https://doi.org/10.1007/s11116-006-9101-9. Nakamura, Kazuki, et Yoshitsugu Hayashi. 2013. « Strategies and instruments for low-carbon urban transport: An international review on trends and effects ». Transport Policy 29 (septembre): 264‑74. https://doi.org/10.1016/j.tranpol.2012.07.003.
OMNIL. 2012. EGT 2010 – Résultats détaillés. http://www.omnil.fr/IMG/pdf/-4.pdf
OMNIL. 2017. Le covoiturage en Ile-de-France : une pratique déjà courante, un potentiel de développement soumis aux contraintes d’organisation, Repères , 7. http://www.omnil.fr/IMG/pdf/-83.pdf.
Ortúzar, Juan de Dios, et Luis G Willumsen. 2011. Modelling Transport. Oxford: Wiley-Blackwell. http://public.eblib.com/choice/publicfullrecord.aspx?p=699410.
Parry, Ian W. H., et Kenneth A. Small. 2009. « Should Urban Transit Subsidies Be Reduced? » American Economic Review 99 (3): 700‑724. https://doi.org/10.1257/aer.99.3.700.
Rabbitt, Niamh, et Bidisha Ghosh. 2013. « A study of feasibility and potential benefits of organised car sharing in Ireland ». Transportation
Research Part D: Transport and Environment 25 (décembre): 49‑58. https://doi.org/10.1016/j.trd.2013.07.004.
Recker, W. W., C. Chen, et M. G. McNally. 2001. « Measuring the impact of efficient household travel decisions on potential travel time savings and accessibility gains ». Transportation Research Part A: Policy and Practice 35 (4): 339‑69. https://doi.org/10.1016/S0965-8564(99)00062-2.
Replogle, Michael. 1993a. « Motor Vehicle Use and the Clean Air Act: Boosting Efficiency by Reducing Travel ». Environmental Defense Fund,