Publisher’s version / Version de l'éditeur:
Vous avez des questions? Nous pouvons vous aider. Pour communiquer directement avec un auteur, consultez la
première page de la revue dans laquelle son article a été publié afin de trouver ses coordonnées. Si vous n’arrivez pas à les repérer, communiquez avec nous à [email protected].
Questions? Contact the NRC Publications Archive team at
[email protected]. If you wish to email the authors directly, please see the first page of the publication for their contact information.
https://publications-cnrc.canada.ca/fra/droits
L’accès à ce site Web et l’utilisation de son contenu sont assujettis aux conditions présentées dans le site LISEZ CES CONDITIONS ATTENTIVEMENT AVANT D’UTILISER CE SITE WEB.
TechConnect briefs 2018: Advanced Materials. Vol. 3 Biotech, Biomaterials and
Biomedical, pp. 12-15, 2018
READ THESE TERMS AND CONDITIONS CAREFULLY BEFORE USING THIS WEBSITE. https://nrc-publications.canada.ca/eng/copyright
NRC Publications Archive Record / Notice des Archives des publications du CNRC :
https://nrc-publications.canada.ca/eng/view/object/?id=eee0182e-0732-47ee-a6b1-7c3d5a7eda9d https://publications-cnrc.canada.ca/fra/voir/objet/?id=eee0182e-0732-47ee-a6b1-7c3d5a7eda9d
NRC Publications Archive
Archives des publications du CNRC
This publication could be one of several versions: author’s original, accepted manuscript or the publisher’s version. / La version de cette publication peut être l’une des suivantes : la version prépublication de l’auteur, la version acceptée du manuscrit ou la version de l’éditeur.
Access and use of this website and the material on it are subject to the Terms and Conditions set forth at
Meat spoilage sensing devices
Meat Spoilage Sensing Devices
K Bosnick
*, L-L Tay
**, J Bruce
*, B Smith
*, H Zhang
*, C Shwartz
* *Nanotechnology Research Centre, National Research Council Canada,
11421 Saskatchewan Drive, Edmonton, T6G 2M9, Canada, [email protected]
**Measurement Science and Standards Research Centre, National Research Council Canada,
1200 Montreal Road, Ottawa, K1A 0R6, Canada
ABSTRACT
The safety, sustainability, and profitability of the food industry will remain a key societal challenge in the decades ahead. When meat begins to degrade, the protein decomposes and releases biogenic amines. Early detection of these volatile amines therefore provides a means to sense the onset of meat spoilage. In this work, Pd-decorated ZnO nanomaterials deposited on interdigitated electrode substrates are found to show an excellent chemiresistive response to methyl amine in air with concentrations as low as 25 ppm and with operating temperatures as low as 150 °C. These results suggest that a similar chemiresistive response to biogenic amines may be possible. Surface enhanced Raman scattering is shown to be an excellent tool for sensing biogenic amines, largely due to the chemical interactions between the amine group and the Au / Ag nanoparticles, as well as the effect of the diamine on the aggregation of the nanoparticles.
Keywords: food safety, spoilage, amine, chemiresistor, SERS.
1. INTRODUCTION
The safety, sustainability, and profitability of the food industry will remain a key societal challenge in the decades ahead. For example, the value of food waste in Canada is currently over $31 billion annually (or about 2% of Canada’s GDP), and when the cost of associated wastes (e.g. energy, water, etc.) is factored in rises to over $100 billion [1]. In North America, over 20% of the initial production of meat is lost due to waste, most of which occurs at the later stages in the food supply chain [2]. The carbon footprint associated with global food waste is estimated to be over 4.4 GtCO2 eq per year with over 20%
of this coming from meat waste [3]. Smart materials and devices that are capable of sensing meat spoilage in its early stages are needed to ensure safe meat consumption and minimize waste, both at the end consumer level and earlier in the production chain.
When meat begins to degrade, the protein decomposes and releases biogenic amines (e.g. H2N-(CH2)5-NH2,
cadaverine). Early detection of these volatile amines therefore provides a means to sense the onset of meat spoilage [4-6] and can potentially lead to a significant
reduction in meat waste. Optical sensors that work on, for example, the change in plasmonic properties of a material when volatile amines are present can be envisioned as being integrated into meat packaging to alert the consumer to potential spoilage issues. Hand-held devices that can detect volatile amines via a change in electrical resistance can also be envisioned as being useful by meat inspectors further up the supply chain.
In this work, ZnO nanorod films are fabricated on interdigitated electrode substrates and decorated with sensitizing catalyst particles [7]. The materials are characterized physicochemically for their morphology and composition. A chemiresistive response to volatile biogenic amines is tested for by utilizing the model test gas methyl amine (MA, CH3-NH2), which is more convenient to work
with in the gas phase for the initial screening experiments than volatile biogenic amines. An excellent chemiresistive response to amines is found. The effects of gas composition, temperature, and catalyst are discussed.
In parallel with the chemiresistor work, optical sensing is explored utilizing colloidal Ag and Au nanoparticles (NP). The colloidal sols are incubated with MA or cadaverine aqueous solutions and the surface enhanced Raman spectra (SERS) are monitored to determine the presence of the molecules.
2. MATERIALS AND METHODS
2.1 ZnO Nanorod Chemiresistive Sensing
ZnO nanorod devices are fabricated on interdigitated electrode substrates (100 Pm gap, Cr/Au electrodes on fused silica). The ZnO nanorods are deposited by a two-step hydrothermal process adapted from the methods of Deng and coworkers [8]. In a typical preparation, 0.14 g of zinc acetate (99.98%, Alfa Aesar) is dissolved in 15 mL of ethanol (anhydrous, Fisher) to form a seed solution. The substrates are immersed in the solution for 10 s, washed in ethanol for 10 s, and then placed on a hotplate at 240 °C for 30 min. This seeding process is repeated five times. A growth solution is prepared by dissolving 0.75 g of zinc nitrate hexahydrate (≥99.0%, Sigma-Aldrich) and 0.18 g of hexamethylenetetramine (≥99.5%, Sigma-Aldrich) in 100 mL of deionized water and is stirred for 30 min. To this solution, 4.7 mL of ammonia (27-30%, FCC/NF Grade, JT Baker) is slowly added. The seeded substrates are inserted
face up into vials and 15 mL of growth solution is added to each vial. The vials are heated to 90 °C overnight, and then the substrates are rinsed with deionized water and dried under a nitrogen stream.
Pd catalyst decoration of the ZnO nanorods is performed by a wet chemical method, using a 19.7 mM palladium acetate (≥98%, Strem Chemicals) in ethanol solution. The ZnO nanorod coated substrates are immersed in the precursor solution for 5 s and then dried under a nitrogen stream. The process is repeated three to seven times to vary the Pd particle loading, and then the substrates are annealed at 250 °C for one hour. The ZnO nanorods are characterized by field emission scanning electron microscopy (SEM, Hitachi S4800, 20 kV), by transmission electron microscopy (TEM, Hitachi H-9500, 300kV), and by X-ray photoelectron spectroscopy (XPS, Kratos AXIS Ultra DLD spectrometer using an Al K-alpha X-ray source).
The sensor response to MA is tested for using a home built apparatus (see Figure 1). The MA test gas (500 ppm in N2, Matheson Gas) is diluted with O2 and N2 through mass
flow controllers to achieve the desired gas composition. The mixed gas is flowed over the device under test while the device resistance is monitored (Keithley 2400 SMU). The device temperature is controlled by a resistive heater and thermocouple located near the device and a closed loop controller (Omega Engineering). The entire apparatus is controlled by a central computer through a LabView script.
2.2 SERS-Based Optical Sensing
Ag NPs are synthesized with the citrate reduction protocol. A solution of AgNO3 (50 mL, 1.0 mM) in
18.2 MΩ deionized water is heated until it begins to boil. To this boiling solution, 1 mL of 51.0 mM sodium citrate solution is added. The solution is maintained at a boiling condition under reflux for 60 minutes. The Ag sol is cooled to room temperature and stored in ambient conditions. The as-synthesized Ag sol has a large broad scattering band at 420 nm. SEM images shows a broad NP size and shape distribution with the average NP size ~60 nm (data not shown).
Large Au NPs are synthesized through the kinetic control of seed mediated growth from smaller Au seeds [9]. A solution of sodium citrate (150 mL, 2.2 mM) is brought to a boil under reflux. To this boiling solution, 1 mL of
25 mM HAuCl4 is added, causing a colour change of the
solution from yellow to red in 15 min. The resulting Au NP seeds are ~10 nm in diameter and passivated by citrate ions. This solution is allowed to cool to 90 ºC and then 1 mL of 25 mM HAuCl4 is added. The solution is kept under
constant stirring while maintaining a temperature under 90 ºC. This process is repeated twice. The lower temperature prevents the formation of new seed particles and continues to grow the existing NPs to a larger size. The solution is then cooled to ambient temperature. In another reaction vessel, 55 mL of the as synthesized Au NPs are diluted with 53 mL of DI water and 2 mL of 60 mM sodium citrate to make the new seed solution for the subsequent growth of larger Au NPs. This process is repeated 9 to 11 times to reach the desired size of ~80 nm. SEM imaging is carried out at each step to determine the NP shape and size as well as ensuring no new seed particles are formed. The 80 nm Au NPs have a scattering maximum at 570 nm (data not shown).
100 mL of the as synthesized Au and Ag NPs are incubated with 50 µL of 500 mM MA and 50 mM cadaverine, respectively. After 30 minutes of incubation, the NPs are cleaned by centrifuging and re-suspending in DI water. A drop of the colloidal sol from each solution is then spotted on a Si wafer for Raman analysis. The Raman analysis is performed using a commercial micro-Raman system (Horiba, LabRAM-HR, 632.8 nm excitation, 103 W/cm2).
3. RESULTS AND DISCUSSION
3.1 ZnO Nanorod Chemiresistive Sensing
A typical SEM image of the as-synthesized ZnO nanomaterial on the device substrate is shown in Figure 2(a). The material is found to show a dendritic, nanorod morphology with nanometer scale features and high degree of homogeneity. The structure appears to be electrically connected in a percolation network. Figure 2(b) shows a magnified TEM image of the ZnO material after deposition of the Pd catalyst particles by five immersions in the Pd precursor solution. A high density of particles is seen with typical lateral dimensions on the order of a few nanometers. TEM/EDS and TEM/ED confirm the chemical composition of the particles as crystalline Pd (data not shown). XPS analysis further reveals that the material with five immersions contains about 12 at% Pd.
A device response to MA is tested for by monitoring the resistance of the Pd decorated ZnO devices on the interdigitated electrode substrates while cycling the MA concentration between 400 ppm and 0 ppm in air (20% O2
in N2 balance) at 250 °C with a 3 min. MA / 3 min. air
cycle time (see Figure 3). An initial response to MA of
S = Ra / Rg = 17.9 k: / 0.7 k: = 26 is found for the five
immersion sample shown in Figure 3, where Ra is the
resistance in air (at 3 min.) and Rg is the resistance in
400 ppm MA in air (at 6 min.). Initial responses of as high as S = 150 have be seen on other devices.
The device is seen not to recover back to its original resistance in air for the second and subsequent 3 min. cycle times. Bringing this device back to room temperature and then repeating the complete heating and cycling experiment, however, produces the same results as for the first heating and cycling experiment, indicating that the loss of resistance is reversible. Further experiments are planned to characterize the recovery time of the device in more detail. Varying the number of soaks in the Pd precursor solution indicates that five soaks is about optimum, but further experiments are planned to confirm this quantitatively and establish the effect of the Pd in more detail.
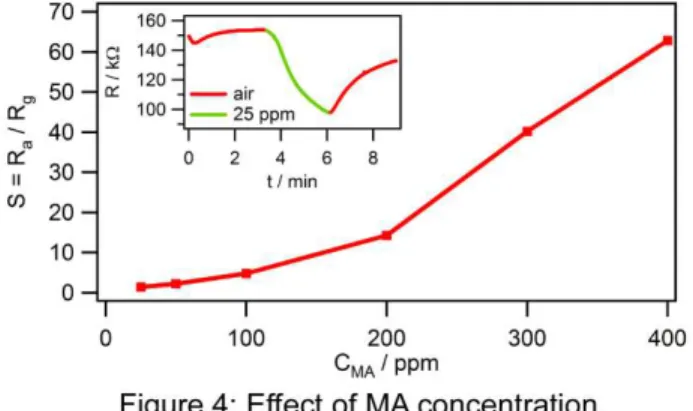
The effect on the device response (S) of varying the concentration of MA (CMA) is shown in Figure 4, with the
time trace for the 25 ppm run inset. Experiments are conducted with as low as 25 ppm MA and still show a clear response to MA. The response shown in Figure 4 appears to be slightly super-linear with increasing MA concentration; however, it is not clear why this would be the case. Further experiments are planned to investigate this further and determine the source of the super-linear behaviour. Experiments are also performed at lower device operating temperatures and a good response (although with a decrease in S) is found with temperatures as low as 150 °C. Below this temperature, the devices did not respond well.
3.2 SERS-Based Optical Sensing
SERS is a short-range effect and tends to generate the best results when the target molecules can be directly associated on the NP surface. Optimal surface enhancement
of Raman signals comes from slightly aggregated nanoclusters with the junctions between NPs carrying the most intense electromagnetic field enhancement [10,11], making them the most desirable location for chemical sensing. These conditions suggest that biogenic amines such as putrescene and cadaverine are promising target analytes. These diamines provide the primary amine functional group which can readily adsorb on the NP surfaces. The second –NH2 termination renders the
molecule multivalent and promotes aggregation of the NPs in solution, forming highly enhancing SERS clusters for signal transduction.
Figure 5 shows the Raman spectrum of a 40% MA solution and the SERS spectra of MA and cadaverine adsorbed on Ag NPs. The normal Raman spectrum of MA shows a strong and narrow band at 1034 cm-1 from the symmetric CN stretch. This band broadens and splits (1040, 1091, and 1126 cm-1) as the molecule adsorbs on the NP surfaces as seen in the SERS spectrum. (Note that the sharp peak at 520 cm-1 is from the Si substrate.) Noticed the three bands are also observed in the cadaverine SERS spectra which shows the similar binding nature between two different primary amines. The as-synthesized Ag and Au surfaces are passivated with citrate ions which render the NPs negatively charged. Hydration of the primary amine will render its ionic form to be positively charged, making it easier to adsorb onto the NP surfaces. We anticipate the pH value of the solution may affect the SERS performance of the sensor.
4. CONCLUSION
In summary, Pd-decorated ZnO nanomaterials deposited on interdigitated electrode substrates show an excellent chemiresistive response to MA in air with concentrations as low as 25 ppm and with operating temperatures as low as 150 °C. These results suggest that a similar chemiresistive response to volatile biogenic amines may be possible. Further experiments are underway to optimize the performance and investigate the sensing mechanism. SERS is shown to be an excellent tool for sensing biogenic amines, largely due to the chemical interactions between the amine group and the Au / Ag NPs, as well as the effect of the diamine on the aggregation of the NPs. The nature of the binding between MA and the Au / Ag surface is found to be the same as for cadaverine and the Au / Ag surface. Further experiments are underway to establish the limits of sensitivity of the SERS technique for the detection of biogenic amines.
ACKNOWLEDGEMENTS
Funding for this work was provided by the National Research Council Canada. We would like to thank Jian Chen for assistance with the TEM analysis and Oltion Kodra for assistance with the XPS analysis.
REFERENCES
[1] MV Gooch, A Felfel, “$27 Billion Revisited: The Cost Of Canada’s Annual Food Waste”, Value Chain Management International Inc. Available from http://vcm-international.com/wp-content/uploads/2014 /12/Food-Waste-in-Canada-27-Billion-Revisited-Dec-10-2014.pdf (accessed 22 February 2017).
[2] FAO. 2011. “Global food losses and food waste – Extent, causes and prevention”. Available from www.fao.org/docrep/014/mb060e/mb060e.pdf (accessed 22 February 2017).
[3] FAO. 2015. “Food wastage footprint & Climate Change”. Available from www.fao.org/3/a-bb144e.pdf (accessed 22 February 2017).
[4] F Galgano, F Favati, M Bonadio, V Lorusso, P Romano, “Role of biogenic amines as index of freshness in beef meat packed with different biopolymeric materials”, Food Res. Int., 42, 1147-1152, 2009.
[5] CC Balamatsia, EK Paleologos, MG Kontominas, IM Savvaidis, “Correlation between microbial flora, sensory changes and biogenic amines formation in fresh chicken meat stored aerobically or under modified atmosphere packaging at 4 °C: possible role of biogenic amines as spoilage indicators”, Antonie Leeuwenhoek, 89, 9-17, 2006.
[6] C Ruiz-Capillas, F Jimenez-Colmenero, “Biogenic amines in meat and meat products”, Crit. Rev. Food Sci. Nutr., 44, 489-499, 2004.
[7] PT Moseley, “Progress in the development of semiconducting metal oxide gas sensors: a review”, Meas. Sci. Technol., 28, 082001, 2017.
[8] X Deng, SB Sang, PW Li, G Li, FQ Gao, YJ Sun, WD Zhang, J Hu, “Preparation, characterization, and mechanistic understanding of Pd-decorated ZnO nanowires for ethanol sensing”, J. Nanomater., 2013, 297676, 2013.
[9] N. G. Bastus, J. Comenge, V. Puntes, “Kinetically controlled seeded growth synthesis of citrate-stabilized gold nanoparticles of up to 200 nm: size focusing versus Ostwald ripening”, Langmuir, 27, 11098-11105, 2011.
[10] L.-L. Tay, J. Hulse, “Surface-enhanced Raman and optical scattering in coupled Plasmonic nanoclusters”, J. Mod. Optics, 60, 1107-1114, 2013.
[11] L.-L. Tay, J. Hulse, D. Kennedy, J. P. Pezacki, “Surface-enhanced Raman and resonant Rayleigh scattering from adsorbate saturated nanoparticles”, J. Phys. Chem. C., 114, 7356-7363, 2010.