Application of CAST to
Hospital Adverse Events
by
Meaghan O’Neil
B.S. Chemical Engineering (2004) Cornell University
Submitted to the System Design and Management Program in Partial Fulfillment of the Requirements for the Degree of
Master of Science in Engineering and Management at the
Massachusetts Institute of Technology September 2014
© 2014 Meaghan O’Neil All rights reserved
The author hereby grants to MIT permission to reproduce and to distribute publicly paper and electronic copies of this thesis document in whole or in part in any medium now known or
hereafter created.
Signature of Author ______________________________________________________
Meaghan O’Neil System Design and Management Program May 2014 Certified by _____________________________________________________________
Nancy Leveson Thesis Supervisor Engineering Systems Division
Accepted by _____________________________________________________________
Patrick Hale Director System Design & Management Program
Acknowledgements
I would like to thank the MIT SDM program, including the faculty, staff, and classmates; it has been a wonderful experience and learning opportunity. Special thanks to Pat Hale, who welcomed me to the SDM conference 5 years ago, later encouraged me to apply, and has been a wonderful supporter along the way.
To Professor Nancy Leveson who served as my advisor and to John Thomas, Ph.D., thank you for contributing to my understanding of STAMP and guiding me along the way.
To the staff at the VA Boston, thank you for collaborating with me on this demonstration of CAST. Without them I would not have had access to the case provided, or the independent root causes analysis for comparison.
I am also very appreciative to the many folks I interviewed and shadowed across the industry who shaped my understanding. Special thanks to Margaret who helped coordinate and arrange my countless shadowing visits.
To my family and friends who have been supportive along the way, thank you.
Finally, to the reader, thank you for being open-‐minded and considering new approaches!
Application of CAST to Hospital Adverse Events
by Meaghan O’NeilSubmitted to the Department of System Design and Management on May 15, 2014 in Partial Fulfillment of the
Requirements for the Degree of
Masters of Science in Engineering and Management
ABSTRACT
Despite the passage of 15 years since the Institute of Medicine sought to galvanize the nation with its report To Err is Human, the authors’ goal to dramatically improve the quality of healthcare delivery in the United States has yet to be accomplished. While the report and subsequent efforts make frequent reference to the challenges of designing and obtaining system safety, few system tools have been applied in the healthcare industry. Instead, methods such as root cause analysis (RCA) are the current accepted industry standards. The Systems Theoretic Accident Model and Processes (STAMP) is a model created by Dr. Nancy Leveson that has been successfully applied in a number of industries worldwide to improve system safety. STAMP has the capability to aid the healthcare industry professionals in reaching their goal of improving the quality of patient care.
This thesis applies the Causal Accident Systems Theoretic (CAST) accident analysis tool, created by Dr. Leveson based on STAMP, to a hospital accident. The accident reviewed is a realistic, fictionalized accident described by a case study created by the VA to train
healthcare personnel in the VA RCA methodology. This thesis provides an example of the application of CAST and provides a comparison of the method to the outcomes of an RCA performed by the VA independently on the same case.
The CAST analysis demonstrated that a broader set of causes was identified by the systems approach compared to that of the RCA. This enhanced ability to identify causality led to the identification of additional system improvements. Continued future efforts should be taken to aid in the adoption of a systems approach such as CAST throughout the healthcare
industry to ensure the realization of the quality improvements outlined by the IOB in 1999.
Thesis Supervisor: Nancy G. Leveson
Title: Professor of Aeronautics and Astronautics and Engineering Systems
Table of Contents
ACKNOWLEDGEMENTS ... 3
ABSTRACT ... 5
TABLE OF CONTENTS ... 7
CHAPTER 1: INTRODUCTION ... 9
MOTIVATION ... 9
RESEARCH OBJECTIVE ... 10
CHAPTER 2: LITERATURE REVIEW ... 11
EVOLUTION OF THE MODERN HEALTHCARE SYSTEM ... 11
HEALTHCARE SYSTEM SAFETY ... 12
ACCIDENT CAUSALITY MODELS ... 14
SYSTEM-‐THEORETICAL ACCIDENT MODEL AND PROCESSES (STAMP) ... 15
Hierarchical Control Structure ... 15
Process Models, Mental Models, and Algorithms ... 16
Safety Constraints ... 17
CAUSAL ACCIDENT SYSTEM THEORETIC (CAST) ... 17
HEALTHCARE ROOT CAUSE ANALYSIS ... 18
CHAPTER 3: METHODOLOGY ... 21
CHAPTER 4: VA PNEUMOTHORAX CASE STUDY ... 22
CASE STUDY: PNEUMOTHORAX ... 22
Summary of the Event ... 22
CHAPTER 5: VA RCA ANALYSIS ... 24
CONTRIBUTING FACTORS: ... 24
ROOT CAUSE: ... 24
ACTION: ... 24
CHAPTER 6: CAST ANALYSIS ... 25
STEP 1: IDENTIFY THE SYSTEM(S) AND HAZARD(S) INVOLVED IN THE LOSS ... 26
Accident ... 26
System Hazards ... 26
STEP 2: IDENTIFY THE SYSTEM SAFETY CONSTRAINTS AND SYSTEM REQUIREMENTS ASSOCIATED WITH THAT HAZARD ... 26
The System Safety Constraints ... 26
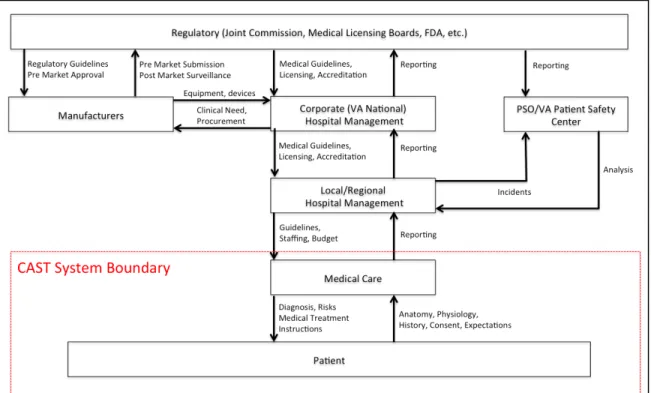
STEP 3: DOCUMENT THE SAFETY CONTROL STRUCTURE IN PLACE TO CONTROL THE HAZARD AND ENFORCE THE SAFETY CONSTRAINTS ... 26
High-‐Level Control Structure ... 26
STEP 4: DETERMINE THE PROXIMATE EVENTS LEADING TO THE LOSS ... 28
Phase I: Diagnosis ... 28
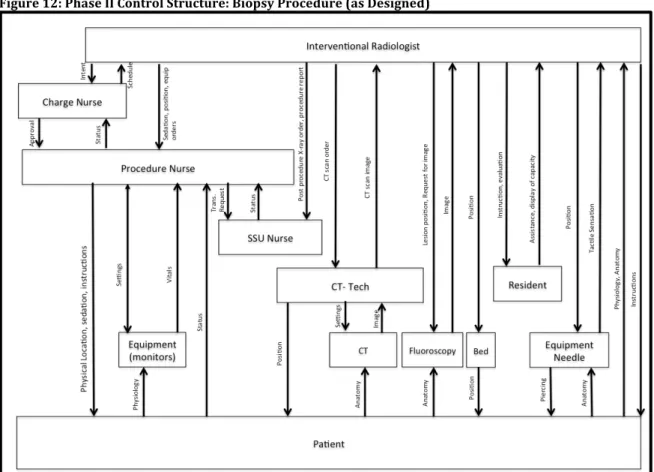
Phase II: Biopsy Procedure ... 28
Phase III: Post-‐Procedure Recovery in SSU ... 29
STEP 5: ANALYZE THE LOSS AT THE PHYSICAL SYSTEM LEVEL ... 31
Phase I: Diagnosis ... 31
Phase II: Biopsy Procedure ... 33
STEP 6: MOVING UP THE LEVELS OF THE SAFETY CONTROL STRUCTURE, DETERMINE HOW AND WHY EACH SUCCESSIVE HIGHER LEVEL ALLOWED OR CONTRIBUTED TO THE INADEQUATE CONTROL AT THE CURRENT LEVEL
... 37
Phase I: Diagnosis ... 37
Phase II: Biopsy Procedure ... 44
Phase III: Post-‐Procedure Recovery ... 52
STEP 7: REVIEW CONTRIBUTIONS OF COORDINATION OR COMMUNICATION FAILURES ... 60
STEP 8: DETERMINE THE DYNAMICS AND CHANGES IN THE SYSTEM AND THE SAFETY CONTROL STRUCTURE RELATING TO THE LOSS AND ANY WEAKENING OF THE SAFETY CONTROL STRUCTURE OVER TIME. ... 60
STEP 9: GENERATE RECOMMENDATIONS ... 61
Short-‐Term Recommendations: ... 61
Long-‐Term Recommendations: ... 61
CAST CONCLUSION ... 61
CHAPTER 7: COMPARISON OF ROOT CAUSE ANALYSIS AND CAST ... 62
CHAPTER 8: FUTURE WORK ... 63
BIBLIOGRAPHY ... 64
Chapter 1: Introduction
“When patients enter a hospital, they reasonably assume that their treatments will make them better, or, at the least, not make them worse.”
-‐Dr. Lucian Leape MD [1]
Motivation
Stakeholders throughout the modern healthcare system in the United States have a
common goal; they want the healthcare system to be safe. Medical doctors pledge to follow the Hippocratic oath to “First, do no harm” and nurses often pledge to follow a similar Nightingale Pledge [2]. Similar to medical providers, clinical engineers, technicians, medical device designer engineers, and regulators do not set out to provide unsafe care. Also, the safety of healthcare is also highly personal. For most Americans, healthcare is not entirely avoidable and as Dr. Leape comments, patients assume that the care they receive will not result in harm. In addition to the common goal and vested personal interests, a number of individuals and organizations have attempted to improve the safety of the healthcare system. For example, the Institute of Medicine (IOM) published its pivotal 1999 report To
Err is Human, a watershed in the industry, which presented alarming statistics of
healthcare safety and called for industry-‐wide reforms. Around the same time, the Department of Veterans Affairs (VA) created the VA’s National Center for Patient Safety, which conducted a patient safety initiative to improve the safety of care at the VA’s
facilities [3]. In the following years, a number of initiatives and policies have continued to focus efforts on improving the safety of the national healthcare system. Despite the increased effort, reports indicate that the safety of the healthcare system still remains inadequate [3].
Efforts have achieved limited success in part because modern US healthcare is a complex, sociotechnical system that is composed of numerous stakeholders and technology. As a complex system, it is inherently difficult to manage and improve in part because of the number of components as well as the degree of coupling. The coupling between system elements increases the difficulty in predicting emergent properties such as system safety. In addition, the healthcare system is dynamic and changes over time. Accident
investigations therefore are vital to the effort to improve the safety of the system as investigators strive to both understand why an accident occurred and identify the areas that need to be improved to prevent future accidents. While the IOM outlined changes needed to improve safety, including increased reporting, it did not include a
recommendation for changes to the investigation methodology. The root cause analysis investigation approach has remained standard across the industry throughout the past two decades including at the VA.
An alternative system safety approach for accident investigation, the Causal Accident System Theoretic tool (CAST), was developed by Dr. Nancy Leveson and applied in many industries worldwide. CAST is a tool based on the Systems-‐Theoretical Accident Model and Processes (STAMP), a model created using system theory [4].
Research Objective
The goal of this thesis is to provide a demonstration of the application of CAST, a system based tool, to healthcare. This thesis will provide an example of the CAST tool applied to a hospital accident case. In addition, the outcomes of the CAST analysis will be compared to the outcomes achieved by an independent application of the VA Root Cause Analysis. The intent of the analysis is to increase awareness of the system-‐based tool and to provide an example for instruction and evaluation of the CAST method for the healthcare industry.
This thesis is organized as follows. Chapter 2 reviews the literature related to the modern healthcare system and accident investigation tools. Chapter 3 describes the methodology used. Chapter 4 presents the case study analyzed using RCA and CAST. Chapter 5 presents the findings of the RCA analysis conducted by the VA. Chapter 6 presents a detailed example CAST analysis. Chapter 7 provides a qualitative comparison between the results of the RCA and CAST analyses. Chapter 8 concludes and offers recommendations for future research.
Chapter 2: Literature Review
Evolution of the Modern Healthcare system
Shift in Management
As Richard Bohmer describes in Designing Care, medical knowledge has increased significantly since the 1970s both in terms of volume and specificity [5, pp. 26]. This knowledge increase fueled major evolutions in the overall healthcare delivery system. For example, expanded knowledge led to an increase in the level of specialization among medical practitioners. Patients have also experienced increased access to information, which has shifted their role from passive recipients of healthcare to actively involved and influential stakeholders. Likewise, knowledge and innovation have resulted in an
increasing amount of technology in the delivery and management of healthcare. As a result, the overall healthcare system is increasingly adding complexity as it continues to grow and evolve [5].
Bohmer also attributes major evolution of the organization and management of the healthcare industry to the increase of medical knowledge. While in the past, Bohmer indicates there was separation between the care provided and management of the healthcare facilities, this has clearly shifted. The current industry has evolved so that delivery organizations are based on healthcare management,) a result of blending the roles of management and business decision-‐making with the practice of medicine. This blending occurred in part because increased knowledge allowed for an increase in performance and outcome measurements, as well as an increase in efforts for standardization through the creation of standard operating procedures (SOPs). Standardization has occurred in some areas, which Bohmer describes as linear or sequential applications of care, where the diagnoses and treatment of patients is well understood and can be routinized. However, many areas of the ever-‐expanding industry remain iterative, and suspected diagnoses are evaluated with tests and treatments which are then further refined and evaluated, without a clear “right path” being apparent [5, pp. 19-‐49].
Policy Shaped Evolution
In addition to the evolution resulting from increased medical knowledge, national policy changes also continually affect the evolution of the modern healthcare system. For
example, legislation in 1965 created the Centers for Medicare and Medicaid Services as well as established the Joint Commission as a national hospital accreditor [6]. By assuming a major increase in the burden of the cost of healthcare delivery through the creation of CMS, the federal government increased its incentive to both monitor and influence the quality and safety of the care provided. As a result, hospitals are required to have quality systems in order to be accredited by the Joint Commission, which affects the reimbursement provided by CMS for care provided. Quality systems include both incident investigation and processes for reporting and tracking investigations and improvement efforts. The Joint Commission and the Veterans Affairs hospitals established their quality system guidelines around root cause methodology [7, 8].
Increased Reporting
Surveillance and reporting continued to increase over time as public and private entities increased the resources dedication to tracking and improving healthcare safety. For example, the Institute of Medicine (IOM), a non-‐profit organization that published To Err is
Human, was established in 1970 and the Agency for Healthcare Research and Quality
(AHRQ), formed by Congress in 1989, creates annual National Healthcare Quality Reports to monitor the healthcare system [9]. Entities funded by both public and private sectors were also created, such as the National Quality Forum (NQF), founded in 1999, which authored the list of Serious Reportable Events. The NQF indicated that occurrences of these events should be documented and reported by hospitals [10]. More recently, in 2005, the Federal Patient Safety and Quality Improvement Act created Patient Safety
Organizations (PSOs), in an additional attempt to increase reporting and analysis of incidents among hospitals. By allowing protection from legal repercussions, PSOs are intended to promote increase sharing of incident information [28]. Despite the efforts of these organizations and numerous others, tracking and reporting is not standardized across the industry; no nationwide reporting tools currently exist, while state-‐specific reporting tools exist in approximately half of the country [12].
Economic Influences
In addition to added reporting, hospitals have also begun to directly shoulder more of the economic burden of medical errors as insurances companies have shifted to reduce or stop reimbursement when errors occur resulting in harm. CMS reduced reimbursement to hospitals when errors occur that are considered avoidable (sometimes referred to as Hospital Acquired Conditions) and the Patient Protection and Affordable Care Act further increased these economic incentives [13]. It has meanwhile been reported that hospitals have identified a financial benefit to employing resources dedicated to patient safety [16]. Healthcare System Safety
Quality of Healthcare in America Project
In 1998, the IOM undertook the Quality of Healthcare in America Project [14]. The project’s goal was to improve the quality of the nation’s healthcare system in the following decade. Originally intending to produce a series of reports, the project succeeded in publishing two major reports, the first, To Err is Human, in 1999, and the second, Crossing the Quality
Chasm in 2001 [14,15]. The first report was intended to be a marshaling event to rally the
nation around the need to improve the quality of healthcare delivery in the United States. The IOM report brought to light alarming statistics on accidents in hospitals.
The IOM provided a view of public opinion of the safety of the healthcare system at the time of its publication. The public opinion captured by a poll conducted by the National Patient Safety Foundation revealed that the public perception of healthcare was that it was “moderately safe” giving it a score of 4.9 on a scale from 1 (not safe at all) to 7 (very safe). At the time the public viewed hospital care as safer than nuclear power or food handling, but less safe than air travel [14, pp. 42]
The IOM reported that 98,000 deaths/year were attributed to medical errors that were viewed as avoidable [14, pp. 31]. To frame the perception of magnitude, the IOM provided the following relative annual death statistics:
• Medical Errors (98,000)
• Motor Vehicle Accidents (43,458) • Breast Cancer (42,297)
• AIDs (16,516) [14, pp.26]
The cost to the nation associated with preventable medical errors was also quantified by the IOM as ranging between $17-‐29 billion [14, pp.27]. The effects of the high number of medical errors went beyond direct costs, including:
• Lost trust
• Decreased healthcare provider satisfaction • Lost worker productivity
• Decreased school attendance
• Decreased population health status [14, pp. 41]
In additional to increasing awareness and quantifying the scope of the problem, the report highlighted the systemic nature of medical errors [14, pp. 49-‐67]. Although the report highlighted the need to shift the focus of accident investigations away from blaming providers and acknowledged the limitations of the root cause methodology, a system approach was not included in the IOM’s main recommendations, which instead included:
1) The creation of a National Center for Patient Safety 2) A national mandatory reporting system
3) Increased FDA pre-‐ and post-‐marking processes to improve the safety of drugs [14, pp.5-‐15]
VA National Center for Patient Safety
The VA’s National Center for Patient Safety (NCPS) was established in 1998. In the same year, the NCPS published a survey of patient safety that included the finding that 73% of the VA staff members surveyed “either strongly disagreed or were neutral towards the importance of patient safety” [16]. The NCPS also implemented a patient safety initiative (PSI) in 1998. The initiative resulted in the implementation of three systems that included both a root cause analysis system and a patient safety reporting system (PSRS) [3]. The role of the patient safety managers (PSM) was also created; their responsibilities included reporting adverse events and near misses, creating RCA teams, and communicating safety concerns to other VA facilities [3].
Safety Remains a Concern
While To Err is Human succeeded in increasing awareness focusing efforts on medical errors, resulting improvements were seen as incremental [12,15]. In spite of the
acknowledgement that “system failures cause most injuries,” methods such as root cause analysis are still used today rather than a systems approach. Fifteen years have passed since the IOM fought to rally the nation to improve the quality of healthcare delivery, and yet key opinion leaders including James Bagian, MD, PE, director of the NCPS, have
indicated that as recently as 2005, “very little has changed”[16]. Supporting this
assessment, research conducted by the Commonwealth Fund found that in 2011, “1 in 5 adults [surveyed] reported they or their family members ended up with an infection or complication as a result of medical care or said that a health care provider made a surgical or medical mistake [within the past 2 years]” [17].
Accident Causality Models
The ability to create and maintain safe systems is a universal goal that transcends industry affiliation. System designers and operators depend on forming an understanding of how and why accidents occur in order to improve system safety. This understanding is broadly termed an accident causality model. A simple linear causality model was described in the early 20th century and remains pervasive today, creating the foundation of a number of
design and accident investigation techniques. The model assumes that a chain of failure events causes an accident.
A founder of one of the earliest described chain of events models, H. W. Heinrich published a description of his Domino Model in 1931. Heinrich’s model explains accidents as a series of events or “dominos.” In this model, an event, usually a failure, occurs, which then leads to another, which leads to another, cascading eventually to the accident under
investigation. The events were assumed to be caused by an operator or worker error. A similar chain of events based causality model, the Swiss Cheese Model, was described by James Reason who attempted to include more than operator error. However, operator error remained the last event in the chain. The Swiss Cheese Model maintained the core elements of the Domino Model. These and other variations of chain of events models are likely appealing because of their simplicity, which allows for the model to be easily conveyed and comprehended [4, pp. 15-‐38].
The chain of events model has formed the foundation of many hazard analysis and accident investigation techniques. These methods include Root Cause Analysis, Fault Trees,
Probability Risk Assessments, Failure Modes and Effects Analysis (FMEA), which are all based on the core concepts of the chain of events causality model [18].
The appeal of a simple model is readily acknowledged; however, the utility has proven to be limited. A chain of events model can allow for seemingly seamless translation from a verbal storyline of an accident, with the familiarity of a novel’s beginning, middle, and end. There is comfort in believing that finding and addressing the “root cause” can prevent accidents [19]. Unfortunately, the fundamental model is too simplistic to capture complex sociotechnical relationships because the events (represented by falling dominos or by holes in cheese slices) are treated as independent, an assumption that is not effective for describing complex systems such as modern hospitals. Reliability, or component failures
may be unmasked by this approach for example, but component interactions are not [4].
Recognizing the need for a more nuanced causality model capable of capturing additional complexity, Dr. Leveson established the Systems-‐Theoretical Accident Model and Processes (STAMP). Leveson also created tools based upon STAMP including a tool for evaluating
system design for safety (STPA) as well as a tool for accident analysis (CAST) [4]. In a departure from the historic chain of events approach, STAMP is a causality model based on systems theory. System theory includes emergent properties, a fundamental recognition that due to coupling between the individual elements, a system is more than a sum of its parts. Safety is an emergent system property and therefore cannot effectively be treated with the decomposition approach of traditional chain of events model [18]. Therefore, even if system designers and investigators fully characterize and can correctly predict the behavior of components as they act individually, due to coupling effects, this knowledge is not sufficient in characterizing and predicting the emergent behavior of a system
containing those components. Translated into the healthcare domain, this is the reason why a system comprised of all “safe” components does not ensure a “safe” system.
System-‐Theoretical Accident Model and Processes (STAMP)
To provide a framework to allow for a systems approach, STAMP leverages the basics of control engineering. By modeling the system of interest with a hierarchical control structure, the component relationships can be represented and incorporated into the system analysis [4].
Hierarchical Control Structure
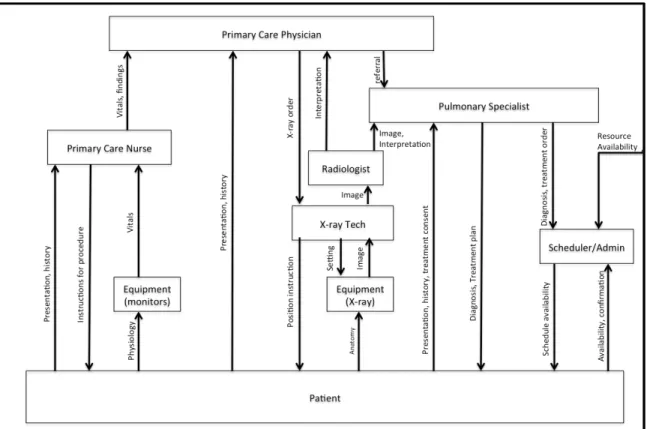
Control structures can be used to provide a visual representation of the components of a system and their relationships to each other. Controllers are system elements that have the ability to issue a command, termed a control action. In control structure diagrams,
controllers are displayed as labeled boxes, which are located along the vertical axis according to their level of control. A simple diagram is shown in Figure 1 to illustrate the
representation of a single controller acting upon a single controlled process. The controller in this example is an insulin pump, while the controlled process is the physiology of the person with diabetes (PWD), specifically their blood glucose. The arrows connecting the controller and the controlled process indicate the control action as well as the feedback. In this example, the control action is the injection of insulin and the feedback is the measured reading of the PWD’s blood glucose.
As more controllers are included in the diagram, the
hierarchy begins to emerge and is displayed by the vertical location of the controllers. Expanding the insulin pump example, the PWD who is wearing the insulin pump can be included in the control diagram. As a controller, the PWD has the responsibility to supervise the medical device, similar to the role of a plant controller supervising the equipment in a process plant. In this example, the PWD monitors the feedback from the insulin pump including the measured blood glucose and the insulin injection rates and makes control decisions on configuring the device.
Figure 1: Simple Control Structure Example with 1 Controller
As the control diagram is expanded in Figure 2, the placement of the controllers along the vertical axis maintains the hierarchical relationships. The placement of system components along the horizontal axis can be adjusted for readability.
The creation of the control diagram is an important feature of the CAST analysis in part because it can help the investigation team build their understanding of the system, including the relationships of the controllers. The control diagram also provides a framework for the
investigators to aid in developing an accurate understanding of why an incident occurred, and importantly, to identify what changes are needed to prevent an accident reoccurrence. The control diagram also plays a very valuable role as a communication tool during and after the investigation.
Process Models, Mental Models, and Algorithms
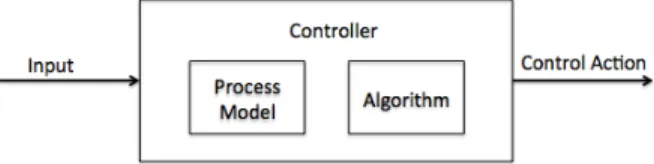
An additional key concept used in STAMP is the recognition of the decision-‐making process of the controllers. As depicted in Figure 3, controllers receive input, which may be a
control action from another controller, feedback from a controlled process, or input about the external environment, for example. The process model (also referred to as a mental model for human controllers) represents the controller’s understanding of the controlled process. This includes the current state and system dynamics as well as the effect of
control actions on the controlled process. The controller’s process model can be influenced by the inputs received from the rest of the system, and the broader system context. In addition, the controller has an algorithm, which is used to derive the control action from the given inputs and process model [4, pp. 41-‐45].
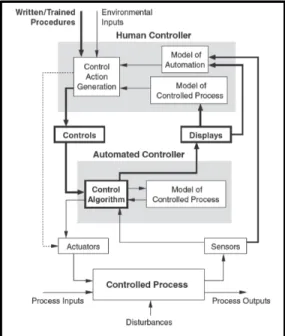
As described by Leveson in Engineering a Safer World, accidents are often the result of a controller’s inaccurate mental model, which translates to unsafe control actions [4, pp 88]. The example below from Engineering a Safer World demonstrates how these fundamental concepts can be visualized in a control structure. This generic example of two controllers, including one human and one software controller, demonstrates the ability of the control diagram to serve as a foundation for understanding system interactions. In addition to demonstrating how external inputs for controllers may include information about the
Figure 3: Control actions are the result of the process model and algorithm of the controller
Figure 2: Example of 2 Controllers displayed in a hierarchical control diagram
environment or training procedures, Figure 4 also demonstrates how controlled processes may have multiple process inputs.
Figure 4: Demonstration of Control Diagram Elements [4, pp. 296]
Safety Constraints
STAMP uses control theory as described above to allow for a systems approach to understanding safety as an emergent system property. In the STAMP model, accidents result when there is inadequate control. For example if necessary safety constraints are not enforced, this may allow unsafe control actions to occur. In the hierarchical control diagram, each level of the hierarchy serves to constrain the level below [4, pp. 80].
Causal Accident System Theoretic (CAST)
CAST (Causal Accident System Theoretic) provides an accident analysis framework for accident investigators to apply the systems approach of STAMP. The tool can enable investigators seeking to understand the causes of the accident and identify necessary system improvement opportunities. Following the CAST framework, the investigator conducts a broad analysis of the relevant sociotechnical system. By examining the system safety control structure, the analyst is then able to locate weaknesses in the control
structure and therefore is not limited to only component failures or single point failures. The focus of the CAST analysis technique is on the question “why” rather than simply “what happened.” The investigator seeks to answer, “Why did the accident occur?” For example, these questions include:
• Why did the human operators act as they did?
• Why did the physical or software components behave as they did?
• Why did the process or mental models of the controllers become misaligned with the
The method begins with the definition of the accident and system hazards involved in the investigation. These initial steps allow the analyst to establish a clear charter for the CAST analysis. In the STAMP methodologies, an accident is defined as: “an undesired and
unplanned (but not necessarily unexpected) event that results in (at least) a specified level of loss” [18, pp. 175]. The system hazards are then defined as: “A system state or set of conditions that, together with a particular set of work-‐case environmental conditions, will lead to an accident (loss)” [4, pp.184]. The following steps include the creation of the system control structure as well as a careful examination of the system physical and control structure. Contributions of the broader sociotechnical system are also examined.
The steps of the CAST method will be demonstrated in the application presented in Chapter 6 and are summarized as follows [4, pp. 350-‐351]:
1. Identify the system(s) and hazards(s) involved in the loss.
2. Identify the system safety constraints associated with that hazard
3. Document the safety control structure in place to control the hazard and enforce the safety constraints.
4. Determine the proximate events leading to the loss 5. Analyze the loss at the physical system level.
6. Moving up the levels of the safety control structure, determine how and why each successive higher level allowed or contributed to the inadequate control at the current level.
7. Examine overall coordination and communication contribution to the loss.
8. Determine the dynamics and changes in the system and the safety control structure relating to the loss and any weakening of the safety control structure over time. 9. Generate recommendations.
A more detailed description of each step and examples from other industries can be found in Engineering a Safer World [4, pp. 349-‐390].
Healthcare Root Cause Analysis
Root cause analysis (RCA), based on the chain of events causality model, seeks to identify the main causes that if eliminated would have prevented an accident. The goal of the
technique is described as defining “what happened, how it happened, and why it happened” [20]. Following the domino model imagery, causes that are most closely linked to the resulting harm are often referred to as immediate harms, direct harms, or first-‐level problems. Farther removed causes may be referred to as higher-‐level problems or root causes [20,21]. Used across many industries, the method has several similar variants all created to aid investigators based on these main concepts.
RCAs in healthcare typically involve a Cause-‐Effect Tree in which the main loss is placed at the top of the tree. The goal of the team is then to define the branches of the tree, first by identifying secondary causes and continuing until the team believes they have identified root causes. Typically 2-‐3 causes are then identified by the team as being considered the
most important for prevention of future incidents and these become the resultant “root causes” of the accident [19].
The process used to identify the causes in which to ‘fill out the tree’ may vary. In the simplistic form, teams may proceed to use a 5 Why technique, quite literally asking “why” five repeated times. Other teams may use group brainstorming or other propriety
guidelines [19,21]. The identified root causes are then typically classified and assigned estimated severity or probability of occurrence estimates [19].
At the VA, the National Center for Patient Safety (NCPS) provides specific guidelines for conducting RCAs. The VA implemented its current RCA system in 2000, replacing a former system referred to as the focused review. The goal of the new system was to shift to a “human factors engineering approach” [3]. The RCA teams at the VA, established by the Patient Safety Managers, are provided Triage CardsTM containing 78 questions which where
developed by the NCPS as RCA cognitive aids [3,16]. The initial triage questions include: • “Were issues related to patient assessment a factor in this situation?
• Were issues related to staff training or staff competency a factor in this event? • Was equipment involved in this event in any way?
• Was a lack of information or misinterpretation a factor in this event? • Was communication a factor in this event?
• Were appropriate rules/policies/procedures – or the lack thereof -‐ a factor in this event?
• Was the failure of a barrier designed to protect the patient, staff, equipment, or environment a factor in this event?
• Were personnel or personal issues a factor in this event?” [22]
Based on the team’s answers to the initial triage questions, the Triage CardsTM then refer to
additional questions in the following categories: • “Human Factors -‐ Communications • Human Factors -‐ Training
• Human Factors -‐ Fatigue/Scheduling • Environment/Equipment
• Rules/Policies/Procedures • Barriers” [22]
Finally, to add additional structure to the RCAs, the NCPS defined “5 Rules of Causation” which are summarized as follows:
• “Rule 1: Root Cause Statements must clearly show the ‘cause and effect’ relationship. • Rule 2: Negative descriptions should not be used in Root Cause Statements.
• Rule 3: Each human error must have a preceding cause.
• Rule 4: Violations of procedure are not root causes, they must have a proceeding cause.” [22]
The Joint Commission’s Journal on Quality Improvement contains the publication of examples of the application of the VA root cause approach to example cases [3]. The VA
RCAs are reported using the Patient Safety Information System (PSIS), which is also referred to, as “SPOT” [16]. The VA’s process includes the Safety Assessment Code (SAC), used to prioritize additional effort in further investigation and action.
Chapter 3: Methodology
This thesis presents the outcomes from both a CAST and RCA analysis of a realistic,
fictionalized accident. The accident is described by a case study created by the VA in order to train healthcare personnel in the VA RCA method. An excerpt of the case study is
presented in Chapter 4.
A current VA Patient Safety Manager (PSM) conducted an RCA independently based on the accident described in the case and knowledge of typical VA procedures. The outcomes of the RCA and the recommendations identified by the PSM are presented in Chapter 5.
Concurrently, and prior to reviewing the results of the RCA, the author applied CAST using the details provided in the case and supplemented with observations from shadowing at a Boston teaching hospital. The detailed application and outcomes of the CAST analysis are presented in Chapter 6.
A qualitative assessment was conducted of the outcomes and recommendations resulting from the RCA and CAST applications. This assessment is presented in Chapter 7.
Chapter 4: VA Pneumothorax Case Study
As a leader in healthcare innovation, including patient safety, the Boston branch of the VA provided a sample hospital accident case study to be used in this thesis. The VA also provided example results from a root cause analysis of the case study, which will be presented in Chapter 5. The VA uses the accident case study as part of its employee training of its internal root cause accident investigation method. While the case does not represent a real accident, the details in the case are based upon realistic events, providing a suitable example for comparing the root cause analysis and CAST methodologies.
Permission was obtained to include the case details presented in this chapter [23,24].
CASE Study: Pneumothorax
The following is an excerpt from the VA case study providing the details of the accident to be reviewed.
Event has occurred before -‐-‐
Corrective actions at that time included: awareness training for residents on service;
changed procedure to have follow-‐up chest X-‐rays done within 2 hrs, unless there was a
change in status
Summary of the Event
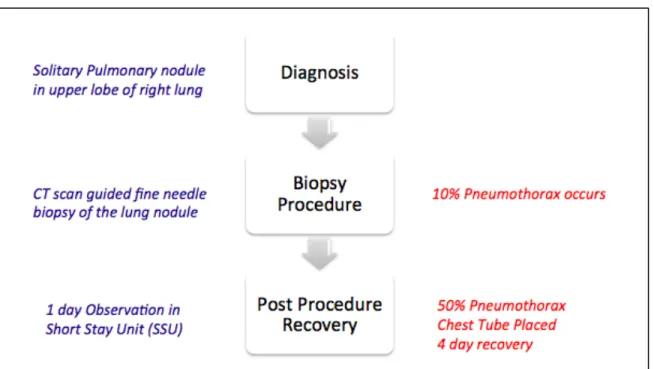
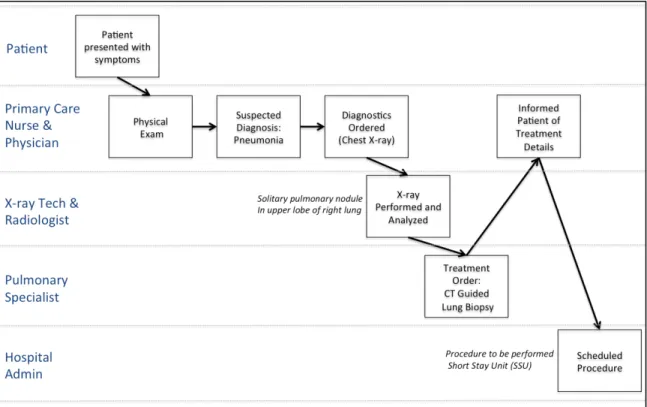
A.B. is a 55-‐year-‐old male who was found to have a solitary pulmonary nodule in the upper lobe of his right lung detected on a chest X-‐ray, which was taken for possible pneumonia. He was subsequently seen by a pulmonary medicine consultant who advised a CT scan guided fine needle biopsy of the lung nodule. The clinic physician and nurse both informed the patient there was likely to be minor discomfort after the procedure and it would not be necessary to stay overnight.
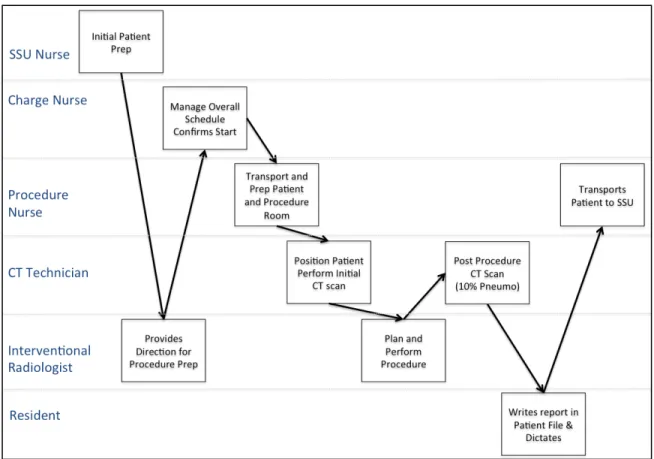
A.B. was admitted to the short stay hospital unit (SSU) on the morning of 11/1/99 to have a CT guided biopsy of the lung nodule by an interventional radiologist. After he was mildly sedated, the patient was transported to the radiology department. The patient also had an IV catheter inserted and cardiac rhythm and blood pressure monitors attached. The
interventional radiologist was assisted by a radiology resident. The role of the resident was to learn the technique by assisting with the procedure and monitoring the patient. The CT scan image was used to locate the lesion. The radiologist inserted a needle through the chest wall into the nodule and aspirated tissue for the specimen. After the needle was withdrawn both clinicians noticed a small (~10%) pneumothorax (air inside the chest cavity but outside the right lung), a common complication. The partially sedated patient had no complaints and denied any shortness of breath or pleuritic chest pain.
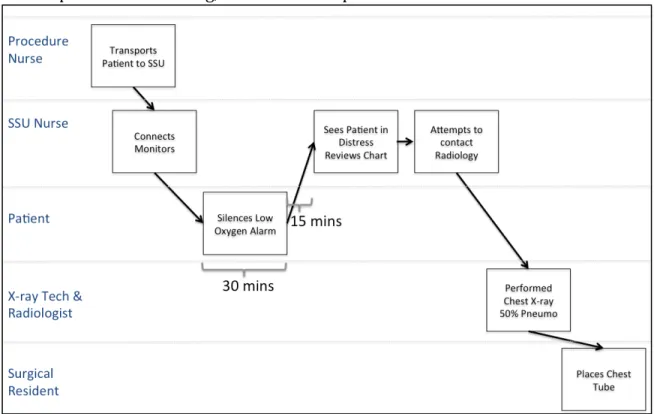
After a 15-‐minute delay in transport, the patient was taken back to SSU, and monitors were reattached. In the next 30 minutes, no staff directly checked on the patient. During that time,
the pulse oximeter alarmed “low oxygen” repeatedly, but the patient began to silence the alarm as he previously had learned to do. The patient was surprised that he had right-‐sided chest pain with inspiration but he did not inform his nurse. He had rationalized this pain as a transient problem that would soon disappear.
Fifteen minutes later, the nurse noticed A.B. silencing the alarm and grimacing. After checking vital signs, viewing his pulse oximeter and looking at the chart, she requested a follow-‐up chest X-‐ray to be done ASAP. She also called the interventional radiologist. Blood pressure, heart rate, and respiratory rate were all elevated. The radiology notes in the chart were impossible to read, and she remembered that the resident usually dictated procedure notes.
The chest X-‐ray now showed a 50% pneumothorax. A thoracic surgery resident was called, and he inserted a chest tube to re-‐expand the right lung. The chest tube remained in place for 3 days due to a persistent air leak. The patient was discharged home 4 days after the biopsy procedure.
Immediate Actions:
1) An X-‐Ray was taken. 2) A chest tube was placed.
3) Patient was cared for with IV fluids, pain medications, and watched closely with a cardiac monitor and pulse oximeter.
4) The records kept in the radiology department were copied. 5) The pulse oximeter was sent to clinical engineering for testing.
6) The Facility Director was told about the case on 11/2/99 (24 hours after the event).
Other Useful Data:
1) Patients are usually evaluated every 5 minutes after a procedure with continuous pulse oximetry.
2) The pulse oximeter was found to have no malfunctioning parts. 3) The SSU was a new concept for this VA facility (2 months old). 4) The patient signed a consent form.
Source:
VA Root Cause Analysis Training Instructors Guide [23]