Molecular Microbiology (2004) 51(3), 659–674 doi:10.1046/j.1365-2958.2003.03865.x
© 2003 Blackwell Publishing Ltd
Blackwell Science, LtdOxford, UKMMIMolecular Microbiology1365-2958Blackwell Publishing Ltd, 2003513659674Original ArticleMature biofilm formation in E. coliC. Beloin et al
.
Accepted 7 October, 2003. *For correspondence. E-mail jmghigo@ pasteur.fr; Tel. (+33) 1 40 61 39 17; Fax (+33) 1 40 61 39 70.
Global impact of mature biofilm lifestyle on
Escherichia
coli
K-12 gene expression
Christophe Beloin,1 Jaione Valle,2
Patricia Latour-Lambert,1 Philippe Faure,3 Mickaël Kzreminski,1 Damien Balestrino,4 Janus A. J. Haagensen,5 Søren Molin,5 Gérard Prensier,6 Brigitte Arbeille7 and Jean-Marc Ghigo1*
1Groupe de génétique des biofilms – CNRS URA 2172,
Institut Pasteur, 25 rue du Dr Roux, 75724 Paris Cedex 15, France.
2Instituto de Agrobiotecnologia y Recursos Naturales,
Universidad Publica de Navarra, Pamplona-31006, Navarra, Spain.
3Unité récepteurs et cognition, Institut Pasteur, 25 rue du
Dr Roux, 75724 Paris Cedex 15, France.
4Laboratoire de Bactériologie, Faculté de Pharmacie,
Université d’Auvergne, 28, place Henri Dunant, 63001 Clermont-Ferrand, France.
5Molecular Microbial Ecology Group BioCentrum-DTU,
Technical University of Denmark, DK-2800 Lyngby, Denmark.
6Université Blaise Pascal, Complexe scientifique des
Cézeaux, Laboratoire de Biologie des Protistes et Microscopie, 63177 Aubière Cedex, France.
7Laboratoire de Biologie Cellulaire et Microscopie
Electronique, UFR Médecine, 37032 Tours Cedex, France.
Summary
The formation of biofilm results in a major lifestyle switch that is thought to affect the expression of mul-tiple genes and operons. We used DNA arrays to study the global effect of biofilm formation on gene expression in mature Escherichia coli K-12 biofilm. We show that, when biofilm is compared with the exponential growth phase, 1.9% of the genes showed a consistent up- or downregulation by a factor greater than two, and that 10% of the E. coli genome is sig-nificantly differentially expressed. The functions of the genes induced in these conditions correspond to stress response as well as energy production, enve-lope biogenesis and unknown functions. We provide
evidence that the expression of stress envelope response genes, such as the psp operon or elements of the cpx and rpoE pathways, is a general feature of
E. coli mature biofilms. We also compared biofilm with the stationary growth phase and showed that the bio-film lifestyle, although sharing similarities with the stationary growth phase, triggers the expression of specific sets of genes. Using gene disruption of 54 of the most biofilm-induced genes followed by a detailed phenotypic study, we validated the biological rele-vance of our analysis and showed that 20 of these genes are required for the formation of mature bio-film. This group includes 11 genes of previously unknown function. These results constitute a com-prehensive analysis of the global transcriptional response triggered in mature E. coli biofilms and pro-vide insights into its physiological signature.
Introduction
Surface-attached, matrix-enclosed bacterial communi-ties, called biofilms, cause serious economic and health problems because of biofilm-associated phenotypes such as antibiotic resistance or biofouling (Costerton
et al., 1999). The drastic phenotypical changes seen in
biofilms led to the assumption that the physiological modifications necessary for planktonic bacteria to adopt the biofilm lifestyle must involve specific responses. Glo-bal expression analysis comparing either protein or tran-scription profiles in Pseudomonas planktonic and biofilm bacterial cultures suggested that a large number of genes could be differentially regulated during biofilm
development (Sauer and Camper, 2001; Whiteley et al.,
2001; Sauer et al., 2002). In Escherichia coli, the use of DNA array technology to compare the expression pro-files between planktonic cells and young biofilms showed recently that, beyond genes involved in adhe-sion events, several novel gene clusters are specifically induced during the early stages of biofilm formation
(Schembri et al., 2003). These pioneering studies
opened the way to the genetic characterization of the biofilm phenotype. However, although the early events of biofilm formation are well documented, extracting func-tional information from genomic approaches remains a challenge (Sauer, 2003). In particular, the nature of the physiological changes and critical regulatory processes
660 C. Beloin et al.
occurring inside the aged, mature biofilm is still poorly understood (Ghigo, 2003).
Whereas E. coli K-12 does not spontaneously form
extensive biofilms, it was shown previously that the expression of pili from conjugative plasmids, which are widespread in natural bacterial populations, promotes the development of thick, mature biofilms (Ghigo, 2001;
Reis-ner et al., 2003). This raised the possibility of studying the
genetic basis of the mature biofilm phenotype in a widely used bacterial model in which expression profiling can be combined with the phenotypic analysis of a large set of deletion mutants.
In order to identify the physiological responses taking place inside mature biofilm, we investigate the global tran-scriptional differences between E. coli K-12 mature biofilm and planktonic cultures. We validated our expression pro-filing approach by the systematic inactivation of the most biofilm-induced genes followed by a detailed analysis of their biofilm phenotypes. This functional profiling led us to assign a biofilm-related function to 20 genes. We showed that the expression of stress response genes is a general feature of E. coli biofilms, and we investigated the role of these genes in biofilm formation and architecture. This global transcription analysis of mature E. coli biofilms provides cues to the genetic events underlying the phe-notypic changes that characterize the biofilm mode of growth.
Results
Production of mature E. coli biofilms
The capacity of different E. coli K-12 strains to form mature biofilms was tested in M63B1 glucose minimal medium in a microfermenter-based continuous flow cul-ture system (Ghigo, 2001). Most of the strains tested formed only thin biofilms after 2–5 days. However, high biomass and thick biofilm production (>200 mM) was reproducibly achieved using E. coli TG1, a strain carrying the F conjugative plasmid previously shown to promote biofilm formation (Ghigo, 2001; Reisner et al., 2003). To identify E. coli genes that are differentially expressed in mature biofilms, we compared 8-day-old TG1 biofilms with late exponential TG1 planktonic (OD = 0.6) or stationary phase cultures (OD = 3). Whereas in agitated flask and planktonic culture conditions, no surface adhesion was observed, a significant amount of contaminating biofilm formation occurred in planktonic TG1 continuous cultures grown in fermenters. This led us, in the main experiment described in this study, to compare planktonic cultures grown in agitated flasks with TG1 biofilms grown in fer-menters. However, differential gene expression between planktonic and biofilm bacteria both grown in fermenters was also investigated (see Discussion).
Biofilm formation has a global impact on gene expression when compared with exponential growth phase
Total RNAs were isolated from independent biofilm and exponential growth phase cultures and subjected to a
stringent expression profiling procedure using E. coli
membrane DNA macroarrays. Data were subjected to a Wilcoxon rank test. The expression pattern and predicted function of differentially expressed genes are summarized in Fig. 1 and in the Supplementary material (Fig. S1). In biofilms, 250 genes (5.8%) were overexpressed (P< 0.05, 82% of them with P< 0.005), whereas 188 genes (4.4%)
were underexpressed (P<0.05, 85% of them with
P< 0.005). This indicates that 10.2% of the E. coli genome is differentially expressed in TG1 biofilm at a statistically significant level (Supplementary material, Fig. S1 and Tables S1 and S2). Among these identified genes, 1.9% were up- or downregulated by a factor of twofold or more. The most significant classes of biofilm-induced genes when compared with the planktonic exponential growth phase either by level of overexpression or by number are (i) genes involved in cellular processes such as envelope stress responses (pspABCDE, cpxP, spy, rpoE, rseA,
rseB) and stress (recA, dinI) as well as cell envelope biogenesis and transport (fimA, tatE); (ii) genes involved in energy (cyoD, sucA, sixA, nifU) and carbohydrate met-abolic functions (rbsB, lamB); and (iii) genes of unknown function (48%) (Fig. 1).
The main classes of repressed genes include genes involved in amino acid, carbohydrate transport and inor-ganic ion transport and genes of unknown function (Fig. S1 and Table S2). In the rest of this study, we focus on genes that were found to be the most overexpressed
in E. coli biofilms. The role and significance of the
repressed functions will be reported elsewhere.
Both stationary phase and biofilm-specific genes are expressed in mature biofilms
Mature biofilms constitute heterogeneous environments in which bacteria grow at different rates. This heterogeneity is proposed to be mostly dependent on nutrient availability and depth-related conditions created within the biofilm. We wished to determine to what extent the genes identi-fied above were truly biofilm specific or, instead, a conse-quence of the stationary phase-like conditions prevailing in the mature biofilm. Total RNAs were isolated from inde-pendent stationary phase planktonic cultures, subjected to the expression profiling procedure and compared with biofilm profiling (complete comparison available at http://www.pasteur.fr/recherche/unites/Ggb/biovsstat.html). Among the 64 genes found to be the most induced in
biofilm versus exponential phase (≥twofold ratio, see
Mature biofilm formation in E. coli 661
when compared with stationary phase (Table 1). This sug-gests that these 39 genes are not biofilm specific but may, instead, reflect the stationary phase-like growth conditions within the mature E. coli biofilm.
In contrast, the remaining genes (39%, 25/64) were also overexpressed in biofilm versus stationary growth phase, 24 of which with a ratio ≥2, thus defining a set of
biofilm-specific genes (Table 1 and Supplementary material,
Table S3).
Validation of the macroarray data
Several approaches were used to validate the data issued from transcriptional profiling experiments. We checked the correlation between expression data and operon structure
in E. coli. An analysis restricted to the genes with known
function found to be induced by at least a twofold factor in biofilm compared with exponentially grown cells showed that 51% of them (21/41) were predicted to be included in 14 different operons, using the EcoCyc database (http:/
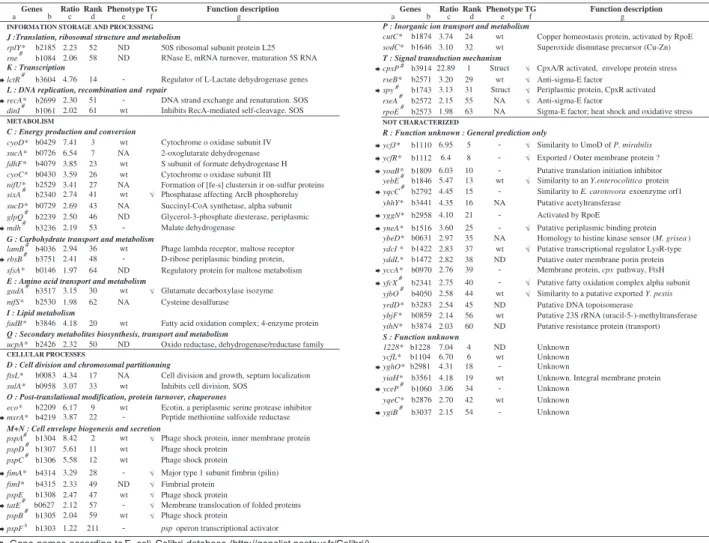
/ecocyc.org/). For 10 of these 14 operons, we identified at least two members of the operon with expression that was induced in biofilms compared with exponentially grown cells. Furthermore, in order to verify the expression level changes, we then performed a quantitative reverse tran-scription polymerase chain reaction analysis (Q-RT-PCR) on a selection of the biofilm growth-regulated genes. Q-RT-PCR was performed for seven of the most biofilm-induced genes compared with exponentially grown cells (cpxP, ycfJ, ycfR, yebE, cyoD, sucA and fimA; see Fig. 1 and Table 1). Figure 2 shows a good correlation between the data obtained by the two different techniques (r = 1.12).
These results indicate both good internal consistency of our macroarray data as well as good correlation between our analysis and actual mRNA levels, as deter-mined experimentally by Q-RT-PCR. To extract further functional information from our DNA array data, we then wished to analyse the biofilm-related phenotypes of isogenic mutants of the identified biofilm-induced genes.
Fig. 1. Function of genes overexpressed in TG1 biofilm versus exponential growth phase. This figure summarizes the data presented in Table S1
(Supplementary material). The genes have been classified according to the COG functional categories annotation system. Large and medium
size numbers indicate the total number of E. coli biofilm-induced genes in each class or subclass of indicated functions. Genes are indicated only when their expression level in biofilm differed by at least a factor of twofold (≥ 2). Numbers within brackets indicate the rank as overexpressed genes; 1 = most expressed gene in TG1 E. coli biofilm.
Translation, ribosomal structure and metabolism lctR-[14] 10 DNA replication, recombination and repair recA-[51] dinI-[61]
Information storage
and
processing
26
Transcription 11 rplY-[52] rne-[58] 5 lamB-[36] rbsB-[48]60
Carbohydrate transport and metabolism 3 Coenzyme metabolism 16 cyoD-[3] sucA-[7] fdhF-[23] cyoC-[26] nifU-[27] sixA-[41] sucD-[43] glpQ-[46] mdh-[53] Energy production and conversion 23 ucpA-[50] Secondary metabolites biosynthesis 2 fadB-[20] Lipid metabolism 7 gadA-[30]Amino acid transport and metabolism 9
Metabolism
cutC-[24] sodC-[32] 8 Post-translational modification, protein turnover, chaperones12 ftsL-[17] sulA-[33] eco-[9] msrA-[22] 2 cpxP-[1] rseB-[29] spy-[31] rseA-[55] Signal transduction mechanism 5 pspA-[2] pspD-[11] pspC-[12] fimA-[28] fimI-[49] pspE-[47] tatE -[57] pspB-[59] Cell envelope biogenesis and secretion
18
Cellular processes
45
Cell division and chromosomal partitioning
Unknown
b1228-[4] ycfL-[6] yghO-[18] yiaH-[19] yceP-[34] yqeC-[42] ygiB-[54] Function unknown 67 ycfJ-[5] ycfR-[8] yoaB-[10] yebE-[13] yqcC-[15] yhhY-[16] yggN-[21] yneA-[25]General prediction only
52
Inorganic ion transport and metabolism ybeD-[35] ydcI[37] yddL-[38] yccA-[39] yfcX-[40] yjbC-[44] yrdD-[45] ybjF-[56] yihN-[60]
119
662 C. Beloin et al.
Functional profiling of E. coli biofilms: 20 biofilm-induced
genes are involved in mature biofilm development
Among genes significantly induced in TG1 biofilms (compared with planktonic exponential growth phase cells), 64 genes were found to be overexpressed by at least a factor of two (Table 1). To test directly the contri-bution of these genes to biofilm development, we deleted 23 of the 25 genes that were overexpressed in biofilms compared with both planktonic phases (biofilm-specific genes) as well as 31 of the 39 genes that were only induced in biofilms versus exponential growth
phase. Mutations in sixA, sucA, yfhN (nifU), yfhO (nifS),
ybeD, yhhY, rpoE and rseA impaired growth in M63B1 glucose minimal medium (data not shown). Mutants in these genes, along with ftsL, an essential cell division gene, could not be meaningfully tested for biofilm forma-tion and were therefore excluded from further biofilm analysis. rpoE is an essential gene in which mutations can be suppressed by extragenic mutations (De Las Penas et al., 1997). Although our rpoE mutant did not exhibit full wild-type growth, we cannot exclude the appearance of such suppressor mutations in this mutant.
Table 1. Overexpressed genes (≥ 2) in E. coli TG1 and TG biofilms versus exponential growth phase.
a. Gene names according to E. coli Colibri database (http://genolist.pasteur.fr/Colibri/).
b. Gene names according to Blattner nomenclature (http://www.genome.wisc.edu/sequencing/k12.htm#gen). c. Ratio of gene expression in E. coli biofilm versus gene expression in planktonic exponential cultures. d. Rank position; 1 = the most overexpressed gene in E. coli biofilm.
e. Biofilm phenotype of the mutants: ND, not determined; NA, not applicable because of a growth defect in M63B1 glucose medium; wt, similar to wild type; –, biofilm reduced compared with wt; Struct, biofilm structure impaired compared with wt.
f. , genes also found to be significantly overexpressed in F minus E. coli strain TG. g. Function description according to E. coli Colibri database.
h. pspF was expressed by only a factor of 1.22 in TG1 biofilm but has been included for comparison with other members of the psp operon. Arrow, mutants affected for biofilm formation.
*Genes that were not induced in TG1 biofilm versus stationary phase.
#Genes that were also induced in TG1 biofilm versus stationary phase by at least a factor of two. These genes are also summarized in Table S3. The genes have been classified according to the COG functional categories annotation system used by the NCBI (http://www.ncbi.nlm.nih.gov/cgi-bin/COG).
Ratio Rank Phenotype TG Function description
c d e f g
INFORMATION STORAGE AND PROCESSING
2.23 52 ND 50S ribosomal subunit protein L25 2.06 58 ND RNase E, mRNA turnover, maturation 5S RNA
K : Transcription
4.76 14 - Regulator of L-Lactate dehydrogenase genes 2.30 51 - DNA strand exchange and renaturation. SOS 2.02 61 wt Inhibits RecA-mediated self-cleavage. SOS
cyoD* b0429 7.41 3 wt Cytochrome o oxidase subunit IV 6.54 7 NA 2-oxoglutarate dehydrogenase 3.85 23 wt S subunit of formate dehydrogenase H 3.59 26 wt Cytochrome o oxidase subunit III
3.41 27 NA Formation of [fe-s] clustersin ir on-sulfur proteins 2.74 41 wt Phosphatase affecting ArcB phosphorelay 2.69 43 NA Succinyl-CoA synthetase, alpha subunit 2.50 46 ND Glycerol-3-phosphate diesterase, periplasmic 2.19 53 - Malate dehydrogenase
2.94 36 wt Phage lambda receptor, maltose receptor 2.41 48 - D-ribose periplasmic binding protein, 1.97 64 ND Regulatory protein for maltose metabolism 3.15 30 wt Glutamate decarboxylase isozyme 1.98 62 NA Cysteine desulfurase
4.18 20 wt Fatty acid oxidation complex; 4-enzyme protein 2.32 50 ND Oxido reductase, dehydrogenase/reductase family
4.34 17 NA Cell division and growth, septum localization
sulA* b0958 3.07 33 wt Inhibits cell division. SOS
6.17 9 wt Ecotin, a periplasmic serine protease inhibitor 3.87 22 - Peptide methionine sulfoxide reductase 8.42 2 wt Phage shock protein, inner membrane protein 5.61 11 wt Phage shock protein
5.58 12 wt Phage shock protein
3.29 28 - Major type 1 subunit fimbrin (pilin) 2.33 49 ND Fimbrial protein
2.47 47 wt Phage shock protein
b0627 2.12 57 - Membrane translocation of folded proteins 2.04 59 wt Phage shock protein
1.22 211 - psp operon transcriptional activator
3.74 24 wt Copper homeostasis protein, activated by RpoE 3.10 32 wt Superoxide dismutase precursor (Cu-Zn) 22.89 1 Struct CpxA/R activated, envelope protein stress
3.20 29 wt Anti-sigma-E factor
3.13 31 Struct Periplasmic protein, CpxR activated 2.15 55 NA Anti-sigma-E factor
1.98 63 NA Sigma-E factor; heat shock and oxidative stress
6.95 5 - Similarity to UmoD of P. mirabilis 6.4 8 - Exported / Outer membrane protein ? 6.03 10 - Putative translation initiation inhibitor
J :Translation, ribosomal structure and metabolism
M+N : Cell envelope biogenesis and secretion
ftsL* b0083
C : Energy production and conversion
G : Carbohydrate transport and metabolism
E : Amino acid transport and metabolism
Q : Secondary metabolites biosynthesis, transport and metabolism
sucA* b0726 Genes
a b
Ratio Rank Phenotype TG Function description
c d e f g Genes a b b4079 cyoC* b0430 dinI# b1061 b3604 rne# b1084 rplY* b2185 nifU* b2529 METABOLISM
L : DNA replication, recombination and repair
lctR# fdhF* recA* b2699 sixA# b2340 sucD* b0729 glpQ# b2239 mdh# b3236 lamB# b4036 b3846 nifS* b2530 rbsB# b3751 gadA# b3517 sfsA* b0146 b2426
D : Cell division and chromosomal partitionning
msrA* b4219 eco* b2209
O : Post-translational modification, protein turnover, chaperones I : Lipid metabolism fadB* pspA# b1304 pspD# b1307 pspC# b1306 fimA* b4314 b1303 pspE b1308 pspB# b1305 pspFh tatE# spy# b1743 cpxP# b3914 rseA# b2572 rpoE# b2573 ycfJ* b1110 ycfR* b1112 yoaB* b1809 NOT CHARACTERIZED
R : Function unknown : General prediction only
sodC* b1646
cutC* b1874
ucpA*
P : Inorganic ion transport and metabolism
CELLULAR PROCESSES
b4315
fimI*
T : Signal transduction mechanism
rseB* b2571
5.47 13 wt Similarity to an Y.enterocolitica protein 4.45 15 - Similarity to E. carotovora exoenzyme orf1 4.35 16 NA Putative acetyltransferase
4.10 21 - Activated by RpoE
3.60 25 - Putative periplasmic binding protein 2.97 35 NA Homology to histine kinase sensor (M. grisea ) 2.83 37 wt Putative transcriptional regulator LysR-type 2.82 38 ND Putative outer membrane porin protein 2.76 39 - Membrane protein, cpx pathway, FtsH 2.75 40 - Putative fatty oxidation complex alpha subunit 2.58 44 wt Similarity to a putative exported Y. pestis 2.54 45 ND Putative DNA topoisomerase
2.14 56 wt Putative 23S rRNA (uracil-5-)-methyltransferase 2.03 60 ND Putative resistance protein (transport)
yebE# b1846 yqcC# b2792 yhhY* b3441 yggN* b2958 b1516 b1472 yccA* b0970 ybeD* b0631 ydcI * b1422 yrdD* b3283 yfcX# b2341 yjbO# b4050 yddL* yneA* yihN* b3874 ybjF* b0859 b1228 7.04 4 ND Unknown b1104 6.70 6 wt Unknown b2981 4.31 18 - Unknown
4.18 19 wt Unknown. Integral membrane protein
3.06 34 - Unknown 2.70 42 wt Unknown 2.15 54 - Unknown S : Function unknown ygiB# b3037 yiaH* b3561 yceP# b1060 1228* yqeC* b2876 ycfL* yghO*
Fig. 2. Correlation of macroarray and quantitative real-time PCR
results. The calculated macroarray and Q-RT-PCR ratios of the expression of seven genes in TG1 biofilm relative to exponential growth phase were log2 transformed, and values were plotted against each other to evaluate their correlation. The correlation coefficient was deduced from a linear regression of the plotted values.
cpxP sucA ycfJ fimA yebE cyoD ycfR 0 1 2 3 4 5 0 1 2 3 4 5
log2 ratio macroarray
log
2
ratio r
eal-time
PCR
The ability to form a mature biofilm within 24 h was assessed for each mutant and compared with TG1. Both macroscopic biofilm development in microfermenters and biofilm cell density after dispersion of the biofilm grown on the removable glass slide of the fermenter were exam-ined. Twenty mutants displayed a reduced biofilm pheno-type (see Table 1, Fig. 3 and Supplementary material, Fig. S2). Eight of the mutants with reduced biofilm biom-ass correspond to genes of known function: fimA, msrA,
rbsB, mdh, lctR, tatE, recA and cpxP.
fimA, msrA, rbsB and mdh are genes encoding
pro-teins that have already been linked to biofilm formation or adhesion properties (see above). As expected, adhe-sion appeared to be a key factor in TG1 biofilm forma-tion. Indeed, fimA encodes for the major subunit of type I fimbriae, a known initial adhesion factor (Klemm and Christiansen, 1987), the role of which in biofilm forma-tion has been demonstrated previously (Cormio et al., 1996; Austin et al., 1998; Pratt and Kolter, 1998; Watnick
et al., 1999; Cookson et al., 2002). In contrast to our
results, Reisner et al. (2003) showed recently that a fimA mutation had no effect on the development of biofilms formed in flow chambers by an F plasmid-bearing E. coli strain. Differences in strain, medium and biofilm growing system used might account for this discrepancy. msrA
Fig. 3. Biofilm phenotype of selected deletion mutants. Mature biofilm development of E. coli TG1 (wt) compared with a selection of deletion
mutants of genes overexpressed in TG1 biofilm.
A. For each mutant phenotype analysis, the extent of biofilm formation is shown in the bottom part of the microfermenter and on the removable glass slide. A typical experiment is shown.
B. Graphical comparison of biofilm formation relative to wild type from the mutants presented in (A). Data represent the average of three independent experiments for each mutant. The level of biofilm formed by wt TG1 biofilm was set to 100%.
A
B
wt fimA tatE recA msrA
0 25 50 75 100 125 150
Biofilm formation ratio (%)
wt fimA tatE recA msrA
664 C. Beloin et al.
encodes a peptide methionine sulphoxide reductase (MsrA), a repair enzyme that contributes to the mainte-nance of adhesins in Streptococcus pneumoniae,
Neis-seria gonorrhoeae, E. coli (Wizemann et al., 1996) and Mycoplasma genitalium (Dhandayuthapani et al., 2001),
which could explain the alteration in biofilm formation in the msrA mutant.
The biofilm lifestyle leads to a profound modification of energy metabolism as judged by the identification of
mdh, rbsB and lctR as biofilm-induced genes. The rbsB
and mdh genes have already been identified as being overexpressed in biofilms formed by pathogenic E. coli (Tremoulet et al., 2002). rbsB is part of the rbsDACBK operon that encodes high-affinity transport of and chemotaxis towards D-ribose (rbsC and rbsD are also induced in biofilms; see Supplementary material, Table S1). mdh encodes malate dehydrogenase, an enzyme of the TCA cycle. The lctR gene encodes for a regulator of L-lactate dehydrogenase. Furthermore, sev-eral sugar metabolism/transport systems are activated in biofilm (maltose transport, glycerol metabolism and uptake, galactose-binding proteins, see Supplementary
material, Table S1).
Our results also suggest that mature E. coli biofilm formation might require Tat-dependent secretion of a spe-cific set of proteins. Indeed, tatE is proposed to be involved in the twin-arginine cell envelope protein trans-port system (Chanal et al., 1998). In Pseudomonas
aeruginosa, tatA and tatB, encoding components of this
secretion system, have been shown to be induced in biofilms (Whiteley et al., 2001), whereas tatC has been shown to be required for biofilm formation (Ochsner et al., 2002).
We also observed a defect in mature biofilm formation in a recA mutant (Fig. 3). This underlines the impor-tance of stress responses in E. coli TG1 biofilm. Consis-tent with this result, several stress response genes are overexpressed in TG1 biofilm (SOS response: dinI,
dinP, dinG, sbmC, recN, sulA; general stress: rpoS;
chaperones: dnaJ and dnaK; heat shock proteins: htpX,
htpG and ddg; DNA repair: exo, xthA; and envelope
stress: see below and Supplementary material, Table S1). cpxP and spy are both linked to envelope stress response (Connolly et al., 1997; Danese and Sil-havy, 1997; Raivio and SilSil-havy, 2001) and will be inves-tigated below.
We could also assign a biofilm-related function to 11 genes of previously unknown function (ycfJ, ycfR,
yoaB, yqcC, yggN, yneA, yccA, yfcX, yghO, yceP and ygiB). YfcX may be required for fatty acid utilization as
a carbon source in anaerobic conditions (Campbell
et al., 2003). Among these 11 genes, five encode
putative extracytoplasmic proteins (ycfJ, ycfR, yqcC,
yneA, yccA). YcfJ is homologous to UmoD of Proteus mirabilis, a protein that negatively regulates the flhDC
flagellar and swarming master operon (Dufour et al., 1998). yccA is a putative cpx regulon member (De Wulf et al., 2002) encoding a protein of unknown func-tion, but it has been shown to be a substrate for the membrane protease FtsH (Kihara et al., 1998). Among the mutants lacking any one of these five putative
extracytoplasmic proteins, DycfJ and DyccA were the
most affected for mature biofilm formation, with a reduction of about 50% compared with wild-type strain TG1 (Fig. S2).
To investigate the biofilm-related role of these two putative membrane proteins further and to confirm their importance in mature biofilm formation, we genetically introduced the green fluorescent protein (GFP) gene into the wild-type strain TG1 and in the mutant strains
TG1DycfJ and TG1DyccA. This allowed us to compare
biofilm formation between TG1gfp and TG1gfpDycfJ and
TG1gfpDyccA in continuous flow chamber cultures,
another well-established experimental model that is a non-invasive means of observing where the spatial arrangement of the cells is preserved. This experimen-tal system allows the quantitative, real-time monitoring of biofilm architecture development using confocal laser
scanning microscopy and COMSTAT analysis (Heydorn
et al., 2000) (Fig. 4). Initial adhesion of the two ycfJ and yccA mutants was not affected, as measured by
sub-strate coverage and biomass analysis. However, the maturation of the biofilm formed by these two mutants was greatly delayed, especially for the yccA mutant. Indeed, in the yccA mutant, the accumulated biomass remained very low over time, and typical biofilm mush-room structures appeared only sporadically and much later compared with wild-type strain TG1 (see Fig. 4). This suggests a role for YcfJ and YccA proteins in bio-film maturation.
These results demonstrate the involvement in mature biofilm formation of 30% (20 genes) of the most highly
Fig. 4. Functional profiling of E. coli biofilm: flow chamber analysis.
A. Spatial distribution of biofilm formation for E. coli TG1 and selected TG1 deletion mutants expressing Gfp. Biofilms were grown in flow chambers. Biofilm development was monitored by SCLM at the indicated times after inoculation (20 h, 45 h, 70 h, 95 h). Micrographs represent simulated three-dimensional images. Images inset into 70 h and 95 h of ycfJ correspond to a rare area in which the biofilm was more developed. B. COMSTAT analysis of biofilm structures. Diagrams and standard deviations (numbers indicated in the individual columns) of biomass and substrate coverage from biofilms of E. coli TG1 and TG1 deletion mutants were determined by the COMSTAT program at four different time points (20 h, 45 h, 70 h, 95 h). Values are means of data from 12 image stacks (six image stacks from two independent channels). The biomass is in the units mm3
expressed genes identified in our study. Fifty per cent of these genes (10/20) were induced in biofilm versus both exponential and stationary growth phase (cpxP, spy, tatE,
lctR, mdh, rbsB, ygiB, yqcC, yceP and yfcX), whereas the
other 50% (10/20) were only induced in biofilm versus exponential growth phase (fimA, msrA, recA, yoaB, ycfJ,
ycfR, yneA, yccA, yggN and yghO) (see Table 1 and Sup-plementary material, Table S3).
A
B
wt
ycfJ yccA
cpxP
cpxR
20 H
45 H
70 H
95 H
Substrate Coverage
Biomass
Biomass (
µ
m /
µ
m )
2 3Time (h)
20 45 7095 0 5 10 15 20 25Strain
wt ycfJ yccA cpxP cpxR wt ycfJ yccA cpxP cpxR 0 0.1 0.2 0.3 0.4 0.5 0.6 0.7 0.8 0.9Time (h)
20 45 7095Strain
Substrate Co
verage
(r
elative
unit)
0.01 4.39 8.11 4.33 0.05 0.13 0.13 11.6 0.08 0.18 0.16 0.18 0.25 0.93 0.54 0.76 0.14 0.11 0.06 0.02 0.04 0.09 0.02 0.02 0.02 0.03 0.11 0.02 0.02 0.05 0.010.02 0.08 0.13 0.06 0.09 0.08 0.03 0.030.03666 C. Beloin et al.
Biofilm-induced genes are not involved in the early stage of biofilm formation
Failure to form a wild-type mature biofilm could result from an initial adhesion defect. Therefore, we investigated whether the genes identified as overexpressed in mature TG1 biofilms and that impaired mature biofilm formation when mutated were also involved in the early adhesion steps. For this, we tested these mutants in a static microti-tre plate-based assay that has been used widely to study the first steps in biofilm formation (Genevaux et al., 1996; O’Toole et al., 1999). With the exception of fimA, the early adhesion capacity of the mutants could not be distin-guished from the parental strain (Supplementary material, Fig. S3). This result indicates that most genes overex-pressed in mature biofilms are not involved in the early steps of this process and confirms that they participate in mature biofilm functions.
Comparison of E. coli F+/F– biofilm global response:
general relevance to E. coli biofilm
In this study, we used an E. coli strain carrying a conju-gative plasmid, a widespread situation that promotes bio-film formation (Ghigo, 2001; Reisner et al., 2003). To distinguish general features of E. coli biofilms from those specific to our model, we analysed the transcription profile of the E. coli strain TG, an F-free isogenic derivative of TG1. This control is of particular relevance because some of the genes found to be the most overexpressed (pspA,
cpxP) have been shown to be related to either the
conju-gation process (cpx stands for conjuconju-gation plasmid expression; McEwen and Silverman, 1980) or stress responses that could correlate with the expression of membrane appendages such as conjugative pili. TG forms a thin and fragile biofilm after 5 days of culture in microf-ermenters (data not shown). Total RNA was isolated from
E. coli TG biofilm and flask planktonic exponential cultures
and was subjected to the same macroarray analysis as described for TG1. TG1 and TG biofilms were not strictly comparable in terms of depth and structure (and there-fore, possibly, for biofilm-induced responses). As expected, some functions induced in TG1, for instance RecA and part of the SOS stress pathway, were not induced in TG (Table 1), suggesting that F-specific, pos-sibly transfer-related, responses are induced in TG1 bio-film. Despite this fact, 33% of the genes induced in TG1 biofilm by a factor of more than twofold were also found to be statistically significantly overexpressed in TG biofilm (including cpxP, rseA, rseB, spy, psp operon members,
tatE and fimA; see Table 1). This demonstrates that many
of the biofilm-induced genes identified in this study are F independent and part of a general E. coli K-12 biofilm response.
Envelope stress pathways in E. coli mature biofilm cpxP is one the most overexpressed genes in E. coli TG1
biofilms versus planktonic growth phase (Fig. 1, Table 1 and Supplementary material, Table S3). cpxP is a target of the cpx two-component system, which is known to respond to a variety of extracytoplasmic stress (envelope stress) (Raivio and Silhavy, 2001).
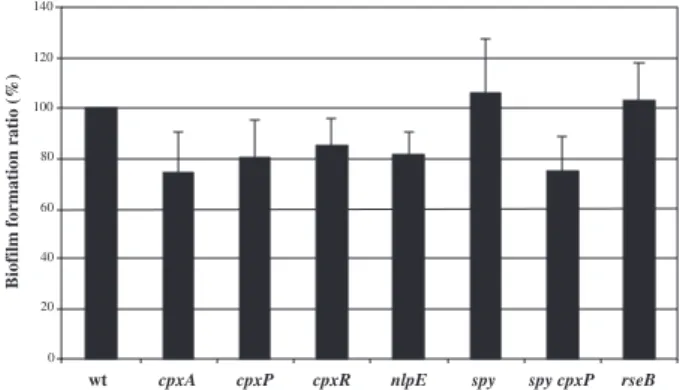
We therefore investigated the effect of deletion muta-tions in key components of the cpx pathway on biofilm formation. As shown in Fig. 5, inactivation of the sen-sor–regulator components of the cpx system (cpxA,
cpxR), but also of cpxP and nlpE, affected biofilm
for-mation in microfermenters. A mutation in spy (a biofilm-induced cpxP homologue) has no effect on biofilm biom-ass. rpoE and rseA mutants displayed a growth rate defect and, consequently, could not be studied in microf-ermenters. A mutation in rseB, the second antisigma E factor of the RpoE envelope stress pathway, did not affect growth, and an rseB mutant formed a wild-type biofilm. Whereas it is difficult to conclude that the rpoE pathway has a role in biofilm formation, the cpx pathway appears to contribute to biofilm development, based on the morphological effects caused by mutations in sev-eral of its key components. Indeed, the biofilms
pro-duced by both TG1DcpxR and TG1DcpxP in
microfermenters were very fragile compared with
wild-type TG1 biofilms. TG1DcpxP biofilm was made of large
plaques, in strong contrast to the homogeneous TG1 biofilm (Fig. 6A–C). Consistent with this observation, a detailed electron microscopy analysis revealed that a
cpxP mutation greatly altered biofilm macromorphology
(Fig. 6D and E). Despite its fragility, no clear structural defect could be detected in the TG1DcpxR biofilm (data not shown). Even though slight structural differences
could also be seen in the TG1Dspy mutant biofilms,
structural alterations were not found in nlpE, cpxA or
Fig. 5. A comparison of biofilm formation capacity of mutants in the
E. coli cpx and rpoE envelope stress pathways. Biofilm development
comparison of TG1 and TG1 deletion mutants in microfermenters. The average of at least four experiments was plotted in the histogram. The level of biofilm formed by wt TG1 biofilm was set to 100%.
0 20 40 60 80 100 120 140
wt cpxA cpxP cpxR nlpE spy spy cpxP rseB
rseB mutant biofilms grown in microfermenters (data not
shown).
To investigate further the role of cpxP and cpxR, we
introduced a gfp allele into TG1DcpxP and TG1DcpxR and
compared their biofilm formation with that of the parental TG1gfp strain in continuous flow chamber cultures. Single cells and very small colonies were observed on the sur-face for these two mutants during the initial steps of biofilm development in contrast to the wild type that forms normal three-dimensional colonies (Fig. 4, 20 and 45 h). Further-more, both cpxP and cpxR mutants were also strongly affected in maturation of the biofilm (Fig. 4). These exper-iments suggest that stress envelope pathways are involved in the establishment of a structured mature bio-film in E. coli.
Phage shock protein operon (psp) is expressed in response to a variety of environmental and intracellular stresses including processes related to protein insertion in the outer membrane (Weiner and Model, 1994). Although the precise functions of the psp genes are not understood, they help to ensure survival of E. coli in adverse conditions, suggesting that psp genes are part of a stress response operon (Model et al., 1997). In our analysis, pspA and other members of the operon
(pspB-CDE) were consistently overexpressed in biofilm (Fig. 1, Supplementary material, Tables S1 and S3).
Neverthe-less, the disruption of the pspABCDE operon did not have a major impact on early (Supplementary material, Fig. S3)
or late biofilm formation nor on biofilm structure (data not shown).
Discussion
In this study, we investigated the differences in gene expression between E. coli K-12 mature biofilm and plank-tonic laboratory cultures. Using DNA macroarrays, we showed that the biofilm lifestyle, while sharing similarities with the stationary growth phase, triggers the expression of specific sets of genes.
Modifications in E. coli K-12 gene expression induced by the biofilm lifestyle
The use of large-scale fusion technology had already suggested that a significant fraction of the bacterial genome could be involved in biofilm physiology (Prigent-Combaret et al., 1999). Accordingly, Pseudomonas putida and P. aeruginosa biofilm proteome analyses showed that a large number of genes are differentially regulated during biofilm development (Sauer and Camper, 2001; Sauer
et al., 2002). In contrast, a transcription profiling of the P. aeruginosa planktonic and biofilm phases led to the
con-clusion that only 1% of P. aeruginosa genes display more than a twofold difference in gene expression (Whiteley
et al., 2001).
In E. coli, Schembri et al. (2003) showed recently that
Fig. 6. Phenotypic analysis of the structure of TG1 and TG1 DcpxP biofilms grown in a microfermenter.
A. General view of the bottom part of the fermenter.
B. Macroscopic biofilm grown on the internal glass slide, removed from the fermenter shown in (A). C. Close-up of the biofilm shown in (B).
D. Transverse section of TG1 and TG1 DcpxP biofilm.
668 C. Beloin et al.
ª 5–10% of the E. coli genes exhibited altered microarray expression profiles compared with planktonic growth phases and young biofilm cultures. They hypothesized that this could result from the rather early stages of biofilm development analysed in their study, where the still ongo-ing switch from planktonic to sessile growth could result in a high level of transient gene expression.
Here, we compared mature biofilms with the planktonic exponential growth phase and showed that, as in the case of mature P. aeruginosa biofilms, only a small fraction (1.9%) of the E. coli genes are differentially expressed by more than a factor of two. However, below that threshold, biofilm formation still leads to the statistically significant differential expression of >10% of the E. coli genome. These results therefore support the proposal that biofilm formation results in and from significant differences in the overall make-up of bacterial cells (Stoodley et al., 2002; Sauer, 2003).
Mature biofilm cells have been proposed to have sta-tionary growth phase traits such as reduced growth and metabolic activity. To investigate the stationary phase character of bacterial life within biofilm, we also compared the expression pattern of stationary phase cultures with those determined for the exponential growth phase and the mature biofilm. Biofilm-specific genes, i.e. genes dif-ferentially regulated in biofilm versus both forms of plank-tonic phases, correspond to 4% of the genome (118 over-and 53 underexpressed/4290), over-and this proportion
decreases to <1% (0.67%; 23 over- and six
underex-pressed/4290) for genes varying by a factor of more than two. When one only considers the genes induced in response to the stationary growth phase character of the biofilm lifestyle, these genes represent 3% of the genome. The biofilm lifestyle, while sharing similarities with the stationary growth phase, thus triggers the expression of specific sets of genes.
Functional profiling of the biofilm-induced genes
The biological importance of the differential gene expres-sion exhibited upon biofilm versus planktonic growth was tested by the disruption of the majority of the highly induced genes in biofilms, including all biofilm-specific induced genes. We show that, although the mutants were not impaired in initial steps of adhesion to surfaces (with the exception of fimA), a third of them (20 genes) were affected in biofilm maturation (Table 1, Figs 3 and S2). This high proportion of genes involved in biofilm matura-tion strongly supports the pertinence of our analysis. Among these 20 genes, half correspond to biofilm-specific genes, whereas the other half was only induced in biofilms versus exponential growth phase (see Tables 1 and S3). This indicates that the development of a full mature biofilm requires not only biofilm-specific genes but also genes
related to the stationary phase character of the biofilm. The individual role of some of these newly identified genes is currently being investigated.
Biofilm-related physiological functions
We show that genes found to be the most overexpressed in TG1 biofilm versus exponential growth phase were also part of the E. coli F-free biofilm response, therefore indi-cating that genes identified in this study are involved in the general response developed in mature E. coli K-12 biofilms. Those genes are not distributed randomly into all potential functional classes. Instead, they display a strong bias towards specific functional categories, and we pro-pose that they are part of the biofilm genetic signature. Genes with expression that is required for full maturation of TG1 biofilm belong to functions linked to adhesion (fimA, msrA), energy metabolism (rbsB, mdh, lctR), trans-port (tatE), general stress (recA) and envelope stress response (cpxP and spy). However, it is likely that many genes identified in our study are not specifically involved in biofilm-specific functions but, rather, correspond to adaptive responses to the biofilm environment. Mutations in many biofilm-induced genes that also correspond to information storage and processing, metabolism, cellular processes and unknown functions indeed have no effect on TG1 biofilm formation (Table 1).
Moreover, 48% of the genes significantly overexpressed in biofilms versus exponential growth phase were of uncharacterized function. Compared with 19.6% of such genes found in the E. coli genome (Serres et al., 2001), this high proportion of genes of unknown functions expressed in mature biofilm suggests that new aspects of
E. coli biology are adopted during biofilm formation. We
show that 11 of these uncharacterized genes are neces-sary for full mature biofilm formation, thus experimentally assigning them a biofilm-related function (Table 1, Figs 3 and S2). Among them, five encode putative membrane proteins that could be of particular relevance when con-sidering the importance of envelope-related physiology within a biofilm.
Consistent with the drastic phenotypical changes occur-ring inside biofilms, we found that 15% of the genes iden-tified as over- or underexpressed in biofilms versus exponential growth phase are involved in either energy processes or carbohydrate metabolism (Fig. 1, Tables 1 and S1). Despite the presence of polysaccharides in the TG1 biofilm (data not shown), we could not clearly asso-ciate the expression of any of those genes with the pro-duction of the biofilm matrix (i.e. cellulose, colanic acid). This could reflect, among other explanations, a lack of sensitivity of our approach as a result of the averaging occurring while extracting transcription information from the heterogeneous bacterial biofilm population.
A partial comparison of the most overexpressed genes in our analysis (by a factor of >twofold) and in the study by Schembri et al. (2003) (by a factor of >eightfold) only revealed a few genes identified as overexpressed in E.
coli biofilm in both studies (rbsB, b0836, yfjO, yceP, glgS, ydeW, yneA, yqeC, ylcC, rplV, rplD, rpsS, b1550, rplP, rpsR, flu, rplM, ppc, oppA, gatD, cydA, atpB, rpsN, malK, atpG). Three of these genes (rbsB, yceP, yneA) were
nevertheless also found here to be required for mature biofilm formation. This relatively low overlap between the two studies may result from technical differences. Differ-ent scenarios were used in terms of strain background, media and experimental setup. This could also reflect the difference in the gene expression pattern between two biofilms at very different stages of maturation [i.e. young and thin biofilms in Schembri et al. (2003) versus mature and thick biofilms]. Further studies comparing the expres-sion profile of E. coli biofilms at different maturation stages within the same experimental setup will provide a more dynamic view of biofilm gene expression.
Heterogeneity of oxygen conditions in E. coli K-12 biofilms
Biofilms are heterogeneous environments and, with respect to aerobiosis, our analysis supports these results. In the main experiment described in this study, we com-pared exponentially grown agitated flask cultures with TG1 biofilm in aerated conditions. Under these conditions, numerous genes known to be induced by aerobiosis were also induced in biofilms, including some genes for TCA cycle enzymes (e.g. aceB, cyo operon members, fadB,
mdh, glpD, sucAB). In addition, some genes known to be
repressed by aerobiosis were repressed in biofilms (e.g.
adhE, cydAB, dcuC, focA, fumB). This tends to indicate
that our biofilms were mainly grown under aerobic condi-tions. Consequently, we also compared differential gene expression between TG1 biofilms and TG1 planktonic cul-tures, both grown in aerated fermenters (data not shown). In this configuration, we clearly observed that some typi-cal aerobic genes were induced in biofilms, whereas oth-ers were repressed. This was also the case for typical anaerobic genes. This could reflect the heterogeneity of the aerobic conditions in biofilms, in which external bac-teria are in contact with oxygen while internal bacbac-teria are in conditions close to anaerobiosis.
Stress responses in biofilms
Our study revealed that a major physiological response to biofilm formation is the induction of stress responses. Interestingly, such a stress response induction may also take place in P. aeruginosa biofilms. Indeed, the most highly activated genes identified in a P. aeruginosa biofilm transcriptome analysis were those of temperate
bacte-riophages (Whiteley et al., 2001). As stresses are known to induce prophages and other mobile genetic elements, our results suggest that Pseudomonas prophage induc-tion may be a consequence of stresses created by the drastic conditions that prevail inside the biofilm. As such, stress may well be a key factor in the mechanisms that lead to the observed antibiotic resistance inside biofilm communities.
Owing to the possible role of cell–cell and cell–surface interactions in biofilm, it may be of significance that enve-lope stress genes such as cpxP, spy and the psp genes are consistently induced in this environment. CpxP may inhibit the cpx-mediated induction through a direct inter-action with the two-component system sensor CpxA, whereas Spy may play a similar role in the rpoE pathway (Raivio et al., 2000). The cpx system is known to respond to envelope stresses such as overproduction and misfold-ing of membrane proteins or elevated pH (Raivio and Silhavy, 2001). However, relatively little is known about the physiological role of envelope stress responses. Recently, adhesion of E. coli cells to hydrophobic but not hydrophilic surfaces was shown to activate the cpx system, including
cpxP, through a process called surface sensing, which
requires both cpxR and nlpE (Otto and Silhavy, 2002). Consistently, we find that cpxP and spy are highly induced in mature biofilms where bacteria are de facto in contact with the hydrophobic surfaces of other cells.
Our results thus provide additional experimental evi-dence that stress response pathways are key factors in biofilm formation. The structure of biofilms grown in micro-fermenters is altered in a cpxP mutant (Fig. 6) and, to a lesser extent, in a spy mutant. Observation of spy mutant biofilms by transmission electron microscopy also revealed a high proportion of spheroblasts compared with wild-type TG1 (data not shown), suggesting a possible cause for the affected structure of the biofilm in this mutant. In addition, a cpxP and a cpxR mutant are both impaired in forming wild-type microcolonies (Fig. 4). This strongly corroborates the idea that cpxP and cpxR mutants have reduced cell-to-cell adherence, as any growth up in the water column will be counteracted by the shearing forces of the flow. It appears, then, that the inappropriate expression of the cpx-regulated genes in biofilm, i.e. a derepression of the cpx regulon in the cpxP mutant or an absence of induction of the cpx regulon in the cpxR mutant, leads to an alteration in the process of biofilm formation. Considering the importance of environ-mental conditions in biofilm formation, two-component systems, which sense perturbations or changes in the bacterial environment, might play a regulatory role in bac-terial biofilm formation, a proposal that requires further investigation.
Our analysis identified the biofilm mode of growth as an environment that induces the expression of the
pspAB-670 C. Beloin et al.
CDE stress operon. However, no biofilm-related
pheno-type could be observed in a strain deleted for the
pspABCDE operon. Nevertheless, the deletion of pspF, a
constitutively expressed positive regulator of the
pspAB-CDE operon, affects biofilm formation (Fig. S2). As psp-ABCDE is not required for biofilm formation, pspF might
also regulate a biofilm-related locus that is not part of
pspABCDE operon. Evidence for such an additional
PspF-regulated target has been provided in the case of the Yersinia enterolitica psp regulon (Darwin and Miller, 2001).
Changes in gene expression and biofilm development
The changes in gene expression demonstrated here and in other studies could be considered as either part of the
E. coli biofilm development (needed for maturation) or
caused by the conditions progressively created within the biofilm during its maturation (consequence of the matura-tion). The first hypothesis implies that biofilm formation is a developmental process in which genetic checkpoints could control the maturation of the biofilm by inducing a succession of biofilm-specific genes. Whereas eight muta-tions out of 54 mutants created in this study display a 50% decrease in biofilm biomass and maturation, none of them leads to a total loss of biofilm formation. Considering the existence of multiple and partially overlapping or comple-menting pathways that can lead to biofilm formation, this
result, without formally excluding the existence of a biofilm developmental programme, rather speaks in favour of the second working hypothesis. In this case, most changes observed in biofilm gene induction could be a conse-quence of, rather than a prerequisite for, biofilm maturation.
The results presented here provide new insights into the global effect triggered by biofilm formation in E. coli. By monitoring the changes in gene expression occur-ring in mature biofilms, we have identified biofilm-related physiological pathways and previously uncharac-terized biofilm-induced genes. This may lead to new biofilm control strategies that will probably hinge upon a better understanding of biofilm-induced physiological responses.
Experimental procedures
Bacterial strains and culture conditions
Bacterial strains used in this work are described in Table 2. All experiments were performed in 0.4% glucose M63B1 minimal medium at 37∞C except flow chamber experiments, which were performed at 30∞C in 0.02% glucose FAB minimal medium. Proline was added at 400 mg ml-1 for TG growth. Early adhesion and biofilm formation assay
Microtitre plate assays were performed as described by
Table 2. Strains and plasmids used in this study.
Strain/plasmid Relevant characteristics Reference/source
E. coli strains
PAP6181 K1519pspF::miniTn10 (TetR) Jovanovic et al. (1996)
PHL904 cpxA:: Wcat (CmR) Dorel et al. (1999)
RG075 MG1655DmsrA::WSpec (SpecR
) A gift from F. Barras
STC27 fimA1::cat (CmR
) Pratt and Kolter (1998)
TG1 F¢[traD36 proAB + lacIq lacZ
DM15] Laboratory collection
supE hsdD5 thi D(lac-proAB)
TG A F minus derivative of TG1 Laboratory collection
TG1DcpxA TG1cpxA:: Wcat (CmR
) This work
TG1DcpxP TG1DcpxP::Dfrt This work
TG1DcpxR TG1DcpxR::Dfrt This work
TG1DfimA TG1DfimA::cat (CmR) This work
TG1DmsrA TG1DmsrA::WSpec (SpecR) This work
TG1DpspF TG1pspF::miniTn10 (TetR
) This work
TG1recA TG1recA56 SrlC300::Tn10 (TetR
) Laboratory collection
TG1DrseA TG1DrseA::Dfrt This work
TG1gfp TG1latt::gfp-bla (AmpR) A gift from A. Roux
TG1gfpDcpxP TG1DcpxP latt::gfp-bla (AmpR) This work
TG1gfpDcpxR TG1DcpxR latt::gfp-bla (AmpR
) This work
TG1gfpDyccA TG1DyccA latt::gfp-bla (KmR
, AmpR
) This work
TG1gfpDycfJa TG1
DycfJ latt::gfp-bla (KmR, AmpR) This work
Plasmids
pKOBEG pSC101 ts (replicates at 30∞C), araC Chaveroche et al. (2000)
arabinose-inducible l redgba operon (CmR
)
pCP20 ts (replicates at 30∞C) plasmid bearing Cherepanov and Wackernagel (1995) the flp recombinase gene (CmR and AmpR)
a. Additional individual mutants in the following genes: cutC, cyoC, dinI, eco, fadB, fdhF, gadA, lctR, malM–G, mdh, nifS, nifU, nlpE, pspA–E,
rbsB, rpoE, rseB, sixA, sodC, spy, sucA, sulA, tatE, ybeD, ybjF, yccA, yceP, ycfJ, ycfL, ycfR, ydcI, yebE, yfcX, yggN, yghO, ygiB, yhhY, yiaH,
O’Toole and Kolter (1998). Biofilm development comparisons in aerated microfermenters were conducted as described by Ghigo (2001). The biofilms formed on the removable glass slide were photographed and then resuspended in 10 ml of M63B1 minimal medium. The optical density at 600 nm (OD600) of the resuspension was then measured. After 24 h,
the average resuspended E. coli TG1 biofilm biomass reached OD600 = 5. Each mutant was tested in at least three
independent experiments alongside the control strain TG1.
Macroarray analysis
Genomic expression profiles were performed on E. coli TG1 and TG strains grown in 0.4% glucose M63B1 at 37∞C as either planktonic cultures or mature biofilms. Planktonic cul-tures were realized in agitated Erlenmeyer flasks (main experiment) or aerated microfermenters, both in exponential phase (OD600ª0.6) or stationary phase (OD600ª 3). Mature
biofilms were grown in aerated microfermenters (8- and 5-day-old biofilms for TG1 and TG respectively). For all condi-tions, the equivalent of 15 OD600 of bacterial cells was
col-lected. The cells were then broken in a Fast Prep apparatus (Bio 101). Total RNA was extracted by Trizol (Gibco BRL) treatment. Genomic DNA was degraded using the DNA-freeTM
kit (Ambion). Radioactively labelled cDNAs, generated using
E. coli K-12 CDS-specific primers (Sigma-GenoSys), were
hybridized to E. coli K-12 panorama gene arrays containing duplicated spots for each of the 4290 predicted E. coli K-12 open reading frames (ORFs; Sigma-GenoSys). The intensity of each dot was quantified with the XDOTSREADER software (Cose) as described by Hommais et al. (2001). Experiments were carried out using three independent RNA preparations of TG1 planktonic flask cultures versus TG1 biofilm. For the F-free TG experiment and the TG1 planktonic fermenter ver-sus TG1 biofilm experiments, two independent RNA prepa-rations were used. Each hybridization with each independent sample was carried out with 1 mg and 10 mg of total RNA. Comparison of the signal intensity of arrays from duplicates or from independent hybridizations showed that the results were highly reproducible (data not shown).
Statistical analysis of the macroarray data
Genes that were statistically significantly over- and underex-pressed were identified using the non-parametric Wilcoxon rank sum test. For each gene, the expression in E. coli TG1 flask exponential and stationary planktonic cultures (n = 10 and n = 12 respectively), TG flask planktonic cultures (n = 4), TG1 fermenter planktonic culture (n = 4) and TG1 biofilm (n = 10) or TG biofilm (n = 4) were compared. Analyses were performed with one-tailed tests. Genes were considered to be statistically significantly over- or underexpressed when
P < 0.05. Low (<0.01) or negative levels of expression were removed from the analysis.
Disruption of genes identified through macroarray analysis
fimA, msrA, recA, cpxA and pspF mutants were transferred
to TG1 by P1 transduction. For the other genes, a non-polar
mutation that deletes the entire target gene from the initiation to the stop codon was created by allelic exchange with the non-polar aphA gene cassette from Tn903. We used a three-step PCR procedure as described by Chaveroche et al. (2000) and Derbise et al. (2003) and detailed at http:// www.pasteur.fr/recherche/unites/Ggb/methodes.html.
The primers used to inactivate the 54 genes presented in this study, as well as nlpE and cpxR genes, are described in the Supplementary material (Table S4).
Quantitative RT-PCR
Quantitative RT-PCR was used to confirm the DNA macroar-ray data. Total RNAs used for macroassay were used for real-time PCR and RT-PCR. PCR and RT-PCR were performed using a light cycler (Roche Diagnostics). The RNA preparation was subjected twice to DNase I (Roche Diagnostics) treat-ment for 30 min at room temperature to remove any contam-inating genomic DNA. The enzyme was then inactivated for 15 min at 65∞C in the presence of 2.5 mM EDTA. Samples were checked for residual genomic DNA by real-time PCR using the cpxP-RT-5 and cpxP-RT-3 primers (see
Supplemen-tary material, Table S5). Reactions were performed in a 20 ml reaction volume using LightCycler FastStart DNA master SYBR Green I (Roche Diagnostics) according to the manu-facturer’s instructions. RNA samples were considered to be free of genomic DNA if no amplification was detected after at least 35 cycles of amplification. Quantitative RT-PCRs were performed twice with two independent RNA preparations and using primers specific for several biofilm upregulated genes (see Supplementary material, Table S5) or control 16S rDNA primers (TM1, 5¢-ATGACCAGCCACACTGGAAC-3¢; and TM2, 5¢-CTTCCTCCCCGCTGAAAGTA-3¢) with 50 ng of total RNA. Control 16S rDNA primers were always used to ensure the same quantity of total RNA in each reaction sample. Quantification of mRNA or 16S rRNA (as control) was done using RNA master SYBR Green I (Roche Diagnostics) according to the manufacturer’s instructions. Amplification of a single PCR product was confirmed by fusion curve analysis and electrophoresis on 2% agarose gels.
Construction of GFP-tagged strains
The strain TG1gfp was constructed by integration at the l-att site of a bla-gfpmut3 cassette amplified from plasmid pZER1-GfpSal using a three-step PCR procedure (Table S4) as described by Chaveroche et al. (2000) and Derbise et al. (2003). Plasmid pZER1-GfpSal was a gift from C. C. Guet, in which the gfpmut3 gene (Cormack et al., 1996) is con-trolled by the lambda right promoter. Strains TG1gfpDycfJ,
TG1gfpDyccA, TG1gfpDcpxP and TG1gfpDcpxR were
con-structed by P1vir transduction into TG1gfp.
Flow chamber experiments
Biofilms were cultivated at 30∞C in three-channel flow cells with individual channel dimensions of 1 ¥ 4 ¥ 40 mm. The flow system was assembled and prepared as described pre-viously (Christensen et al., 1999). A microscope glass cover-slip (Knittel 24 ¥ 50 mm st1; Knittel Gläser) was used as substratum for biofilm growth.
672 C. Beloin et al.
Inocula were prepared as follows: 16–20 h overnight cul-tures in LB supplemented with the appropriate antibiotics were harvested and resuspended in 0.9% NaCl; 250 ml of OD600-normalized dilutions in 0.9% NaCl (OD600 = 0.05) were
injected into each flow channel after medium flow was arrested. Flow was started 1 h after inoculation at a constant rate of 3 ml h-1 using a Watson Marlow 205S peristaltic pump. Microscopy and image analysis
Biofilm development in microfermenters was recorded with a Nikon Coolpix 950 digital camera. Transmission and scanning laser electronic microscopy were performed on biofilm grown in microfermenters on thermanox slides (Nalgene) attached to the internal removable glass slide and treated as described by Prigent-Combaret et al. (2000).
For flow chamber experiments, microscopic observations and image acquisitions were performed on a Zeiss LSM510 scanning confocal laser microscope (Carl Zeiss). Images were obtained using a 40 ¥ /1.3 Plan-Neofluar oil objective. Simulated three-dimensional images were generated using the IMARIS software package (Bitplane). Images were pro-cessed further for display using Adobe PHOTOSHOP. For COM-STAT analysis (Heydorn et al., 2000) and quantification of the
E. coli biofilm development with the wild type and the different
mutants, each strain was grown in two separate channels, and six image stacks were acquired randomly down through each channel at different time points (20 h, 45 h, 70 h and 95 h after inoculation).
Acknowledgements
We thank Claude Lebos for preparation of the SEM micro-graphs. We are grateful to E. Krin for assistance in macroar-ray procedure. We thank T. Pugsley and C. Dorel for the kind gift of some strains used in this study, and A. Idja, J. Bellalou and R. Longin (PT5, Institut Pasteur) for technical assistance. We thank S. Da Re, B. Lakowski, C. Buchrieser, U. Dobrindt, T. Msadek, I. Lasa, M. Swanson and P. Delepelaire for critical reading of the manuscript. We also thank the referees for their helpful suggestions. This work was supported by grants from the ‘PRFMMIP – Réseau Infections Nosocomiales’ and the Institut Pasteur.
Supplementary material
The following material is available from http://www. blackwellpublishing.com/products/journals/suppmat/mmi/ mmi3865/mmi3865sm.htm
Fig. S1. COG functional classes for genes underexpressed in TG1 biofilm versus exponential growth phase.
Fig. S2. Functional profiling of mature E. coli biofilm: biofilm formation in microfermenters.
Fig. S3. Functional profiling of early steps in E. coli biofilm formation.
Table S1. Genes overexpressed in E. coli TG1 biofilm versus exponential growth phase.
Table S2. Genes underexpressed in E. coli TG1 biofilm ver-sus exponential growth phase.
Table S3. Genes overexpressed (≥2) in E. coli TG1 biofilm versus both exponential and stationary growth phase.
Table S4. Inactivation of the genes described in this study and TG1gfp strain construction: primers used in the linear DNA, three-step PCR inactivation protocol.
Table S5. Primers used for the Q-RT-PCR experiments.
References
Austin, J.W., Sanders, G., Kay, W.W., and Collinson, S.K. (1998) Thin aggregative fimbriae enhance Salmonella
enteritidis biofilm formation. FEMS Microbiol Lett 162:
295–301.
Campbell, J.W., Morgan-Kiss, R.M., and Cronan, J.E. (2003) A new Escherichia coli metabolic competency: growth on fatty acids by a novel anaerobic beta-oxidation pathway.
Mol Microbiol 47: 793–805.
Chanal, A., Santini, C., and Wu, L. (1998) Potential receptor function of three homologous components, TatA, TatB and TatE, of the twin-arginine signal sequence-dependent met-alloenzyme translocation pathway in Escherichia coli. Mol
Microbiol 30: 674–676.
Chaveroche, M.K., Ghigo, J.M., and d’Enfert, C. (2000) A rapid method for efficient gene replacement in the filamen-tous fungus Aspergillus nidulans. Nucleic Acids Res 28: E97.
Cherepanov, P.P., and Wackernagel, W. (1995) Gene dis-ruption in Escherichia coli: TcR and KmR cassettes with the option of Flp-catalyzed excision of the antibiotic resis-tance determinant. Gene 158: 9–14.
Christensen, B.B., Sternberg, C., Andersen, J.B., Palmer, R.J., Jr, Nielsen, A.T., Givskov, M., and Molin, S. (1999) Molecular tools for study of biofilm physiology. Methods
Enzymol 310: 20–42.
Connolly, L., De Las Penas, A., Alba, B.M., and Gross, C.A. (1997) The response to extracytoplasmic stress in
Escher-ichia coli is controlled by partially overlapping pathways. Genes Dev 11: 2012–2021.
Cookson, A.L., Cooley, W.A., and Woodward, M.J. (2002) The role of type 1 and curli fimbriae of Shiga toxin-producing Escherichia coli in adherence to abiotic sur-faces. Int J Med Microbiol 292: 195–205.
Cormack, B.P., Valdivia, R.H., and Falkow, S. (1996) FACS-optimized mutants of the green fluorescent protein (GFP).
Gene 173: 33–38.
Cormio, L., Vuopio-Varkila, J., Siitonen, A., Talja, M., and Ruutu, M. (1996) Bacterial adhesion and biofilm formation on various double-J stents in vivo and in vitro. Scand J Urol
Nephrol 30: 19–24.
Costerton, J.W., Stewart, P.S., and Greenberg, E.P. (1999) Bacterial biofilms: a common cause of persistent infec-tions. Science 284: 1318–1322.
Danese, P.N., and Silhavy, T.J. (1997) The sigma (E) and the Cpx signal transduction systems control the synthesis of periplasmic protein-folding enzymes in Escherichia coli.
Genes Dev 11: 1183–1193.
Darwin, A.J., and Miller, V.L. (2001) The psp locus of Yersinia
enterocolitica is required for virulence and for growth in
vitro when the Ysc type III secretion system is produced.
Mol Microbiol 39: 429–444.
De Las Penas, A., Connolly, L., and Gross, C.A. (1997) SigmaE is an essential sigma factor in Escherichia coli. J