Dendrogenin A drives LXR to trigger lethal
autophagy in cancers
Gregory Segala
1,2
, Marion David
1,3
, Philippe de Medina
4
, Mathias C. Poirot
1
, Nizar Serhan
1
, François Vergez
5
,
Aurelie Mougel
1
, Estelle Saland
3
, Kevin Carayon
1
, Julie Leignadier
1
, Nicolas Caron
4
, Maud Voisin
1
, Julia Cherier
1
,
Laetitia Ligat
6
, Frederic Lopez
6
, Emmanuel Noguer
4
, Arnaud Rives
4
, Bruno Payré
7
, Talal al Saati
8
,
Antonin Lamaziere
9
, Gaëtan Despres
9
, Jean-Marc Lobaccaro
10
, Silvere Baron
10
, Cecile Demur
5
,
Fabienne de Toni
3
, Clément Larrue
3
, Helena Boutzen
3
, Fabienne Thomas
11
, Jean-Emmanuel Sarry
3
,
Marie Tosolini
6
, Didier Picard
2
, Michel Record
1
, Christian Récher
3,5
, Marc Poirot
1
& Sandrine Silvente-Poirot
1
Dendrogenin A (DDA) is a newly discovered cholesterol metabolite with tumor suppressor
properties. Here, we explored its ef
ficacy and mechanism of cell death in melanoma and
acute myeloid leukemia (AML). We found that DDA induced lethal autophagy in vitro and
in vivo, including primary AML patient samples, independently of melanoma Braf status or
AML molecular and cytogenetic classi
fications. DDA is a partial agonist on liver-X-receptor
(LXR) increasing Nur77, Nor1, and LC3 expression leading to autolysosome formation.
Moreover, DDA inhibited the cholesterol biosynthesizing enzyme 3
β-hydroxysterol-Δ
8,7-isomerase (D8D7I) leading to sterol accumulation and cooperating in autophagy induction.
This mechanism of death was not observed with other LXR ligands or D8D7I inhibitors
establishing DDA selectivity. The potent anti-tumor activity of DDA, its original mechanism
of action and its low toxicity support its clinical evaluation. More generally, this study reveals
that DDA can direct control a nuclear receptor to trigger lethal autophagy in cancers.
DOI: 10.1038/s41467-017-01948-9
OPEN
1UMR 1037-CRCT, Université de Toulouse, INSERM, UPS, Cholesterol Metabolism and Therapeutic Innovations Team, Toulouse, F-31037, France. 2Département de Biologie Cellulaire, Université de Genève, Genève, 1211, Switzerland.3UMR 1037-CRCT, Université de Toulouse, INSERM, UPS,
Chemoresistance, Stem Cells and Metabolism in Acute Myeloid Leukemia, Toulouse, F-31037, France.4AFFICHEM, Toulouse, F-31400, France.5Service d’Hématologie, Institut Universitaire du Cancer de Toulouse-Oncopole, CHU de Toulouse, Toulouse, F-31100, France.6UMR 1037-CRCT, Pole
Technologique, Toulouse, F-31037, France.7Centre de Microscopie Electronique Appliquée à la Biologie, Toulouse, F-31062, France.8INSERM-US006 ANEXPLO/CREFRE F-31024, Toulouse, F-31024, France.9Laboratory of Mass Spectrometry, INSERM ERL 1157, CNRS UMR 7203 LBM, Sorbonne Universités-UPMC, CHU Saint-Antoine, Paris, F-75012, France.10Université de Clermont Auvergne, CNRS, INSERM, GReD, Clermont-Ferrand, F-63001,
France.11UMR 1037-CRCT, Université de Toulouse, INSERM, UPS, Dose Individualisation of Anticancer Drugs Team, Toulouse, F-31037, France. Gregory
Segala, Marion David, and Philippe de Medina contributed equally to this work. Correspondence and requests for materials should be addressed to C.R. (email:recher.christian@iuct-oncopole.fr) or to M.P. (email:marc.poirot@inserm.fr) or to S.S.-P. (email:sandrine.poirot@inserm.fr)
123456789
D
eregulation at various points along the cholesterol
meta-bolic pathway has recently been shown to favor the
accumulation of metabolites with tumor-promoting
activity
1–4, however a cholesterol metabolite was also discovered
in human tissues and cells, named dendrogenin A (DDA), with
anti-tumor properties
4–8. In vitro, DDA triggers cancer cell
dif-ferentiation and death
9. In vivo, DDA controls the growth of
mouse tumors and increases animal survival and these effects
were associated with tumor differentiation and cholesterol
epoxide hydrolase (ChEH) inhibition
5. Interestingly, DDA levels
were decreased in patient tumors and it was not detected in a
panel of cancer cell lines, suggesting a deregulation of DDA
biosynthesis during carcinogenesis and a physiological function
in maintaining cell integrity
5. Thus, DDA appears to be the
first
tumor suppressor of cholesterol origin discovered so far with
potential clinical interest
2. However, its efficacy in vivo against
human tumors and the mechanisms involved in its anticancer
activity have not yet been evaluated. ChEH activity is carried out
by two enzymatic subunits, the 3β-hydroxysterol-Δ
8,7-isomerase
(D8D7I or EBP) and 3β-hydroxysterol-Δ
7-reductase (DHCR7)
10,
which are both involved in cholesterogenesis. ChEH inhibitors
such as the anticancer drug Tamoxifen (Tam), have been shown
to induce tumor cell differentiation and death and survival
macroautophagy (hereafter referred as to autophagy)
11–16. Cell
differentiation and death was due to the cholesterol epoxides
accumulation through the stimulation of cholesterol epoxidation
and the inhibition of ChEH
11,12,17. Autophagy induced by Tam
and selective ChEH inhibitors such as PBPE has been associated
with the accumulation of free sterols due to the inhibition of
D8D7I
15. It is a physiological process that maintains homeostatic
functions and cell survival. Cancers can upregulate autophagy to
survive microenvironmental stress and to increase growth and
aggressiveness
18. However, recent data have provided evidence
that the autophagic machinery can also be recruited to mediate
selective tumor cell death, anti-tumor immunity and can be
crucial for vital functions such as developmental morphogenesis,
tissue homeostasis and the counteraction of aberrant cell
divi-sion
19–22.
In the present study, we report the potent anti-tumor activity
of DDA against human melanoma and acute myeloid leukemia
(AML) both in vitro and in vivo, including primary tumors from
AML patients. Further, we describe its original mechanism of
cytotoxicity, which involves the direct control of a nuclear
receptor to trigger lethal autophagy.
Results
DDA induces melanoma cell death independent of apoptosis.
In murine B16F10 and human SKMEL-28 melanoma cells, DDA
(Fig.
1a) induced cytotoxicity and inhibited clonogenicity while
its regio-isomer C17 (Fig.
1a) was inactive (Fig.
1b;
Supplemen-tary Fig.
1a). Sensitivity to DDA was also observed in various
human melanoma cell lines irrespective of their Braf status
(Supplementary Fig.
1b). In the melanoma cell lines B16F10 and
SKMEL-28, DDA induced tumor cell accumulation in sub G0/G1,
and the appearance of characteristics of apoptosis
(Supplemen-tary Fig.
1c–g), however DDA cytotoxicity measured for 48 and
72 h was not blocked by general caspase inhibitors or antioxidants
which blocked lipoperoxidation and cholesterol epoxidation
(Fig.
1c), suggesting that cell death is independent of apoptosis
and ChEH inhibition. Analyses of the oxysterol profile of cells
treated with DDA showed no accumulation in 5,6-EC as opposed
to what was found with other ChEH inhibitors Tam and PBPE
(Supplementary Fig.
1h). We observed that DDA stimulated
catalase activity (Supplementary Fig.
1i), which induced H
2O
2destruction and blocked 5,6-EC production. This established a
significant difference between DDA and ChEH inhibitors like
Tam or PBPE (Supplementary Fig.
1j, k) because we showed that
Tam and PBPE mediated part of their cytotoxicity through the
accumulation of 5,6α-EC, which acted as a second messenger
17.
DDA cytotoxicity was inhibited by actinomycin D and
cyclo-heximide, indicating that cell death triggered by DDA required
gene transcription and translation (Fig.
1c). Inhibition of one of
the ChEH subunit, D8D7I, and the accumulation of its substrate,
zymostenol, has been previously reported to be associated with
autophagy
11,14,15,23. Here we found that DDA inhibited D8D7I
and induced the accumulation of
Δsterols (zymostenol and
8-dehydrocholesterol) (Supplementary Fig.
2a), illustrated by the
appearance of intracellular
filipin punctate labeling of free sterols
(Fig.
1d). This showed that the consequence of DDA binding on
ChEH is the inhibition of D8D7I and
Δ8-sterols accumulation
but not 5,6-EC accumulation as observed with other ChEH
inhibitors such as tamoxifen
17(Supplementary Fig.
2b–d).
Ultrastructure analysis confirmed that DDA-treated cells
con-tained white cytosolic vesicles (Supplementary Fig.
2e: panels 3, 4),
which were identified as lysosomes (Ly), autophagosomes (AP)
and autolysosomes (AL) (Fig.
1e: panels 1, 2 and 3, 4
respec-tively). Numerous
filipin punctates, marking the sites of
Δ8-sterols accumulation, were also found to express the lysosomal
marker LAMP1 (Supplementary Fig.
2f), showing their lysosomal
nature and corresponded to the multilamellar bodies
16observed
by transmission electron microscopy (TEM) (Fig.
1e).
Collec-tively, these data indicate that DDA induces a caspase- and
reactive oxygen species-independent cell death and characteristics
of autophagy.
DDA induces Nur77- and NOR1-dependent lethal autophagy.
As DDA-mediated melanoma cell death was found to require
gene transcription, we measured the effect of DDA treatment on
the transcription of genes encoding nuclear receptors (NR) and
their co-regulators, using PCR arrays. DDA stimulated the
tran-scription (Fig.
1f) and protein expression (Fig.
1g) of the
tran-scription
factors
NR4A1
(Nur77)
and
NR4A3
(NOR1).
Accordingly, single or double knockdown (KD) of Nur77 and
NOR1 impaired DDA cytotoxicity (Fig.
1h; Supplementary
Fig.
2g). These data indicate that Nur77 and NOR1 are involved
in DDA-induced cell death. To validate the induction of
autop-hagy suggested by TEM analysis, complimentary assays were
performed
23, 24. DDA induced the accumulation of
mono-dansylcadaverine (MDC)-positive vesicles (Fig.
2a), which stains
Ly, AL, and AP
25. It also increased levels of autophagic proteins,
with a main impact on LC3-II expression (Fig.
2b), and
stimu-lated the rate of long-lived protein degradation following its
inhibition by two pharmacological inhibitors of autophagy,
bafi-lomycin A1 (Baf A1) and hydroxychloroquine (HCQ) (Fig.
2c).
This confirms the functional induction of autophagy by DDA.
DDA was also shown to induce autophagic
flux as the
co-treatment of DDA with lysosomal degradation inhibitors (E64d
and pepstatin A) further enhanced (~2-fold) LC3-II accumulation
(Fig.
2d) and GFP-LC3 puncta (Fig.
2e) relative to DDA alone.
The lysosomal inhibitor Baf A1 inhibited the production of
MDC-positive vesicles induced by DDA (Supplementary Fig.
2h)
and, in line with this, KD of the autophagic proteins ATG7,
VPS34, and BECN1 in melanoma cells (Supplementary Fig.
2i)
inhibited DDA-induced LC3-II formation (Supplementary
Fig.
2j), DDA-induced MDC-labeled punctates (Supplementary
Fig.
2k), and DDA-induced cell death (Fig.
2f–g). Blocking
autophagy with Baf A1 or HCQ also inhibited DDA-induced cell
death (Fig.
2h). In contrast, Baf A1 or HCQ treatment potentiated
the toxicity induced by inhibitors of D8D7I
26such as PBPE and
h
DDA (μM) – 1 2.5 5 – 1 2.5 5 B16F10 SKMEL-28 Nur77 Actin NOR1 68 77 42 kDaa
DDAb
g
c
HO HO HN HN N HO HO NH2 N N C17d
siSC siNur77 siNOR1 siNur77 + siNOR1 0 B16F10 + 2.5 μM DDA Time (h) Cell death (%) B16F10 SKMEL-28 100 50 0 B16F10 + 5 μM DDA B16F10 + 5 μM C17 SKMEL-28 + 2.5 μM DDA SKMEL-28 + 5 μM DDA SKMEL-28 + 5 μM C17 0 24 48 72 25 50 75 100f
1 2 LY AP LY AP 3 4 AL AL B16F10 SKMEL-28 Filipin labeling B16F10 SKMEL-28e
Control DDA Control DDA B16F10 SKMEL-28 0 100 200 300 400 500 DDA Control Filipin (median fluorescence) 1.0 1.2 5.0 4.8 1.0 2.7 3.8 4.2 1.0 1.1 2.6 3.3 1.0 1.7 2.5 3.9AHR AR ARNT BRD8 CREBBP MED14 MED17 DDX5 ESR1 ESR2 ESRR
α
ESRR
β
ESRR
γ
HDAC1 HDAC2 HDAC3 HDAC4 HDAC5 HDAC6 HDAC7 HMGA1 HNF4
α
HTATIP TGB3BP MED12 MED4 MTA1 NCOA1 NCOA2 NCOA3 NCOA4 NCOA6 TGS1 NCOR1 NCOR2 NFKB2 NONO NOTCH2 NR0B1 NR0B2 NR1D1 NR1D2 NR1H3 NR1H2 NR1H4 NR1I2 NR1I3 NR2C1 NR2C2 NR2E3 NR2F1 NR2F2 NR2F6 NR3C1 NR3C2 NR4A1 NR4A3 NR5A1 NR6A1 NRIP1 PCAF PPAR
α MED1 PPAR δ PPAR γ PGC1 α PGC1 β PSMC3 PSMC5 RAR α RAR β RAR γ RBPJ ROR α RXR α RXR β RXR γ THR α
MED13 MED24 MED16 THR
β TRIP4 VDR B2M HPRT1 Control DDA Control DDA 5 10 15 B16F10 SKMEL-28 Nur77 NOR1
DDA-induced cell death (% relative to control)
Gusb Hprt1 Vit E BHT NAC z-VAD-fmk Act-D CHX 0 50 100 B16F10 (48 h) B16F10 (72 h) SKMEL-28 (48 h) SKMEL-28 (72 h) ** * Cell death (% relative to control) z-DEVD-fmk ** * *** ** * *** ** * ****** *** *** ** ** ** ** ******
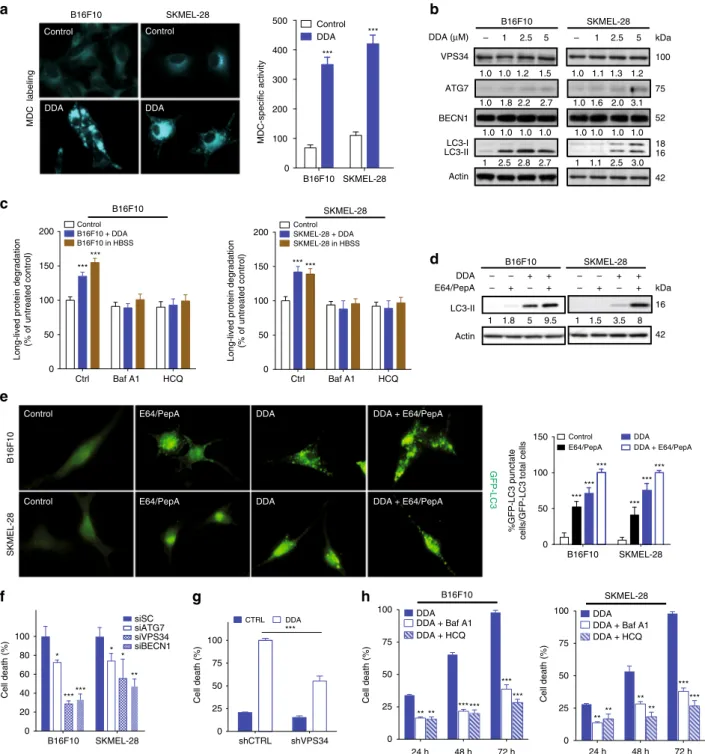
Fig. 1 Nur77 and NOR1 are required for the induction of cell death by DDA in melanoma. a Chemical structure of DDA and C17. b B16F10 and SKMEL-28 cells were treated or not for 24, 48, or 72 h with DDA or C17. DDA- or C17-induced cell death was determined by a trypan blue assay and expressed as the percentage cell death relative to control (vehicle).c Cells were treated with 5µM DDA for 48 h or 72 h with or without 500 µM vitamin E (Vit E), 50 µM z-VAD-fmk, 50µM z-DEVD-fmk, 1 µg/ml actinomycin D (Act D) or 2.5 µg/ml cycloheximide (CHX), and cell death was measured as in b. d DDA induced the accumulation of free sterols in cells. Cells were treated with solvent vehicle or 2.5µM DDA for 48 h, then fixed and stained with filipin and analyzed by fluorescence microscopy. e Representative EM images of B16F10 (panels 1–3) and SKMEL-28 (panels 2–4) cells treated for 24 h with 2.5 µM DDA. Ly: multilamellar body-derived lysosomes, AP: autophagosomes, AL: autolysosomes, N: nucleus, C: cytoplasm. Bars: 250 nm for panel 1 and 100 nm for inserts; 500 nm for panel 2 and 100 nm for inserts; 500 nm for panel 3; and 250 nm for panel 4.f Heat map depicting transcription of genes encoding nuclear receptors (NR) and their co-regulators, using PCR arrays in B16F10 and SKMEL-28 cells treated or not with 2.5µM DDA for 5 h, using PCR arrays. g Immunoblot for Nur77 and NOR1 protein expression in melanoma cells treated or not with DDA for 24 h.h Analysis of DDA cytotoxicity in B16F10 and SKMEL-28 cells transfected with control scramble siRNA (siSC), siNur77 and/or siNOR1. 72 h after transfection, cells were treated or not for 24 h with 2.5 µM DDA. Cell death is expressed as a percentage relative to the level of cell death induced by DDA in cells transfected with a scramble control siRNA (siSC). Data fromb–d and h are the means ± S.E.M. of three independent experiments performed in triplicate, **P < 0.01, ***P < 0.001, t-test. All images and densitometry values are representative of three independent experiments
LC3-II Actin DDA – – + – – E64/PepA – + – + – + – + B16F10 SKMEL-28 16 kDa
g
f
B16F10 SKMEL-28 20 40 60 80 100 siATG7 siSC siVPS34 * ** * * siBECN1 ******b
0 1 1.8 5 9.5 1 1.5 3.5 8h
shCTRL shVPS34 0 25 50 75 100 CTRL DDA Cell death (%) B16F10 SKMEL-28 MDC labeling B16F10 SKMEL-28 0 100 200 300 400 500 Control DDA MDC-specific activitya
DDA DDA Control Control B16F10 SKMEL-28 0 50 100 150 Control E64/PepA DDA DDA + E64/PepA %GFP-LC3 punctatecells/GFP-LC3 total cells
e
c
Control + + + B16F10 SKMEL-28 DDA (μM) – 1 VPS34 ATG7 Actin BECN1 LC3-I LC3-II B16F10d
SKMEL-28 16 18 42 kDa 52 75 100 1.0 1.8 2.2 2.7 2.5 5 – 1 2.5 5 1 2.5 2.8 2.7 1 1.1 2.5 3.0 1.0 1.0 1.0 1.0 1.0 1.0 1.0 1.0 1.0 1.6 2.0 3.1 1.0 1.0 1.2 1.5 1.0 1.1 1.3 1.2 GFP-LC3 Ctrl Baf A1 HCQ 0 50 100 150 200 Control B16F10 in HBSSLong-lived protein degradation
(% of untreated control) B16F10 + DDA Ctrl Baf A1 HCQ 0 50 100 150 200 Control SKMEL-28 in HBSS SKMEL-28 + DDA B16F10 SKMEL-28
Long-lived protein degradation
(% of untreated control) 24 h 48 h 72 h 0 25 50 75 100 DDA + Baf A1 DDA DDA + HCQ ** ** ****** *** *** 24 h 48 h 72 h 0 25 50 75 100 DDA + Baf A1 DDA DDA + HCQ
Cell death (%) Cell death (%)
B16F10 SKMEL-28 *** *** *** *** *** *** *** *** *** *** *** *** ***
E64/PepA DDA DDA + E64/PepA
Control E64/PepA DDA DDA + E64/PepA
Cell death (%) 42 *** ** ** ** ** ***
Fig. 2 DDA induces Nur77- and NOR1-dependent lethal autophagy in melanoma cells. a DDA triggers the accumulation of autophagic vesicles. Cells were treated for 24 h with or without 2.5µM DDA then stained with monodansylcadaverine (MDC) and observed by fluorescence microscopy. MDC-specific activity was measured byfluorescence photometry. b Cells were treated for 24 h with solvent vehicle or increasing concentrations of DDA then analyzed for autophagic protein expression by immunoblotting. Blots are representative of three independent experiments.c Long-life protein degradation was determined in cells treated with solvent vehicle (control) or 1µM DDA for 18 h in the presence or absence of the autolysosomal inhibitors bafilomycin A1 (Baf A1) and hydroxychloroquine (HCQ). Autophagic activity was measured as the level of degradation of long-lived proteins. Starvation for 18 h in Hank’s balanced salt solution (HBSS) was used as a positive control.d Immunoblots of LC3 proteins from cells treated for 24 h with or without 2.5µM DDA and with or without E64 + pepstatin A (10µg/ml). Images are representative of three independent experiments. e DDA induced the formation of punctate LC3 cells. Cells were transfected with a plasmid-expressing GFP-LC3 and then treated for 24 h with the solvent vehicle or 2.5µM DDA, with or without E64 + pepstatin A (10µg/ml) and observed by fluorescent microscopy. The percentage of GFP-LC3-positive cells with GFP-LC3 puncta was calculated. f Analysis of DDA cytotoxicity in cells transfected with scramble siRNA (siSC), siATG7, siVPS34, or siBECN1. Seventy-two hours after transfection, cells were treated or not for 24 h with 2.5µM DDA. g Analysis of DDA cytotoxicity in SKMEL-28 cells permanently transfected with control shRNA (shCTRL) or shRNA against VPS34 (shVPS34). Cells were treated for 72 h with solvent vehicle (CTRL) or 2.5µM DDA. h Cells were treated with 2.5 µM DDA for 24, 48 and 72 h in the presence or absence of the autolysosome inhibitors Baf A1 or HCQ. Cell death is expressed as in Fig.1a. Data froma, c, e, f, g are the means± S. E.M. of three experiments performed in triplicate, *P < 0.05, **P < 0.01, ***P < 0.001, t-test
autophagy
13. DDA-induced LC3-II formation was also inhibited
by the single or double KD of NOR1 and Nur77 (Supplementary
Fig.
3c–e). These data combined indicate that DDA induces lethal
autophagy in melanoma cells and that this is mediated by Nur77
and NOR1.
LXR is the molecular target of DDA. To characterize the direct
targets of DDA, we incubated B16F10 cells with [
14C]-labeled
DDA. After 6 h, DDA was located in the nucleus, suggesting its
possible interaction with a nuclear receptor (NR) (Supplementary
Fig.
3f). We therefore investigated the hypothesis that DDA could
HO HO NH2 N N HO HN HN N HO HN OH O HO HN HN N NR4A1 NR4A3
e
d
0 50 100 *** 50 100 150 ***f
F333 F329 F268 A275 M312 S278 E281 F243l
m
h
B16F10 SKMEL-28 0 25 50 75 100 siSC siLXRβc
b
a
–8.5 –7.5 –6.5 –5.5 0 25 50 75 100 Luciferase activity in % –8 –6 –4 0 25 50 75 100 % bound [ 3H]25HC LBD-LXRβ / DDA HO HO LXRβ-DDA Cell death (%) LXRα LXRβ LBD-LXRα LBD-LXRβ Log([DDA] in M) Log([DDA] in M) 22(R)HC DDA C17 C31 C41 C51 LXR β -dependent luciferase activity (%) LXR β -dependent luciferase activity (%) 22(R)HC DDA C17 C31 C41 C51 22(R)HC P247 0 20 40 60 80 Time (s) Response (RU) 0 100 200 300 100 μM 50 μM 25 μM 12.5 μM 6.25 μM *** ***i
j
k
RLU (fold control) Cell death
(% treated DDA) 0 50 100 B16F10 SKMEL-28 *** *** *** ***
n
0.0 3 2 1 0 0.1 0.5 DDA (μM) 1 2.5 5 0.5 1.0 1.5 2.0TFEB mRNA (fold control)
Control Nur77 LC3-I Actin SKMEL-28 DDA B16F10 NOR1 LC3-II – + – +
siSC siSC siLXR
β – + – + 68 77 42 kDa 18 16 1.0 2.2 1.0 1.1 1 1 1 1 1 1 1 1 1 1 1.5 0.5 1.7 2.1 1.1 3 6.2 1.5 3.3 1.2
g
siLXR β B16F10 SKMEL-28 0 100 200 300 Control TO MDC specific activity ** DDA * TO + DDA * ** ** ** DDA (μM) 22(R)HC (μM) 10 2 5 5 DDA 22(R)HC 22(R)HC+DDA TO+DDA TO SCD1 0.0 0.5 1.0 1.5 2.0 2.5 22(R)HC DDA 0 1 2 3 4 22(R)HC DDA ABCA1 0 1 2 3 22(R)HC DDA TFEB 0.0 0.5 1.0 1.5 2.0 22(R)HC DDA LXR β -ChP (fold control) LXR β -ChP (fold control) LXR β -ChP (fold control) LXR β -ChP (fold control) LC3B SREBF1 LC3A LDLRFig. 3 LXR are targets of DDA and LXRβ is required for its cytotoxicity in melanoma cells. a LXR transcriptional activity was analyzed using transient transfection reporter assays. Tranfected cells were treated with 10µM 22(R)HC with or without DDA. b Competition binding assays on LXRα or LBD-LXRβ. c SPR sensorgrams showing the binding of DDA to the LBD-LXRβ. d Molecular docking of DDA with the LBD-LXRβ. Amino acid side chains that interact with DDA are represented (in black). The names of the amino acids known to interact with known LXR ligands are colored in blue. Gray: carbon atoms, white: hydrogen atoms, red: oxygen atoms, blue: nitrogen atoms, yellow: sulfur atoms.e Structures of DDA analogs assayed in the LXR reporter assay.f Analysis of LXRβ-dependent agonistic or antagonistic activities by DDA and analogs. g the stimulation of LC3, Nur77, and NOR1 protein expression by DDA is LXRβ-dependent. h ChIP-qPCR of LXRβ on the SCD1, LC3A, LC3B, SREBP1, NR4A1, NR4A3, ABCA1, and LDLR enhancers on SKMEL-28 cells treated or not with 10µM 22(R)HC or 2.5 µM DDA. i ChIP-qPCR of LXRβ on the TFEB enhancer on SKMEL-28 cells treated or not with 10 µM 22(R)HC or 2.5µM DDA. j Real-time PCR of TFEB expression in SKMEL-28 cells treated or not with 5 or 10 µM 22(R)HC, and 2 or 5 µM DDA. k Luciferase reporter gene assays with the TFEB promoter-luciferase construct in HEK293T. Cells were treated with increasing DDA concentrations.l Analysis of DDA cytotoxicity in cells transfected with control siRNA (shSC) or siLXRβ. Cells were treated with 2.5 µM DDA. m Analysis of the cytotoxicity of cells treated with or without 2µM DDA, 5 µM 22(R)HC, 0.5 µM TO, 1 µM GW or 2 µM DDA + 10 µM 22(R)HC, 0.5 µM TO, or 1 µM GW. n TO reversed DDA induction of autophagic vesicles. Cells were treated for 24 h with or without 2µM DDA, 0.5 µM TO, or 0.5 µM TO + 2 µM DDA. Cells were stained with MDC and observed byfluorescence microscopy. Data from a, b, f, j, k, l, m are the means ± S.E.M. of three independent experiments performed in triplicate (*P < 0.05, **P < 0.01, ***P < 0.001, t-test)
modulate the liver-X-receptors (LXRs) as DDA-induced events
such as triacylglycerol synthesis
5,9and NOR1 expression are also
known to be regulated by the LXRs
27. We found that DDA
inhibited LXR-dependent luciferase activity stimulated by
22(R)-hydroxycholesterol (22(R)HC) in the presence of LXRα or LXRβ
in a concentration-dependent manner, with IC
50values of 362
±
52 and 76
± 12 nM, respectively (Fig.
3a). DDA did not show any
agonistic or antagonistic transcriptional activity on any of the
other NRs tested, establishing its selectivity for the LXRs
(Sup-plementary Fig.
3g). Binding competition assay (Fig.
3b) and
surface plasmon resonance assays on recombinant LXRα and
LXRβ ligand-binding domains (LBD) (Supplementary Fig.
3h;
Fig.
3c) indicated that DDA is a ligand of both isoforms with a
fourfold preference for LXRβ-LBD, whereas GW3965 displayed a
similar affinity for both LXR-LBD (Supplementary Fig.
3i).
Docking experiments using the X-ray structures of LXRα and
LXRβ also showed that DDA can be well accommodated within
the LBD of both receptors (Fig.
3d; Supplementary Fig.
3j), with
the ring-B hydroxyl in position 5α of DDA making hydrogen
bonds with T302 (LXRα) and S278 (LXRβ), the secondary amine
on 6β making a hydrogen bond with S264 (LXRα), and cation–pi
interactions between DDA and F243 and F329 (LXRβ). The
imidazole ring of DDA is involved in an electrostatic bond with
E267 (LXRα) and a π–π interaction with F333 (LXRβ), and the
aliphatic side chain of DDA can make van der Waals interactions
with H421, V425, W443, F257 and L439 (LXRα), and F268, A275
and M312 (LXRβ). Among these residues, E267, H421 and W443
in LXRα have been previously identified as being important for
transcriptional activation, and H421 and W443 for the anchoring
of the known LXR agonists TO901317 (TO) and 22(R)HC,
whereas T302 has been previously described to stabilize TO
binding
28. The F268, A275, and M312 residues in LXRβ have
been previously shown to interact with the LXR ligands T0 and
GW3965 (GW); F329 was also shown to interact with GW and
S278 with T0
29. Modification or elimination of the chemical
groups involved in the interaction of DDA with the LXRs
(Fig.
3e) drastically affected the transcriptional activity of DDA
(Fig.
3f; Supplementary Fig.
3k) inducing a switch from
antago-nist to agoantago-nist activity when eliminating (C41) or moving (C17)
the imidazole ring on LXRα. C41 but not C17 induced a similar
a
DDA – + Nur77 NOR1 Actin LC3-IILC3-I DDA – + Nur77 NOR1 Actin LC3-IILC3-I ** **b
16 18 42 kDa 68 77 16 18 42 kDa 68 77 DDA Controlc
B16F10 SKMEL-28 10 15 20 0 750 1500 2250 DDA Days Control 5 0 10 15 20 25 30 100 200 300 400 500 Days 5 0 Tumor volume (mm 3) Tumor volume (mm 3) DDA Control 1 8 1 5 1 8 1 3 1 15 1 4d
shCTRL sh3LXRβ sh4LXRβ AM AM C Ce
shCTRL sh3LXRβ sh4LXRβ N C N C N C N C N C Control DDA Control Control DDA 5 μm 5 μm 5 μm 10 μm 10 μm 0.2 μm 0.2 μm 1 μm C N DDA N C 10 μm 0.1 μm ALDDA DDA DDA
DDA DDA DDA
1 μm 1 μm
Nur77
NOR1
LC3
Fig. 4 DDA induces autophagy in melanoma in vivo and in vitro in an LXRβ-dependent manner. a, b Mice engrafted with human SKMEL-28 or mouse B16F10 cells (10 per group) were treated with DDA (i.p. 20 mg/kg/day) or vehicle. Mean tumor volumes± S.E.M. are shown, **P < 0.01, analysis of variance (ANOVA). Data are representative of three independent experiments. At the end of treatments, tumors were analyzed for Nur77, NOR1 and LC3 protein expression bya, b immunoblotting or c immunohistochemistry (brown staining). c Representative immunohistochemical analysis. Magnification ×40. Insert is 4× digital amplification. d, e TEM images of cells transfected with shCTRL, sh3LXRβ, or sh4LXRβ and treated with control vehicle or 2.5 µM DDA for 24 h.e TEM images of cells transfected with shCTRL, sh3LXRβ, or sh4LXRβ and treated with 2.5 µM DDA for 24 h. d, e N, nucleus; C, cytoplasm; AM, amphisome
antagonist-agonist switch on LXRβ. This is consistent with a
previous study showing that E267 was found to enhance
tran-scriptional inhibition
28. These data established that DDA is a
non-selective endogenous ligand of LXRα and LXRβ isoforms. As
shown in Supplementary Fig.
4a, DDA treatment increased the
levels of mRNAs encoding ABCG5, LDLR, NOR1, Nur77, LC3A
and LC3B. It also repressed ABCA1 mRNA levels and had no
impact on SREBP1 mRNA levels. In comparison, the known LXR
ligands 22(R)HC, GW, and T0, stimulated the transcription of
most of the genes tested, but had no or a weaker effect than DDA
on increasing NOR1, Nur77, LC3A, and LC3B levels. This was
confirmed at the protein level for LC3-II (Supplementary Fig.
4b).
KD of LXRβ, the only isoform expressed in these cells
(Supple-mentary Fig.
4c), inhibited the stimulation of the expression of
NOR1, Nur77 and LC3 at both the mRNA (Supplementary
Fig.
4a) and protein (Fig.
3g) levels by DDA. In addition, the use
of embryonic
fibroblasts from LXRβ knock out mice confirmed
the importance of LXR in DDA modulation of gene expression
(Supplementary Fig.
4d). LXR agonists did not induce
Δ8-sterols
accumulation (Supplementary Fig.
4e) and KD of LXRβ in
mel-anoma cells did not reversed DDA induction of
Δ8-sterols
accumulation (Supplementary Fig.
4f). We next assessed whether
DDA affects the binding of LXRβ on the potent enhancers
identified in Supplementary Fig.
4g. DDA increased the binding
of LXRβ on enhancers that are close to well-known target genes of
LXRβ (SCD1, SREBF1), whereas it repressed LXRβ binding on
other enhancers (ABCA1, LDLR), showing that DDA directly
regulates LXRβ target genes (Fig.
3h). LXRβ binding on enhancers
close to autophagic genes (LC3s and NR4As) is globally increased
by DDA (Fig.
3h) strongly suggesting a direct control of their
expression by DDA through LXRβ. 22(R)HC also regulates the
binding of LXRβ on these enhancers reinforcing the possibility
that LC3s and NR4As were LXRβ target genes. Importantly,
differences appeared between DDA and 22(R)HC regarding the
binding of LXRβ, in a gene-specific manner (Fig.
3h). This
sug-gests that a set of LXRβ target genes is differently controlled by
DDA compared to other LXR ligands and may explain why the
anticancer mechanisms induced by DDA were never observed
until now with LXR ligands. To gain insights into LXRβ target
genes that might be involved in autophagy and lysosome
bio-genesis, we computationally predicted putative LXRβ-target genes
based on the proximity between their Transcription Start Site
(TSS) and LXRβ binding sites (LXRBS) (Supplementary Fig.
4g)
according Wang et al.
30methodology. We performed a gene
ontology (GO) study using
<< Autophagy >> and << Lysosome
organization
>> terms on these putative LXRβ target genes and
Nur77 LC3-I Actin DDA – + NOR1 LC3-II – + shCTRL sh4LXR β shCTRL Days
a
** N.S.b
Tumor volume (mm 3) 68 16 18 42 kDa 77 1.0 5.2 1 1 1.0 4.1 1 0.8 1.0 2.5 1 1.1 0 100 200 300 400 DDA Control 10 15 20 5 0 0 50 100 150 200 250 Days Tumor volume (mm 3) DDA Control 10 15 20 5 0 shLXRβe
TPM 4000 2000 0 LXRβ LXRα ***c
10 15 20 0 750 1500 2250 3000 Control DDA Days TO TO+DDA ns 200 300 400 500 ControlDDA Days TO TO+DDA ns 0 5 10 15 20 0 5 B16F10 SKMEL-28 Δ 8 sterol ( μ g/g tumor) 0 100 200 300 *** *** 0 20 40 60 DDA TO * * TO + DDA * 5,6-EC (ng/g tumor) Δ 8 sterol ( μ g/g tumor) 5,6-EC (ng/g tumor) 0 50 100 150 *** *** 0 20 40 DDA TO * * TO + DDA Control DDA TO TO+DDA Control DDA TO TO+DDA *** *** *** ** *** ***d
Tumor volume (mm 3) Tumor volume (mm 3) Control 5,6α-EC 5,6β-EC 5,6α-EC 5,6β-EC ControlFig. 5 The anti-melanoma action of DDA in vivo is LXRβ-dependent. a Mice engrafted with SKMEL-28 cells transfected with shCTRL or sh4LXRβ (10 per group) were treated with DDA (i.p. 20 mg/kg/day) or vehicle. Mean tumor volumes± S.E.M. are shown, **P < 0.01, analysis of variance (ANOVA). Data are representative of three independent experiments.b At the end of treatments, tumors were analyzed for Nur77, NOR1, and LC3 protein expression by immunoblotting. All images and blots are representative of three independent experiments.c, d Mice engrafted with mouse B16F10 cells or human SKMEL-28 (10 per group) were treated with vehicle, DDA (i.p. 20 mg/kg/day), TO (i.p. 20 mg/kg/day), and DDA + TO (i.p. 20 mg/kg/day each). Mean tumor volumes± S.E.M. are shown, **P < 0.01, analysis of variance (ANOVA). Quantification of Δ8-sterols and 5,6α-EC and 5,6β-EC in tumors were quantified by GC/MS. The results are reported asµg Δ8-sterols or ng 5,6-EC/g tumors. e Box plot of TCGA RNA-seq data from patients with melanoma showing that LXRβ is the predominant LXR isoform expressed. ***P < 0.001
got 26 hits including MAP1LC3B that could be regulated by LXR.
Among them, TFEB was common to both series (Supplementary
Fig.
4h). ChIP analyses of 22(R)HC and DDA-treated SKMEL-28
cells showed that they increased or inhibit, respectively, LXRβ
binding to an enhancer located 5.7 kilobases from the TSS of
TFEB (Fig.
3i) confirming that TFEB was a direct LXRβ-target
a
HL60 Control DDA KG1d
16 18 42 E64/Pep DDA LC3-I LC3-II Actin – – + – + – + + KG1 – – + – + – + + HL60 1.0 2.8 4.0 5 1 6.0 11.8 19.1f
g
ATG3 Actin DDA – + – + siSC siATG3 1 1.7 1 1 2.5 1 1.3e
kDac
16 18 42 kDa LC3-I LC3-II 40i
DDA – + – + – + 1 4.2 1 2.1 1 2.2 shCTRL sh3LXR β sh4LXR β 16 18 42 kDa Actin LC3-I LC3-IIj
l
k
Cell death (%) shCTRLsh3LXR β sh4LXR β 0 20 40 60 ** *** Cell death (%) siSC siATG3siATG7siBECN1 0 50 100 *** *** ** Cell death (%) KG1 HL60 0 5 10 15 DDA Control Amount of Δ 8-sterols /total sterol (%) *** ** KG1 HL60 0 25 50 75 100 DDA + Baf A1 48 h DDA ** *** DDA + Baf A1 72 h ** ***Cell death (%) Cell death (%)
0 25 50 75 100 shVPS34 + DDA shC + DDA ** **
h
KG1 HL60 0 20 40 60 80 100 *** Cell death (%) 0 10 20 30Acridine orange positive cells (%)
b
0 20 40 60 80 ** * Cell death (%) ***m
0 5 10 * *Acridine orange positive cells (%)
n
–6.0 –5.5 –5.0 0 50 100 150 24 h 48 h 72 h Log ([DDA], M) –6.0 –5.5 –5.0 0 50 100 150 24 h 48 h 72 h Log ([DDA], M) Cell death (%) 1 KG1 HL60 22(R)HC GW TO DDA Control GW22(R)HC TO DDAControl shCTRLshNur77shNOR1shNur77+
shNOR1
shCTRLshNur77shNOR1shNur77+
shNOR1
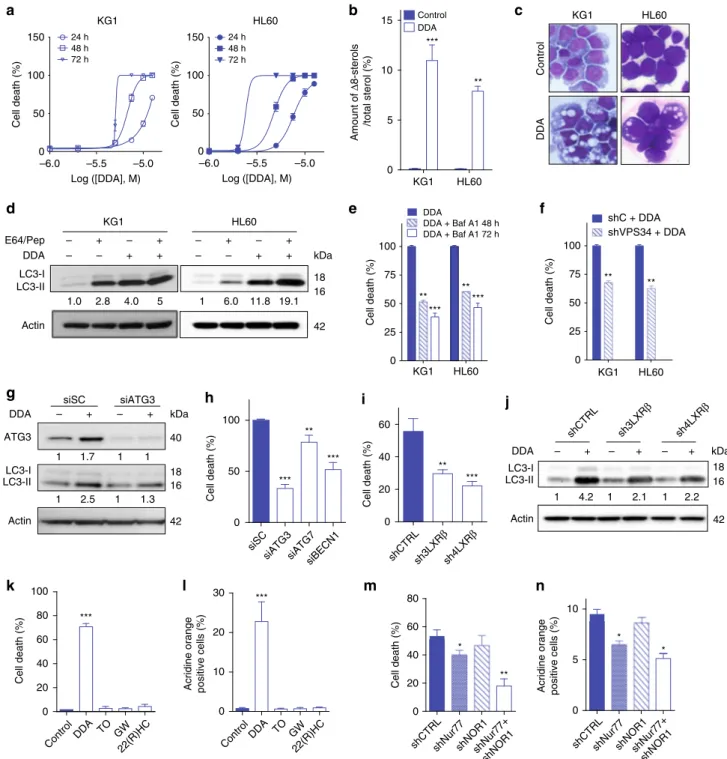
Fig. 6 DDA induces lethal autophagy in AML cells via LXRβ. a DDA-induced cell death in KG1 and HL60 cells was determined over time as in Fig.1b.b Quantification of the Δ8-sterols that had accumulated in KG1 and HL60 cells treated without or with 2.5 µM DDA. c May–Grünwald–Giemsa staining of KG1 and HL60 cells treated or not with DDA.d Immunoblots of LC3 proteins in cells treated or not with 2.5µM DDA, and E64 + pepstatin A (Pep). e Effect of the pharmacological inhibitor of autophagy Baf A1 on DDA cytotoxicity at 48 and 72 h.f DDA cytotoxicity in KG1 or HL60 cells permanently transfected with control shRNA (shC) or shRNA against VPS34 (shVPS34) after 72 h treatment.g Immunoblots of ATG3 and LC3 proteins in KG1 cells transfected with control scramble siRNA (siSC) or siRNA against ATG3 (siATG3). Seventy-two hours after transfection, cells were treated for 24 h with 5µM DDA. h Analysis of DDA cytotoxicity in KG1 cells transfected with control scramble siRNA (siSC), siATG3, siATG7, or siBECN1. Seventy-two hours after transfection, cells were treated for 24 h with 5µM DDA. i Analysis of DDA cytotoxicity in KG1 cells transfected with shCTRL, sh3LXRβ, or sh4LXRβ. Cells were treated for 24 h with 5µM DDA or vehicle. j Immunoblots of LC3 protein expression in cells transfected with shCTRL, sh3LXRβ, or sh4LXRβ and treated with 5µM DDA or vehicle for 24 h. Analysis of the cytotoxicity k and acridine orange-positive vesicles l in KG1 cells treated or not with 5 µM DDA, 2µM TO, 2 µM GW, or 10 µM 22(R)HC. The presence of Nur77 and NOR1 is required in DDA cytotoxicity (m) and autophagy (n). Data from a, b, e, f, h, i, k, l, m, n are the means± S.E.M. of three experiments performed in triplicate, *P < 0.05, **P < 0.01, ***P < 0.001 t-test. All images and densitometry values are representative of three independent experiments
gene. DDA decreased LXRβ-binding to a TFEB enhancer and
stimulates TFEB expression dose-dependently (Fig.
3j), 22(R)HC
did the opposite, suggesting that LXRβ and LXRβ agonists act as
repressors of TFEB and that DDA de-repressed this gene. Finally,
the activation of TFEB expression by DDA increased the activity
of a TFEB-dependent gene reporter assay (Fig.
3k)
dose-shCTRL
a
b
c
0 5 10 15 0 500 1000 1500 Control DDA *** Days KG1 tumor volume (mm 3) sh3LXRβ 0 5 10 15 0 1000 2000 Control DDA Days KG1 tumor volume (mm 3) KG1 tumor volume (mm 3) sh4LXRβ 0 5 10 15 0 500 1000 1500 Control DDA Days 20 40 60 0 20 40 60 80 100 Vehicle DDA (p.o.) * DaysDisease - free survival (%)
40 50 60 70 80 ** HL60 viability (% in BM and BR) 0 2 4 6 ** HL60 annexin-V+ (million in BM+BR)
d
g
h
f
i
j
k
20 40 60 80 100 Sensitive Insensitive DNR DDA + – + – – + – +AML bulk viability (%)
20 40 60 80 100 Sensitive Insensitive DNR DDA + – + – – + – + Progenitor/LSC viability (%) 20 40 60 80 100 Sensitive Insensitive Cytarabine DDA + – + – – + – +
AML bulk viability (%)
20 40 60 80 100 Insensitive Cytarabine DDA + – + – – + – + Sensitive Progenitor/LSC viability (%) 0 50 100 AML Bulk Progenitor/LSC 0.1 1 10 DDA (μM) Cell viability (%) 0 50 100 AML bulk Progenitor/LSC 0.1 1 10 100 1000 * Cytarabine (μM) Cell viability (%)
e
1 2 4 8 16 FLT3-ITD NPMc – – – – + + + + LR IR HR 1 2 4 8 * IC 50 DDA ( μ M) CFU-L=0 CFU-L<10 000CFU-L>10 000 1 2 4 8 16 ** IC 50 DDA ( μ M) <10 G/L 10-100G/L>100 G/L 1 2 4 8 16 Control DDAl
ControlDDA (i.p.)DDA (p.o.) ControlDDA (i.p.)DDA (p.o.)
IC 50 DDA ( μ M) IC 50 DDA ( μ M)
Fig. 7 DDA induces an LXRβ-, Nur77-, and NOR1-dependent lethal autophagy in AML. a Tumor volume curves of xenografts of cells transfected with shCTRL, sh3LXRβ, and sh4LXRβ and implanted into NOD/SCID mice (20 per group) who were then treated daily with DDA (20 mg/kg/day, i.p.) or solvent vehicle.b HL60 cells were injected i.v. into irradiated NSG mice (n = 10 per group) who were then treated daily with DDA (20 mg/kg/day, i.p. or 40 mg/ kg/day, p.o.) for 16 days. Analyses of HL60 cell contents and viability in bone marrow (BM) and brain (BR) of NSG mice. Cells were quantified by flow cytometry using human anti-CD45 and human anti-CD33 antibodies (left panel) and viability was determined by Annexin-V staining (right panel).c Overall survival was determined for NSG mice (n = 10 per group) engrafted with HL60 cells and treated, after disease establishment, with control (vehicle) or DDA (40 mg/kg/day, p.o.), *P < 0.05, log-rank test. Samples from AML patients (n = 61, Supplementary Data 1) were exposed to increasing concentrations of DDA (d) or cytarabine (e) for 48 h. Cell death was assessed both in the AML bulk and in the progenitor/LSC cells (CD34+CD38−CD123 +) using Annexin-V/7AAD staining. Data are represented as the percentage of survival. Scatter plots comparing DDA efficacy in primary AML patients according tof their prognostic risk category (LR: low risk, IR: intermediate risk, and HR: high risk), g CFU-L formation, h total white blood count, and i their Flt3-ITD and NMP1 status. Samples from AML patients were exposed to 10 nM daunorubicin (DNR)j or 100µM cytarabine k with or without 5 µM DDA for 72 h.“daunorubicin insensitive” or “cytarabine insensitive” when cell death was lower than 20%, and “sensitive” when cell death was over 70%. Bars represent S.E.M.l Images of primary AML cells stained with MGG after treatment with vehicle or DDA for 24 h. Images are representative of three independent experiments. Data from a-e are means± S.E.M., and is representative of 3–5 independent experiments, **P < 0.01, t-test. d–k Bars represent S. E.M., *P < 0.05, t-test
dependently showing that DDA stimulated the transcriptional
activity of TFEB. TFEB is a master transcription factor controlling
genes involved in autophagy and lysosome organization and
biogenesis
31–34. These data revealed that LXR through DDA
binding appears as a new player in autophagy and Ly biogenesis.
Our results suggest that part of autophagy induction by DDA
could be mediated through the de-repression of TFEB by the
direct inhibition of LXRβ binding, in addition to the direct
sti-mulation of the expression of NR4As genes by LXRβ.
We investigated the role of LXRβ in lethal autophagy mediated
by DDA. In B16F10 and SKMEL-28 cells, KD of LXRβ expression
significantly decreased DDA-induced cell death (Fig.
3l). In
contrast, 22(R)HC, TO, and GW had no impact on cell death
(Fig.
3m), consistent with work from Pencheva et al.
35and
partially reversed DDA cytotoxicity (Fig.
3m). As expected, we
found that TO decreased the stimulation of autophagic vesicles
formation by DDA (Fig.
3n). Altogether, these data establish that
LXRβ controls DDA-induced lethal autophagy and NOR1, Nur77
and LC3 expression, and that DDA activity is distinct to that of
the 22(R)HC, TO and GW LXR ligands.
LXR
β is necessary for DDA anti-melanoma action in vivo.
DDA significantly reduced the growth of human and mouse
melanoma tumors established in mice (Fig.
4a, b). Western blot
analysis of tumor samples revealed an increased expression of
Nur77, NOR1, and LC3-II in DDA-treated tumors compared to
controls (Fig.
4a, b). This was confirmed by histochemical
ana-lysis of human SKMEL-28 tumors, where LC3-II appeared as
brown puncta in the cytoplasm of cells from DDA-treated tumors
(Fig.
4c). To determine whether LXRβ is involved in the
anti-tumor activity of DDA in vivo, LXRβ was knocked down in
SKMEL-28 cells using two different shRNA targeting LXRβ. Two
clones (sh3LXRβ and sh4LXRβ), each with ~80% reduction in
LXRβ mRNA and protein expression, were selected
(Supple-mentary Fig.
4i) and both showed a lower capacity to induce
LC3-II expression upon DDA treatment compared to control shRNA
(shCTRL) (Supplementary Fig.
4j). The ultrastructure analysis of
sh3LXRβ or sh4LXRβ cells treated with DDA revealed that DDA
triggered the formation of Ly and amphisomes (AM) but not AL
(Fig.
4d, e; Supplementary Fig.
5). This is in contrast to
shCTRL-treated cells in which DDA induced AL, in addition to Ly and
AM (Fig.
4d, e; Supplementary Fig.
5), and indicates that the
DDA-mediated fusion between Ly and AM and between Ly and
AP to form AL is LXRβ-dependent. In vivo, DDA significantly
reduced the growth of established shCTRL tumors, but not that of
shLXRβ tumors (Fig.
5a). Western blot analysis of tumor samples
showed that DDA increased the levels of Nur77, NOR1, and
LC3-II in shCTRL tumors and that these effects were decreased in
shLXRβ tumors (Fig.
5b). We found that TO partially reversed
the inhibition of tumor growth induced by DDA on melanoma
cells (Fig.
5c, d). Analyses of the sterol profile in tumors
con-firmed the accumulation of Δ8-sterols in tumors, whereas no
increase in 5,6-EC was measured (Fig.
5c, d) as observed on
in vitro tests. LXRβ is the predominant isotype expressed in
melanoma cells
35–38and analyses of the TCGA dataset expression
(Fig.
5e) corroborate these observations and supporting the
importance of LXRβ targeting in melanoma cells. Altogether,
these data demonstrate that LXRβ is essential to the induction of
DDA-mediated lethal autophagy in vivo through the expression
of LC3, Nur77, and NOR1.
DDA triggers lethal autophagy in AML cells. In mice, the
abrogation of Nur77 and NOR1 has been shown to induce AML
development
39. The ability of DDA to reinstate the expression of
these two factors in melanoma cells prompted us to assess the
efficacy of DDA in inhibiting the progression of AML. In HL60
and KG1, two representative AML cell lines, DDA treatment
triggered cell death (Fig.
6a), the accumulation of
Δ8-sterols
(Fig.
6b), the appearance of autophagic characteristics (Fig.
6c;
Supplementary Fig.
6a–d), and autophagic flux (Fig.
6d). DDA
also induced apoptotic characteristics (Supplementary Fig.
6e–i),
however the caspase inhibitor z-VAD-fmk only weakly affected
its cytotoxicity (Supplementary Fig.
6j). Both the pharmacological
inhibition of autophagy and stable VPS34 KD significantly
blocked DDA-induced cell death in long-term assays (Fig.
6e, f;
Supplementary Fig.
6k). The KD of other autophagic proteins,
ATG3, ATG7, BECN1, also inhibited cell death induced by DDA
(Fig.
6g, h; supplementary Fig.
6l). LXRα and LXRβ were
expressed in the two tested AML cell lines, but LXRα was weakly
expressed compared to LXRβ (Supplementary Fig.
6m). Their KD
(Supplementary Fig.
6n, o) showed that LXRβ mediated
DDA-induced cell death (Fig.
6i; Supplementary Fig.
6n) and autophagy
(Fig.
6j; Supplementary Fig.
6q, r) in these cells, which does not
rule out a possible contribution of LXRα. LXR agonists were
inefficient at inducing death and autophagy in AML cells (Fig.
6k,
l; Supplementary Fig.
6s) and led to only a weak expression of
Nur77 and NOR1 relative to DDA treatment (Supplementary
Fig.
6t). In addition, Nur77 and NOR1 expression were induced
by DDA in an LXRβ-dependent manner (Supplementary Fig.
7a,
b), and both were required to control lethal autophagy (Fig.
6m,
n; Supplementary Fig.
7c).
DDA triggers an LXR
β-dependent lethal autophagy in AML.
DDA significantly reduced the growth and weight of KG1 or
HL60 tumors implanted into NOD/SCID and nude mice
(Sup-plementary Fig.
7d–f), and modulated the expression of
autop-hagy markers LC3-II, P62 as well as Nur77 and NOR1
(Supplementary Fig.
7g). These effects were abrogated in
LXRβ-KD KG1 cells but not in shCTRL cells (Fig.
7a; Supplementary
Fig.
7h). DDA was found to accumulate in tumors
(Supplemen-tary Fig.
7f). The efficacy of DDA treatment (i.p. or p.o.) was
evaluated in HL60 cells orthotopically engrafted (i.v.) into NOD/
SCID/IL2rg (NSG) mice. Flow cytometry analysis using the
human CD45 and CD33 markers revealed that DDA significantly
reduced the number of HL60 cells (60.5
± 11% for i.p. and 47 ±
9% for p.o.) and their viability (21.9
± 6 % for i.p. and 17.3 ± 5 %
for p.o.) in the bone marrow (BM) and brain (BR) (Fig.
7b).
Importantly, DDA treatment significantly improved the survival
of HL60-engrafted mice (Fig.
7c). To validate these results in
AML patient tumors, we tested the effects of DDA on a panel of
61 AML patient samples (Supplementary Data
1). DDA
sig-nificantly reduced cell viability (Fig.
7d) with a median IC
50of 3.3
µM and a range of 1.2–11.3 µM. In contrast to the widely used
AML drug cytarabine, DDA was as efficient at reducing viability
in the progenitor/leukemic stem cell (LSC) (CD34+CD38−
CD123+) subpopulation as in the AML bulk patient samples, and
was 100-fold more efficient than cytarabine (Fig.
7e).
Interest-ingly, the activity of DDA on AML patient samples did not
correlate with the cytogenetic risk, clonogenic properties, white
blood cell count or FLT3-ITD and NPM1 mutational status
(Fig.
7f–i). In addition, AML patient samples were sensitive to
DDA irrespective of their sensitivity to the two clinically used
AML drugs daunorubicin (DNR) and cytarabine (Fig.
7j, k).
LXRβ is the predominant isotype expressed in leukemia cell
lines
38, which is corroborate by the analyses of the TCGA dataset
(Supplementary Fig.
7j) supporting the importance of LXRβ
targeting in AML cells. The treatment of primary AML patient
samples with DDA revealed a massive vacuolation of cells
(Fig.
7l) that was associated with increased LC3-II, Nur77 and
These experiments suggest that the mechanism of action of
DDA elucidated in AML cell lines and xenografts is conserved in
AML patient samples.
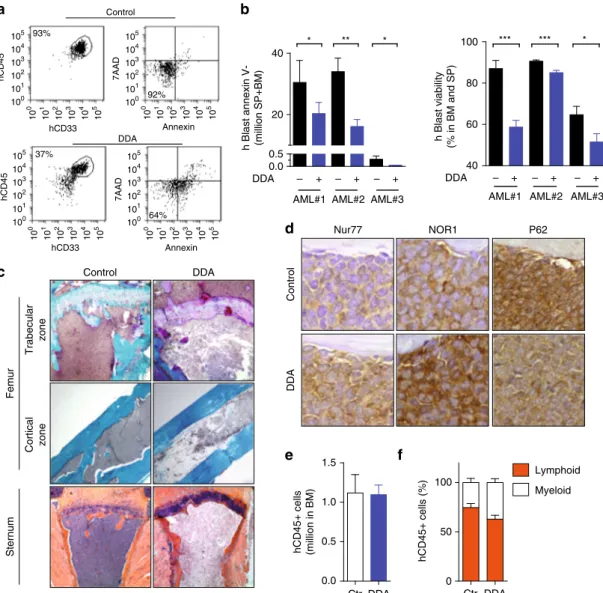
DDA is active on patient-derived AML xenografted in mice. To
determine the efficacy of DDA in a relevant model of established
disease, primary AML cells from three patients were
orthotopi-cally engrafted (i.v.) into NSG mice. DDA significantly reduced
the leukemic burden, the number of AML cells (−57 ± 15%) and
their viability (−19.6 ± 7.6%) in both the bone marrow (BM) and
spleen (SP), compared to controls (Fig.
8a, b). Histological
ana-lysis of the femur and sternum showed that control mice were
completely packed with human primary AML cells in contrast to
DDA-treated mice (Fig.
8c). BM recovered from DDA-treated
mice showed high expression levels of Nur77 and NOR1 and
decreased levels of the marker of autophagy degradation, P62,
compared to controls (Fig.
8d). Importantly, DDA had no effect
on normal hematopoietic progenitor cells derived from human
BM engrafted into NSG mice (Fig.
8e). The percentage of
lym-phoid (CD45
+CD19
+) and myeloid (CD45
+CD33
+) cells was
not significantly different between DDA-treated and control mice
(Fig.
8f). The pharmacokinetics of DDA was also determined in
NSG mice after i.v., i.p. or p.o. administration. DDA plasma
concentrations showed a
flip-flop pharmacokinetic profile
(Sup-plementary Fig.
8a, b), with elimination being far quicker than
absorption (t
1/2were 1.0 h vs 43 h for p.o and 0.9 h vs 19 h. for i.p.
administration). The maximum sera concentrations (C
max) were
5.05
µM ± 0.87 µM for p.o and 6.10 ± 0.95 µM. for i.p.
adminis-tration (Supplementary Fig.
8c). The calculated bioavailability of
DDA, according to the area under curve methodology, was
around 100% for p.o. and i.p. administration compared to i.v.
a
b
Cortical zone Trabecular zone Control DDA Sternum Femurd
Control DDAe
Control DDA P62 Nur77 NOR1f
c
0.0 0.5 20 40 * ** * DDA – + – + – +h Blast annexin V- (million SP+BM)
40 60 80 100 *** *** * DDA – + – + – + h Blast viability (% in BM and SP) 0.0 0.5 1.0 1.5 hCD45+ cells (million in BM) 0 50 100 Lymphoid Myeloid hCD45+ cells (%) hCD45 hCD33 Annexin 7AAD hCD33 Annexin 7AAD hCD45 105 10 5 104 10 4 103 10 3 102 10 2 101 10 1 100 10 0 105 10 5 104 10 4 103 10 3 102 10 2 101 10 1 100 10 0 105 10 5 104 10 4 103 10 3 102 10 2 101 10 1 100 10 0 105 10 5 104 10 4 103 10 3 102 10 2 101 10 1 100 10 0 93% 92% 37% 64%
AML#1 AML#2 AML#3 AML#1 AML#2 AML#3
DDA
Ctr Ctr DDA
Fig. 8 DDA exerts anti-leukemic activity in vivo in patient AML samples. Primary cells from AML patients were injected i.p. into irradiated NSG mice (three AML patients were tested separately). After validation of tumor engraftment, mice were treated with DDA (20 mg/kg/d, i.p.) or control (vehicle) for 19 days.a Representativeflow cytometry analysis showing the selection of the human AML population (hCD45+hCD33+) and analysis of cell viability by Annexin-V/7AAD staining.b Human leukemic cell content in the hind limb bone marrow (BM) and spleen (SP) was measured byflow cytometry using human anti-CD45 and anti-CD33 antibodies. The viability of human CD45+CD33+ cells was determined by Annexin-V staining andflow cytometry analysis, *P < 0.05, **P < 0.01, ***P < 0.001, t-test. c Histological analysis of femur and sternum sections from mice injected with primary AML cells (AML#1), stained with Goldner (femur) and HE (sternum).d Histological analysis of bone marrow staining for Nur77, NOR1, and P62. Normal human CD34+ cells from a healthy donor were implanted intravenously into NSG mice and treated with vehicle or DDA for 3 weeks (20 mg/kg/day, i.p.).e Engraftment was quantified by assessing the percentage of hCD45+ cells in the BM. f The percentage of human myeloid (CD45+/CD33+) and lymphoid (CD45+/CD19+) cells was determined byflow cytometry. e, f Bars represent S.E.M
These concentrations correspond to active in vitro
concentra-tions. After 21 days of treating NSG mice with DDA, DDA
concentrations had risen to 1.32
± 0.03 µM in the SP and 3.48 ±
0.53
µM in the BM (Supplementary Fig.
8d). These experiments
demonstrate that in these experiments DDA was present at an
active dose at the site of the origin and development of malignant
myeloid progenitors, in accordance with its efficacy.
Discussion
In the present study we provide evidence that DDA, a natural
metabolite of cholesterol and histamine found in mammals,
presents potent anti-tumor activities against melanoma and AML.
These effects have been demonstrated both in vitro and in vivo,
and include patient-derived xenografts, where DDA reduced
tumor cell viability without causing toxic effects on the in vivo
hematopoietic functions of normal human CD34+ progenitors.
DDA was found to trigger lethal autophagy through an original
mechanism by stimulating the expression of the pro-autophagic
factors Nur77, NOR1, and LC3-II under the control of LXRβ. The
screening of 61 different primary AML tumors from patients
revealed that DDA is active in samples with high risk features
including chemoresistance, molecular (FLT3-ITD) or cytogenetic
(unfavorable karyotypes) lesions. Moreover, unlike cytarabine,
DDA has a significant efficacy on the progenitor/LSC
sub-compartment. In melanoma, the mechanism we have described
seems to be independent of the constitutive Braf signaling
path-way, thus our results indicate that DDA may offer an alternative
route to improving therapies for these cancers.
We have established that DDA is a ligand of both LXR
iso-forms. In both melanoma and AML tumor models, we have
shown that LXRβ is essential for mediating DDA-induced lethal
autophagy. This is distinct from the three canonical LXR ligands
tested, which did not stimulate lethal autophagy and did not or
only weakly activated the transcription of the Nur77, NOR1, and
LC3 genes. Moreover, the other LXR ligands tested did not inhibit
D8D7I and caused zymostenol and 8-dehydrocholesterol
accu-mulation, whereas the accumulation of these
Δ8-sterols following
DDA treatment contributed to the formation of Ly. Thus, the
combined action of DDA on LXR and D8D7I most likely
con-tributes to its high efficacy in triggering sustained lethal
autop-hagy (Fig.
9), which is not observed with prototypical ChEH/
D8D7I inhibitors or other LXR agonists.
Several studies have provided evidence that the LXRs are
involved in the growth control of tumors and/or metastasis by
acting on both the tumor cells themselves and their
micro-environment
3,36, 40–44, and LXR activation has been shown to
have an effect on cell cycle arrest or apoptosis in different cancer
cell lines and tumors
45,46. The inhibition of LXR-mediated
gly-colysis and lipogenesis by an inverse agonist ligand in colon
cancer was also found to be associated with tumor growth
inhi-bition and apoptosis
47. Interestingly, synthetic LXR agonists such
as GW inhibit primary melanoma progression by activating
stromal LXRβ and causing ApoE secretion (a melanoma-extrinsic
event), whereas their effects on metastasis are mediated through
ApoE secretion in both the tumoral and stromal compartments
35.
We describe here that DDA controls melanoma and AML tumor
progression through a distinct mechanism that has not been
previously reported for a LXR ligand, and which involves
tumor-intrinsic LXR activation to mediate lethal autophagy. In addition,
our study revealed a yet unprecedentedly described relationship
between LXR and the control of the expression of genes involved
in autophagy and Ly biogenesis.
Autophagy is a well established survival mechanism that helps
cells to escape to death and is also a mechanism of resistance to
chemotherapy and endocrine therapies
22, 23,48–50. ChEH
inhi-bitors Tam and PBPE stimulate a protective autophagy in
mel-anoma cells and other cancer cells through D8D7I inhibition and
Δ8-sterols accumulation
14,15,17, 23. We report here that DDA
mechanisms are different from these compounds. DDA inhibits
D8D7I leading to
Δ8-sterols accumulation and additionally binds
to LXR and stimulate the expression of pro-autophagic genes.
Thus, the activation of a multiple autophagic regulatory circuitry
through new mechanisms with a single molecule may account for
lethal autophagy as observed through combination therapy
approaches
22,51.
Advanced melanoma remains a fatal cancer with poor patient
survival rates despite the development of immune checkpoint
inhibitors and mutant Braf-targeted therapies, which despite
having significantly improved relapse-free survival still encounter
high levels of drug resistance and toxicity for immunotherapy
52,53
. For decades, the therapeutic backbone of AML treatment has
remained a combination of two genotoxic agents, namely
dau-norubicin and cytarabine, which induce fairly good remission
rates but are unfortunately followed by frequent relapse, resulting
in a poor outcome in most cases
54. The prognosis for older AML
D8D7I/ChEH DDA Ly Δ8-sterols HO HO HN N H N DDA Nur77 Nor1 LC3 LXRβ/RXR LC3-II AP Lethal autophagy AM AL LXRβ TFEB
Fig. 9 Molecular mechanisms through which DDA induced lethal autophagy in cancer cells. D8D7I, 3β-hydroxysterol-Δ8,7-isomerase; ChEH, cholesterol-5,6-epoxide hydrolase;Δ8-sterols, zymostenol and 8-DHC; Ly, lysosome; AM, amphisome; AL, autolysosome; AP, autophagosome
patients who are deemed unfit for chemotherapy is even worse.
Thus, there is an urgent need to develop innovative therapies to
improve the outcome of AML.
In conclusion, our results demonstrate the anti-melanoma and
anti-AML efficacy of DDA that is independent of apoptosis and
of the molecular and cytogenetic classifications of these cancers,
and support the clinical evaluation of this new class of molecule.
More generally, this study reveals the novel pharmacological
control of lethal autophagy by a nuclear receptor through the
action of a cholesterol metabolite.
Methods
Materials. Chemicals and solvents were from Sigma unless otherwise specified. The caspase inhibitors z-VAD and z-DEVD-fmk were from Calbiochem. DDA and d6-DDA (DDA) were synthesized as previously described5and were confirmed as
99% pure by LC/MS. The compounds C17, C31, C41 and C51 were synthesized according to previously published procedures5,9,55and were confirmed as 99%
pure by LC/MS. PBPE was synthesized as described previously56.
Cell culture. HEK293T, B16F10 (Braf WT)57, A375, WM35, WM-266-4, WM115, SKMEL-2, SKMEL-28 (Braf V600E mutated)58, KG1 and HL60 cells were from the American Tissue Culture Collection and were cultured until passage 20–30. Cell lines were tested each month for mycoplasma contamination using MYCOALERT DETECTION Kit (Lonza, France). All cell lines were grown in a humidified atmosphere with 5% CO2at 37 °C in media containing 10% FBS (2% for WM35,
20% for KG1), penicillin and streptomycin (50 U/ml each) and 1.2 mM glutamine (3.2 mM for B16F10 and SKMEL-28). SKMEL-28 cells were grown in RPMI-1640 supplemented with heat-inactivated FBS. HEK293T, B16F10, A375, WM-266-4 and WM115 cells were grown in DMEM. WM35 cells were grown in a 4:1 mix of MCDB153:L15 with 5µg/ml insulin and 1.68 µM CaCl2. SKMEL-2 cells were
grown in Eagle’s Minimum Essential Medium. HL60 and KG1 cells and their transfectants were cultured in RPMI-1640 and IMDM medium respectively. Mouse embryonicfibroblasts (MEF) were derived from 13.5 dpc wild type or Lxrβ−/− embryos, as previously described59. Briefly, the dorsal part of the dissected embryos were sliced and incubated with a PBS trypsin-EDTA digestion mix (Sigma-Aldrich) at 37 °C for 45 min. These solutions were then homogenized using a syringe with a 19 G needle and plated onto DMEM (Sigma-Aldrich) supplemented with 10% FCS (Biowest), 2 mM glutamine (Sigma-Aldrich), MEM non-essential amino acid solution (Sigma-Aldrich), 100µg/ml streptomycin (Sigma-Aldrich) and 100 µg/ml penicillin (Sigma-Aldrich). MEFs were repeatedly split upon confluency until they reached a period of massive senescence. Then, after 2 months of culture they regrew normally and were considered to be auto-immortalized.
Animals. Mice were handled and cared for according to the ethical guidelines of our institution and following the Guide for the Care and Use of Laboratory Ani-mals (National Research Council, 1996) and the European Directive EEC/86/609, under the supervision of authorized investigators. All mice were maintained in specific pathogen-free conditions and were only included in protocols following 2 weeks of quarantine. NSG mice (NOD/LtSz-scid IL2Rγc null), NOD/SCID mice (NOD.CB17-Prkdcscid/), Nude mice (NU/NU) and C57Black6 mice were from Charles River Laboratories, Saint-Germain-sur-L’Arbresle, France.
Assessment of apoptosis morphology. After treatment with or without DDA for 24 h, cells grown on glass coverslips were washed once with ice-cold PBS thenfixed with 1 ml of 4% paraformaldehyde for 20 min and washed once again with ice-cold PBS. The cells were then incubated with 1 ml PBS containing 300 nmol/l DAPI (Roche) for 10 min, washed twice with PBS and observed byfluorescence microscopy.
Cell death assay. Melanoma cells were seeded into 6-well plates at 60,000 cells per well and AML cells at 250,000 cells/ml. The cells were then treated with control solvent vehicle (1/1000 ethanol in water) or DDA. Where indicated, treated cells were incubated in the presence or absence of each inhibitor for time shown. Cell death was determined by the trypan blue exclusion assay. Cells were scraped and resuspended in trypan blue solution (0.25% (w/v) in PBS) and counted in a Malassez cell under light microscopy. Cell viability was then quantified by counting viable (trypan blue-negative) and dead cells (trypan blue-positive).
Cytofluorometric analysis of melanoma cells. To measure the ΔΨm, cells were incubated at 37 °C for 15 min in the presence of 40 nM DiOC6(3) (Molecular Probes) with or without 100 mM carbonyl cyanide m-chlorophenylhydrazone (CCCP). To determine superoxide anion generation, cells were kept at 37 °C for 15 min in the presence of 10 mM HE (Molecular Probes). After incubation with DiOC6(3) or HE, the cells were immediately analyzed byflow cytometry on a BD Facscaliburflow cytometer (BD Biosciences). DiOC6(3) was excited at 488 nm and
detected at 525 nm. HE was excited at 490 nm and detected at 620 nm. The median fluorescence intensity was quantified by FlowJo software.
Cell cycle analysis. Control and DDA-treated cells werefixed in 70% ethanol and then washed with PBS. Cells were incubated with 100μg/ml RNase A for 30 min at 37 °C, permeabilized with 0.25% Tween-20, and stained with 50μg/ml propidium iodide (PI) for 30 min at 37 °C. The DNA content of stained cells was analyzed by flow cytometry. The fraction of cells in sub-G1 phase was calculated using flowJo software (Ashland, Oregon). Data were obtained from 105viable cells.
Annexin-V and PI staining. Double staining for Annexin-V–FITC binding and DNA using PI was carried out in B16F10 and SKMEL-28 cells exposed to ethanol or DDA. Cells were washed in PBS and resuspended in the binding buffer (10 mM HEPES, 140 mM NaCl, 2.5 mM CaCl2, 0.1% bovine serum albumin, pH 7.4). Cell
suspensions were then incubated on ice with Annexin-V-FITC (Southern Biotech, Birmingham, AL, USA). After 15 min, an additional 380μl of the binding buffer was added, followed by 0.5 mg/ml PI immediately before analysis with a BD Facscaliburflow cytometer (BD Biosciences). The percentage of Annexin-V–FITC/ PI-positive cells was determined using CellQuest software (BD Biosciences). NR and co-regulators PCR Arrays. Human and mouse Nuclear Receptors & Co-regulators RT2Profiler™ PCR arrays were used to profile the expression of 84 genes encoding NR and their co-regulators (PAHS-056Y and PAMM-056Y, SABiosciences, USA), according to the manufacturer’s instructions. COPS2 pri-mers were replaced with NR4A3 pripri-mers in both arrays. qPCRs were run on an icycler iQTMReal-Time Detection system (Bio-Rad). The relative abundance of each mRNA species was assessed following the manufacture’s recommendations. Oxysterol analysis. Oxysterol analysis in cell lines and tumors were done as previously described12with modifications60.
Microscopic autoradiography. Cells were incubated with 1µM [14C]-DDA for 6 h. Cells were washed with PBS and worked up as reported above. For TEM autoradiography the sections were covered with a thin carbon membrane and photographic emulsion (L4; Ilford, Limited Moberly Cheshire, England). After 12 weeks of exposure at 4 °C, the sections were developed (Kodak D19),fixed (30% Na-thiosulphate, pentahydrate, Merck 6516; Darmstadt, Germany), and evaluated by TEM (Philips, CM 100).
Sterol analysis. Sterols in cell homogenates were extracted with a solvent mixture containing chloroform/methanol 2/1 (v/v) spiked with epicoprostanol as the internal standard. Lipids were partitioned in chloroform after the addition of saline and saponified by methanolic potassium hydroxide (0.5 N, 60 °C, 15 min). The fatty acids released were methylated with BF3-methanol (12%, 60 °C, 15 min) to not interfere with the chromatography of sterols. The sterols were re-extracted in hexane and silylated, as described previously61. The trimethylsilylether derivatives
of the sterols were separated by gas chromatography (GC) (Hewlett–Packard 6890 series) in a medium polarity capillary column RTX-65, (65% diphenyl 35% dimethyl polysiloxane, length 30 m, diameter 0.32 mm,film thickness 0.25 μm (Restesk, Evry, France)). The mass spectrometer (Agilent 5975 inert XL) in series with the GC was set up for the detection of positive ions. Ions were produced in the electron impact mode at 70 eV. Sterols were identified by the fragmentogram in the scanning mode and quantified by selective monitoring of the specific ions after normalization with the internal standard epicoprostanol and calibration with weighed standards.
Filipin and Lamp1 staining. Cells (75,000 per well) grown on glass coverslips were treated with 2.5µM DDA for 48 h or with the solvent vehicle. Filipin staining was realized as described in15. For Lamp1 and Filipin staining, cells werefixed with
3.7% paraformaldehyde for 15 min at room temperature (RT), washed with PBS and permeabilized with 0.05% saponin in PBS with 1% BSA for 15 min. Cells were then washed with PBS and incubated for 1 h at RT with an anti-Lamp1 antibody (ab24170, Abcam, 1/500) (antibodies are listed on supplementary Table4). After washing with PBS containing 0.05% saponin and 1% BSA, cells were incubated for 1 h at RT with Alexafluor 488 conjugated-goat anti-rabbit antibodies (A-11008, Thermo Fisher Scientific). Cells were then washed with PBS containing 0.05% saponin and 1% BSA and incubated with Filipin (50µg/ml, Sigma) for 75 min at RT before washing twice with PBS. Fluorescence images of cells were acquired with an LSM 780 (Zeiss) confocal microscope and a 63X Plan-Apochromat objectif (1.4 oil), equipped with a diode at 405 nm and an argon laser at 488 nm.
Ultrastructural analysis. Cells werefixed with 2% glutaraldehyde in 0.1 M Sor-ensen’s phosphate buffer (pH 7.4) for 1 h and washed with the SorSor-ensen’s phos-phate buffer (0.1 M) for 12 h. The cells were then post-fixed with 1% OsO4in
Sorensen’s phosphate buffer (Sorensen’s phosphate 0.05 M, glucose 0.25 M, OsO4
1%) for 1 h, then washed twice with distilled water and pre-stained with an aqueous solution of 2% uranyl acetate for 12 h. Samples were then treated exactly as