Orchard Park Public Housing Project
by
Kerry Ann McNally B.A., Rider College
(1969)
SUBMITTED TO THE DEPARTMENT OF
URBAN STUDIES AND PLANNING
IN PARTIAL FULFILLMENT OF THE REQUIREMENTS OF THE
DEGREE OF
MASTER IN CITY PLANNING
at the
MASSACHUSETTS INSTITUTE OF TECHNOLOGY
June 1981
®)Kerry Ann
McNally 1981
The author hereby grants to M.I.T. permission to reproduce and
to distribute copies of this thesis document in whole or in part.
Signature of Author
Department of tWban Studies and Flanning June 1, 1981 Certified by Langley C. Keyes Thesis Supervisor Accepted by Langley C. Keyes Chairman, Departmental Graduate Committee
krChiVG
MASSACHUSETTS INSTITUTEOF TECHNOLOGY
JUL 27 1981
LIBBAPIESALTERNATIVE REDEVELOPMENT OPTIONS FOR THE
ORCHARD PARK PUBLIC HOUSING PROJECT by
KERRY ANN MCNALLY
Submitted to the Department of Urban Studies and Planning on May 26, 1981 in partial fulfillment of the requirements for the Degree of Master of
City Planning ABSTRACT
This study analyzes the problems affecting Orchard Park, a large, federally-supported public housing project, which is owned and operated by the Boston Housing Authority
(BHA). Socio-economic study of the neighborhood is included to determine whether the neighborhood has a positive or negative impact on the project. Community plans and development are
described in order to show the existing approaches to problem solutions.
The problem faced by the BHA is how to restore Orchard Park in light of federal cutbacks and the developments in the neighborhood. Findings show that Orchard Park, socially, physi-cally and economiphysi-cally, is more distressed when compared to
other BHA family developments; that the BHA may face a 30%
cutback in federal operating revenue within a year; and that the residential neighborhood shows widespread disinvestment and
abandonment. While the residential neighborhood to the south of Orchard Park has architectural qualities and city programs that may lead to a revitalization, the area abutting Orchard Park does not have similar amenities. The area surrounding Orchard Park is designated by the city for economic redevelop-ment. Some new industries have located there, but no job com-mitments have come to Orchard Park tenants to date.
This study concludes that if the economic revitali-zation around Orchard Park continues, the BHA should capitalize on it by leasing an unused section of the project for light industrial or manufacturing purposes to companies willing to hire and train project residents. This would provide needed revenue to the BHA without its losing ultimate control over the site. As tenants' income increased, they would graduate from public housing to a lesser subsidy. This would allow more needy people to be served by and passed through public housing. It is also recommended that the BHA purchase some of the aban-doned properties near the project, rehabilitate them and move Orchard Park tenants into them, so that self-improvement would
not force tenants to leave the neighborhood. Cost estimates
are supplied for implementation of the recommendation.
Several areas of inquiry are noted for further study.
These include a financial feasibility study for the intervention
option chosen by the BHA; a survey of project tenants and
neigh-borhood residents as to their preferences for redevelopment of
Orchard Park; a study of wage incentives necessary to draw
Orchard Park tenants off welfare rolls; a study of incentives,
such as wage subsidies, which would encourage companies to hire
project tenants; and legal research and strategies to accomplish
Table of Contents
I.
Introduction.
.
.
.
.
.
.
.
.
.
.
.
.
.
.
.
.
.
1
II. Orchard Park A. Location. . . . . . . . . . . . . . . . .. 4
B. Orchard Park Development. . . . . . . . . . 7
III. Demographic Characteristics of the Orchard Park Residential Neighborhood. . . . 18
IV. Project/Neighborhood Comparison. . . . . . . . 33
V. Neighborhood Housing Programs. . . . . . ... . 36
VI. Neighborhood Economic Development. . . . . . . 40
A. Greater Roxbury Community Development Corporation (GRDC). . 41 B. CrossTown Industrial Park. . . . . . . . . 44
C. Impact of the CrossTown Industrial Park. . 51 VII. Impact of Neighborhood Development on Orchard Park. . . . . . . . . . . . . 57
VIII. Alternative Courses of Action for the BHA. . . 64
IX. Feasibility for the BHA of the Proposed Intervention Alternatives at Orchard Park. . - 72 X. Conclusions and Recommendations. . . . . . . . 84
Footnotes. . . . . . . . . . . . . . . . . . . . . . . 88
Appendices. . . . . . . . . . . . . . . . . . . . . . 95
Orchard Park Orchard Park
Vacancies...
Vacancies and Demand...
1.2.
3.
12. Median Income as a Percentage of Boston
I
toFamil
ie
s. . . .Orchard Park Racial Composition Compared All BHA Family Developments... BHA Families Receiving AFDC ... Minor Population at Orchard Park... Years in Residence - Percentage of Total Change in Total Population... Percent Black Population... Percent of Population under 18 Years... Male/Female Ratio... Percent of Single Women...
13. Unemployment Rates for Population in the Labor Force. 14. Median Years of School Completed... 15. Median House Values, Gross Rents, Vacancies and
Change in Total Number of Housing Units... 16. Percent Owner Occupancy... 17. Moved to Current Residence within: ...
8
9
1012
12
13
20
23
27
27
28
28
28
29
30
31
32
4edian Income 4. 5. 6. 7. 8. 9. 10. 11.List of Maps
1. Orchard Park Location. . . . . . . . . . . . . . . . . 5
2. Zoning in ,Area. . . . . . . . . . . . . . . . . . . . . 14
Key to Zoning Map 2. . . . . . . . . . . . . . . . . . 15
3. Census Tracts. .. ... ... ... 19
4. Strategic Impact Area and CrossTown Industrial Park. 45 5. CrossTown Industrial Park. . . . . . . . . . . . . .. 47
List of Figures 1. Total Population. . . . . . . . . . . . . . . . . . . . 21 2. Total Population . . . . . .. . . . . . . .. ... 22 3. Population Pyramid . . . . . .... . . . . . . . .. 24 4. Population Pyramid. . o. . . .. o. .. . . . . . . . 25 5. Population Pyramid. . . . . . . . . . . . . . . . . . . 26
Acknowledgments
I am grateful to many people for their help and guidance in the production of this study. Langley Keyes was a very persevering and patient advisor. His expertise in public housing proved invaluable in helping me sort out issues and in directing me to pursue aspects of problems I had not considered. I also thank Michael Jacobs, the
Orchard Park planner, for providing insight into the workings of the Boston Housing Authority and for his time, answers to questions and comments on the completed thesis. David Birch's
background in neighborhood and regional change and his
knowledge of the economic climate in the CrossTown Industrial Park were very useful in placing my theories into perspective. I would also like to thank Howard Cohen for suggesting Orchard Park for a research project and for introducing me to people at the BHA so the study could proceed. I am beholden to the M.I.T. faculty, whose courses provided the groundwork for this thesis, and all the people I interviewed for their time and information which were generously given. The M.I.T. librarians were particularly helpful; they always seemed to know which
index to check when information could not be located. Finally, I am grateful to my parents and friends for encouraging me to study urban planning and to complete my degree.
Orchard Park is a public housing project owned and
op-erated by the Boston Housing Authority (BHA).
It is located
in Roxbury near the Dudley Street transit station, Boston
City Hospital and the Southwest Corridor redevelopment area.
The project is included in the Newmarket Economic Development
Area, and as a result, new building is now occurring on the
land abutting it, the so-called CrossTown Industrial Park.
Currently, there are revitalization plans for the nearby
Dudley Station area, which has been designated a Commercial
Area Revitalization District. To the south of Orchard Park
is the Sav-Mor residential neighborhood which has been
tar-geted by the city for housing rehabilitation funds.
The
residential neighborhood immediately surrounding Orchard Park
to the south and east is badly deteriorated, with widespread
disinvestment and abandonment.
The physical condition of Orchard Park, which was built
in 1942, is considered to be one of the worst of the public
housing projects in the city. The project is made up of
3-story structures and contains 737 rental apartments which
are small and overcrowded. Aside from the project's
age-related problems, it suffers from a high level of vandalism,
which results in a large number of broken windows, walls torn
out and copper pipes being stolen. The project has a high
vacancy and turnover rate, a large number of families in
arrears on rents, and lower average rents than other projects.
Relative to other BHA family projects, Orchard Park has a
higher proportion of poor, black families who are on welfare
and a larger number bf young, single,' female heads of
house-holds. Additionally, there is a large dependent population
under the age of 18 years and low educational attainment
among residents.
Compounding these problems, last year the BHA was placed
in receivership by the Suffolk Superior Court because of
vio-lations of the state sanitary code. Further, President
BHA to lose $6.4 million in federal operating expenses, which
would result in a 30% cut in the BHA's administration and
maintenance budgets and a reduction in its 800-person staff
by 320.1 Currently, the BHA has only about $3.1 million for
project stabilization at Orchard Park. These funds will be
exhausted in re-roofing project buildings, repairing the
electrical system, improving the site and relocating tenants.
The BHA does not have large amounts of undesignated funds,
which can be directed toward innovative improvement at
Orchard Park. Other sources of funding such as the city and
the state do not look promising.
At this time the city of
Boston is besieged with its own financial problems in running
its school system so cannot be tapped for financial support
for the BHA.
Different futures can be projected for Orchard Park
de-pending in large part on the way in which the neighborhood
changes around it, and the impact of that change on the
pro-ject. With economic development and neighborhood
revitali-zation efforts occurring not far from Orchard Park, the morale
and spirit may spread to the project, thus augmenting its
stabilization. Alternatively, if noncompatible industrial
uses expand in the area which immediately borders the project,
it may produce a negative impact on the site. Or, Orchard
Park may remain an island unaffected by either revitalization
effort.
The subject for this thesis then is to "analyze th-e area
around Orchard Park, examine the actual and proposed
develop-ment for this area and assess the likely impact on the
pro-ject as a result of these developments.
To help assess those
impacts, the socio-economic make-up of both the project and
neighborhood residents are explored. This "problem analysis"
will be followed by intervention strategies for the BHA to
preserve all or part of Orchard Park and an analysis of their
This thesis does not include detailed surveys of tenant
preferences on redevelopment options. Once financially
feasible development strategies are selected by the BHA,
given its staff and financial resources, tenants should be
included in the choice and design of a final plan. To
pre-sent all
options,- no
-matter
.how
unrealis tid;
to -tenants
before assessing their feasibility, would lead to unmet
expectations and disappointment on the part of project tenants.
Although tenants were not surveyed, their preferences have
been included in this study, as reported by BIA officials,
community planning agencies and representatives of the tenant
organization.
Orchard Park is a large federally supported housing
pro-ject located in Boston's Lower Roxbury neighborhood. Owned
and operated by the BHA, it covers 15.74 acres of land,
con-tains 737 family apartments and houses about 2,258 people.
2The project is situated about five blocks south of
Massa--chusetts Avenue on Harrison Avenue and is divided into two
distinct parts (Map 1).
The wedge-shaped western part of the
development is bounded by Harrison Avenue on the west, Eustis
Street to the north, Ziegler Street to the south and Dearborn
Street to the east. The other segment of the project faces
Albany Street to the northwest, Dearborn Street to the west,
Eustis Street to the southwest, Prescott Street to the south,
Hampden Street to the east and Yeoman Street to the northwest.
On this latter sector of the project is a public middle
school called the Dearborn School and a city-owned playground
called Orchard Park.
The project is served by public transportation via
the M.B.T.A. Orange Line which has a stationonly-two blocks
away at Dudley and Washington Streets. The area is served by
major roads, notably the Southeast Expressway which links it
to Boston to the north and coastal towns to the south. On
the expressway access is provided to Boston's Logan
Interna-tional Airport which is about one-half hour away. The
Massa-chusetts Department of Public Works has recently completed
a crosstown arterial road, a four lane street which runs
between Massachusetts Avenue at City Hospital and Columbus
Avenue at Ruggles Street. The purpose of the Crosstown
Street is to eliminate through traffic from residential
streets and provide access for new businesses planned for the
CrossTown Industrial Park area which abuts Orchard Park to
the north and east.3 The project is also near other major
thoroughfares: Massachusetts Avenue, Harrison Avenue, Warren
Street, Bluehill Avenue, Dudley Street and Washington Street.
lo lift
r"
,
0 0 - 0 0 11N
ICity and University Hospitals. Two blocks to the south of the project is the Dudley Station area which is considered Roxbury's downtown and main shopping area. Located there is a new Roxbury Municipal Complex, which contains a police station, civic center, court house, regional library and the Roxbury Boys' Club. Boston has received a $1.8 million Urban Development Action Grant earmarked to provide funds to busi-nesses that build, improve, or expand retail facilities
there. Across Shawmut Avenue, five blocks to the west of Orchard Park are the recently built Madison Park High School, Occupational Resource Center and Madison Park Townhouses,
sub-sidized moderate and low-income housing.
Much of the proposed development in and around Orchard Park is a result of the Campus High urban renewal and the Southwest Corridor Development Plan. The Corridor is an area which was slated for the continuation of Interstate-95 from Canton through Hyde Park, Roslindale, Jamaica Plain, Roxbury
and the South End. In 1972 the expressway was cancelled and its federal construction funds were converted from high-way to transit and community development uses. The Southwest Corridor Development Plan calls for transit and commuter rail improvements, new streets, new housing, new parks and indus-tries using the cleared land from the cancelled expressway.
The Orchard Park Development is now about thirty-nine years old. Initially occupied in 1943, the project was named
for a pear orchard which once grew on the site.6 Today little hint of that orchard remains. Presently, the site is paved with asphalt and is dotted with twenty-eight three-story brick buildings, many of which have deteriorated and have the
fami-liar plywood covered windows indicating empty units. The physical condition of Orchard Park is considered to be one of the worst among the BHA's developments. There is notice-able litter, broken glass and refuse strewn about the site. Originally, there were 774 units in the development. By
1975, 4 were dedicated for agency use and 9 lost in the pro-cess of expanding several units, thus reducina the. useful units to 761. Today there are 737 useable units. This represents about a 5% loss in total number of units since
original construction. The reduction since 1975 is due to expanding units and "mothballing", a process the BHA uses to keep the number of units at a manageable level. Units have
been expanded because of the large families at Orchard Park who have needed more space. Rooms in the project buildings
are small. Although they comply with the federal standard-for overcrowding, which is no more than two people per bedroom, the BHA has found that this is not enough space for families with children. Thus, units have been joined to provide
more space for one family, which reduced the. overall number of units in the project. Another reason for reduction of units at Orchard Park is the high level of vandalism, which
increases BHA operating costs. Windows are broken and walls 'destroyed to expose the copper pipes which are then stolen. Vandalism in one unit causes a chain reaction effect in others
due to water damage by broken pipes, or water entering windows and seeping into other units.. Repair costs to restore units snowball, which when matched with limited maintenance
The vacancy rate at Orchard Park is high. In July 1979 BHA data shows it at about 21%, whereas today it is about 30%, compared to 33% which is the average rate for all BRA family
developments. Not only are there many vacancies at Orchard Park, but the number has increased steadily over time. An examination of BRA development reports shows the following changes in gross vacancies over time.
TABLE 1. Orchard Park Vacancies February 1966 1.4% December 1969 5.9% June 1975 9.6% July 1975 10.2% July 1979 21.0% February 1981 30.0%
Moveouts, too, are high averaging 92/year measured over a three-year period ending in 1978. Turnover rates reported in 1969 revealed that Orchard Park had a 10.2% turnover rate compared to 10.6% for all BHA projects for that year, which leaped to 20.0% by 1975 at Orchard Park compared to 15.3% for other BHA projects. As a percentage of units occupied in
1974, the 1975 turnover for the development was 21.2% com-pared to the BHA median of 16.3% for the same time period. An examination of length of residence in the project supports these findings. In 1975 48.9% of Orchard Park residents
had lived there for less than five years compared to the median for all BHA projects of 39.6%. In that year only
1.5% of residents had lived at Orchard Park more than twenty years, compared to the BHA median of 9.7%. In 1978 the per-centage of families at Orchard Park who had lived there less
than five years was 42% compared to 33% for all BHA family developments. Those residing at Orchard Park more than
twenty years was listed as 2% while the total BHA family developments show a 15% rate. Although the percentage of
is high compared to other BHA projects. Additionally, the percentage of those living at Orchard Park less than one year was 13% in 1978, a figure significantly higher than the 4% figure reported for all BHA family projects.
The significance of the high number of vacancies and moveouts is that opportunities for vandalism are increased in
the unoccupied units. Additionally, each time a unit is vacated it must be restored before it can be re-rented. These factors lead to high maintenance and operating costs, as well as units being kept off the market because sufficient repair funds are not available.
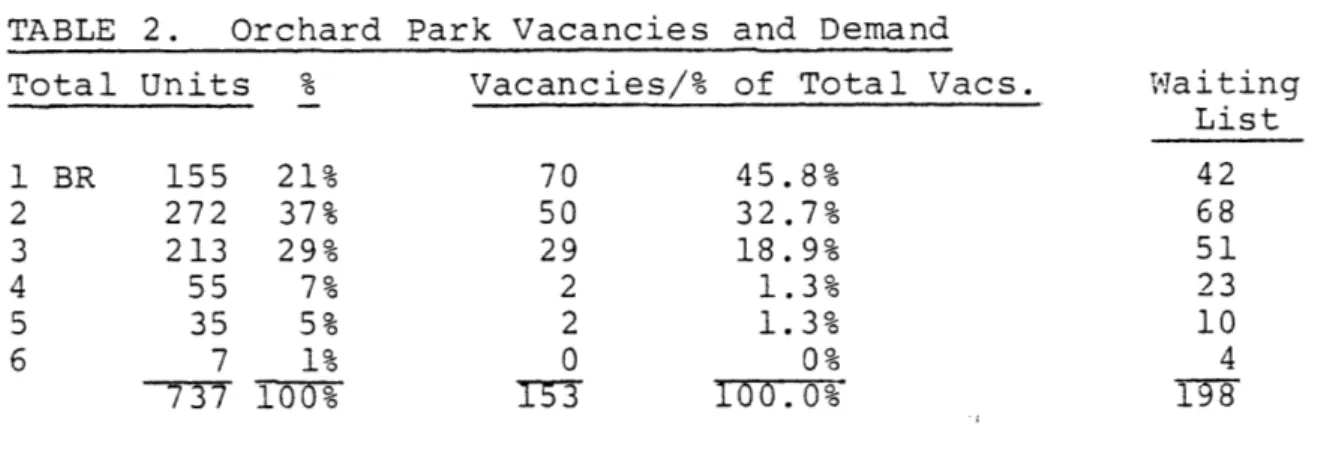
Even though there are a large number of vacancies and moveouts, there is demand for the project. It is impossible to infer from the data whether this demand is due to pre-ference for the project or abject need. The distribution of vacant units and demand for them as of July 1979 is reported below.
TABLE 2. Orchard Park Vacancies and Demand
Total Units % Vacancies/% of Total Vacs. Waiting List 1 BR 155 21% 70 45.8% 42 2 272 37% 50 32.7% 68 3 213 29% 29 18.9% 51 4 55 7% 2 1.3% 23 5 35 5% 2 1.3% 10 6 7 1% 0 0% 4 737 100% T5 3 100.0%198
Although there is demand, there is often a mismatch between the size of a unit which a family needs and what is currently available in the project. This can be seen above where re-quests for the 2, 3, 4, 5 and 6-bedroom apartments greatly
exceed available space while 28 of the 1-bedroom units could go begging. About 40% of Orchard Park families surveyed in
1978 reported that their reason for moving into the project was need for more space. This was the primary reason
of demand and available units, the- other factor which prevents the BHA from meeting this demand is the lack of funds to
restore units each time a family moves.
Contributing to the BHA's financial problem of repairing units and re-letting them, is the low rent which is collected on the Orchard Park units, $73/month on the average compared with $80/month for all BHA family projects in 1978. In 1975 a similarly lower monthly rent figure than average was re-ported for Orchard Park, $54.26 versus $59.41 for all BHA
pro-jects. Too, the percentage of families in arrears on their rent adds to BHA operating problems. In 1969, 8% of Orchard Park families were more than one month in arrears on their
rent compared to the BRA median of 7%. By 1975 the gap had widened with 47% more than one month in arrears versus a 23% median for all BHA projects. By 1978, 76% were more than one
month in arrears at Orchard Park.
The rent-paying ability and the operating income the BHA can expect to receive are naturally a function of who is living in the project. Like the residential neighborhood around
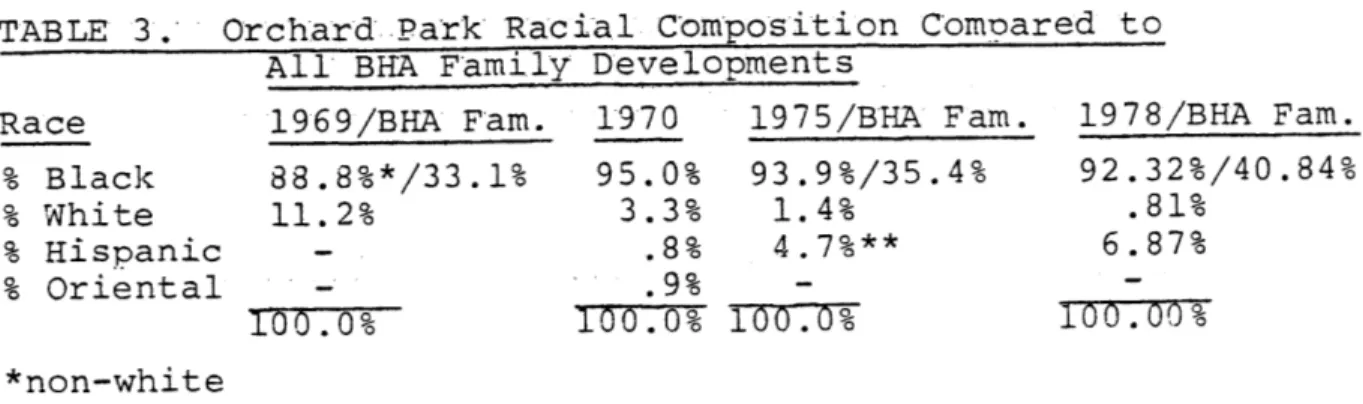
Orchard Park, the project has become increasingly composed of blacks and minorities over the years. The table below shows
the increase in black and hispanic residents and the decrease in whites. Additionally, the proportion of blacks in all the BHA family projects follows the percentage for Orchard Park. An earlier study shows that the project population in 1959 was 88% white, which rapidly fell to 49% by 1963.
TABLE 3. Orchard Park Racial Composition Compared to All BHA Family Developments
Race 1969/BHA Fam. 1970 1975/BHA Fam. 1978/BHA Fam. % Black 88.8%*/33.1% 95.0% 93.9%/35.4% 92.32%/40.84% % White 11.2% 3.3% 1.4% .81% % Hispanic - .8% 4.7%** 6.87% % Oriental - .9% - -100.0% 100.0% 100.0% 109.00% *non-white **other
at Orchard Park is that these racial groups experience more job and wage discrimination, particularly so with low-paying jobs.8 Educational attainment, which affects the ability to obtain and advance in a job, is also low at Orchard Park.
In 1978, the median number of years of school completed was 10 compared to 12.1 for the city of Boston in 1970.
A trend which follows is the income level at Orchard Park which was lower than the BHA family development median and decreased relative to it between 1975 and 1978. In 1975 Orchard Park per capita income was.$l,105, or 84% of the BHA median of $1,312. By 1978 it was $1,353 or 76% of the BHA family median of $1,785. Mean family income, too, shows a slight reduction from 94% of total BHA family developments in
1975 to 92% in 1978 at $4,736 for Orchard Park. In 1978, 17% of tenants surveyed reported "need for lower rent" as their reason for moving to Orchard Park. This was the third highest frequency of reasons for moving next to "need for
space" at 40% and "forced move, medical emergency, fire, eviction, substandard conditions at previous house" at 30%.
Employment, which is usually positively related to in-come, is low at Orchard Park and also lower than what was
reported for all BHA family projects. In 1969, 25% of
families at Orchard Park reported having one or more members working, compared to 35% for all BHA family developments.
By 1975, 15% reported one or more members working versus 21% for the BHA family developments. In 1978, 16.31% of families surveyed showed one member employed but only 10.25% of the overall adult population was working. Corresponding with a low employment rate is also a high dependence on wel-fare payments at Orchard Park. Listed below is a table which shows the percentage of families at Orchard Park receiving Aid to Families with Dependent Children (AFDC).
1962 1969 1975 1978 Orchard Park 1978 BHA Family
21% 47% 55% 66% 46%
Besides the income problem, Orchard Park suffers from
social and family problems. One is a large proportion of single-parent households, which has increased from 64% in 1969, to 85% in 1975 and about 95% in 1978. Of the single-parent households, approximately 74% were headed by women in 1978. Although the reporting system was different in 1975, 79.5% of all heads of households were females in that year. Addi-tionally, the female heads tend to be young. In 1978 20%, the highest frequency, of female heads of households were between the ages of 19 and 24 years. The highest frequency
for males, at 21%, was in the 45-50 year age group. Coupled with a good share of young, female-headed households is a
large proportion of minors, which has remained fairly stable from 1975 to 1978. The details are listed below.
TABLE 5. Minor Population at Orchard Park
Total number and % 1975 1978
of minors (0-18 years) 1556(58%) 1310(58%) Minors as % of Total Development
Population
Ages 1-5 15% 16%
6-11 17% 19%
12-14 11% 10%
15-18 9% 13%
The project has other problems, too, related to crime and daily operations. Crime, vandalism and drug-related acti-vities afflict Orchard Park as they do other public housing
sites in the city. Aside from vandalism, Orchard Park has been used as a stolen car drop-off point and a place criminals
escape to after committing crimes. Tenants have requested that maintenance and rat control be improved at the site. Specifically, they have asked for increased dumpster
in rather than beside them. BRA officials have expressed concern for employment for young residents as well as adults, and have noted that no hiring commitments have emerged for project tenants from the new CrossTown Industrial Park, which abuts the project. The land use and zoning around the project tend to isolate it from the rest of the Lower Roxbury com-munity. Driving through the surrounding neighborhood, ob-servation shows the predominant uses to be warehouses, storage companies, junk yards, tire lots, iron works, truck bays, a refuse disposal facility, abandoned or deteriorating houses and vacant lots. As characterized by the BRA:
"except for wood frame structures on Zeigler and Eustis, Orchard Park is a residential island surrounded by in-dustrial, warehouse, small scale commercial use and vacant land which accentuates t.e development's
separation from the community." See Map 2 for the zoning in the area.
To every bleak story, there are some bright sides, and this is also true for Orchard Park. Although the project has a high turnover rate among the recent arrivals, it has a core of residents who have lived there for 5-15 years. This group represents 53% of the tenants surveyed in 1978, and is dis-played below compared to all BHA family projects.
Table 6. Years in Residence - Percentage of Total Families Orchard Park All BHA Family Developments
5-10 years 28% 27%
11-15 years 25% 18%
573% 45%
Although these residents are concerned about conditions at the project, they have a strong commitment to Orchard Park and consider it their home. 1 An observation of the project on
a Sunday afternoon recently revealed residents outside working on cars, men and women gathered in small aroups talking,
414
2~
% B-1<
E S It
Key to Zoning Map 2
Residence Districts Business Districts Industrial Districts
S-3 S-5 Single Family R-5 Two Family R-8 3 Family, Apts. H-1 H-2 H-3 Apartments H-4 H-5
L-5 Local Retail & M-1
L-1 Service Stores M-2 Light Manufac-M-4 turing B-1 B-2 Retail B-4 Business B-8 & Offices B-10 M- 8 T-2 General Manufacturing W-2 Waterfront Industry
basketball qoina on. Even though the ®roject has physically old structures, cramped quarters, social and economic pro-blems, there is a group of residents who would like to stay together.
Several years ago, the tenant organization considered redevelopment plans for the project prepared by Greater Rox-bury Community Development Corporation. Since then they
have not discussed redevelooment alternatives with residents because of the lack of funding to implement any massive re-habilitation plan. Representatives of the tenants are
working for more realizable goals, such as, hallway and stair-well improvements, expansion of unit size and site maintenance.
From the Department of Housing and Urban Development the BHA received about $13.5 million in modernization funds for sta-bilization and improvement of their projects. Approximately
$3.1 million has been earmarked for Orchard Park. These funds will be exhausted in re-roofing project buildings, repairing the electrical system, improving the site and for relocating tenants. Currently, the BHA does not have large amounts of additional, undesignated funds, which could be directed towards innovative structural rehabilitation such as in-creasing the number of entryways serving groups of tenants. At present, twelve units are served by each entryway.
Services available to project tenants on the site include a city-operated recreational center, which has been very suc-cessful, a Headstart Program located in the administration building and a Neighborhood House run by the Lena Park
Com-munity Development Corporation. Nearby the project on Dudley Street is the Opportunities Industrialization Centers, an agency which trains minorities for jobs which currently exist or
will locate in Boston in the future.
In conclusion, the BHA is saddled with management and maintenance of an old physical plant at Orchard Park which is in bad need of repair. Aside from projected cuts in operating
rents from the site, with a high percentage of them received late. Vandalism at the site increases repair expenses and limits the BHA's ability to quickly re-rent vacated apart-ments, and which in turn causes the BHA to lose additional rent revenue.
Project residents have their own social and economic problems which affect their own upward mobility and contri-bute to the BHA's shortfall in financial resources. The
image inferred from BHIA data is one of a black, dependent poor population, with a low potential for attaining employ-ment, a high percentage of households headed by young women, and a large population under the age of 18 years. Also,
the degree of dependency on welfare is above average compared to other BHA family developments. Although there are numerous physical and social problems at the site, there. is also a core of tenant families committed to improving Orchard Park.
It is instructive to study Orchard Park in the context of its neighborhood. If a project is failing in a thriving neighborhood, more attention on the internal workings of the project would be suggested. If a project is thriving in a failing neighborhood, attention should be given so the pro-ject is not harmed by the neighborhood. Where both propro-ject and neighborhood are declining concomitantly, energy must be directed toward both so that the problems of one do not spread to the other. An example of a spreading problem is crime. If a neighborhood has a high crime rate, it is dif-ficult to prevent it from affecting the project or vice versa. An analysis of the HUD Target Project Program, initiated in 1974, indicated that projects located in deteriorating neigh-borhoods are subject to harmful effects from the neighborhood. One evaluation concluded that it was not sufficient to improve just the physical environment of the project:
"a public housing project does not and cannot exist as an island in the midst of a surrounding neigh-borhood or environment. There is a complex en-vironment within which the project exists and it must be treated as an integral part of that environ-ment, for the public housing project impacts upon its
surrounding12as it is impacted by the neighborhood
around it."
Thus, this section will analyze the neighborhood immediately around Orchard Park to provide clues as to the nature and extent of improvements necessary to turn Orchard Park around.
The residential neighborhood in which Orchard Park is located spans two census tracts,, numbered 804 and 803 as shown on Map 3. The two tracts directly abutting the
pro-ject tracts are 801, a large industrial/manufacturing area which has a very small residential component, and 802, which
is predominantly residential. Tract 906 reaches further into the North Dorchester area and was examined, in addition to the other tracts, in order to offer some comparison with the
eo- c
CABRID
? 2 cf -N icV1 1 - -Robury:-
\801
-x Ui rY ,803
. 802 906. 744B
13
S
7
0o
trends for the entire city of Boston were used to compare those found in the Orchard Park neighborhood. U.S. Census tract data for 1960 and 1970, the most recent available, and the 1980 tallies for total population and racial composition
.
.
13
were examined and incorporated into the discussion.
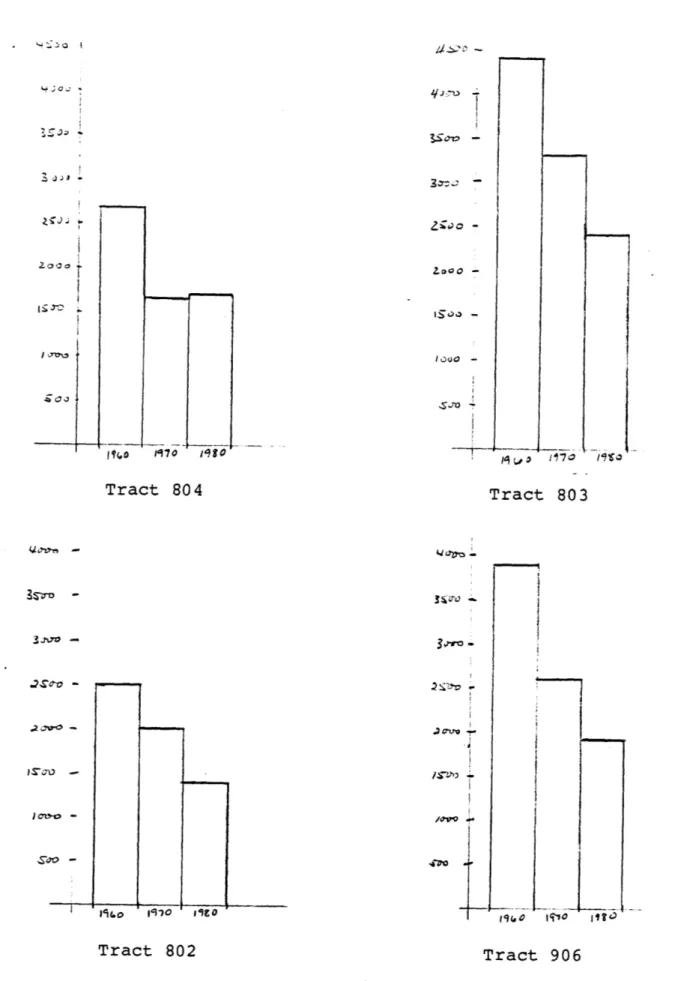
The total population for each of the tracts declined dramatically between 1960 and 1970, while the population for
the city of Boston for the same period decreased by only 8%. At the same time the population for the entire metropolitan
area increased by 6.3%. The 1960-1970~ years were a period in the U.S. when people were fleeing the inner cities to relocate in the suburbs. 14 Thus, the large decrease in the population in the Lower Roxbury tracts and the lesser reduction in Boston reflects this national trend. This outward trend is further reinforced when 1980 population figures for Boston are
ob-served. Between 1970 and 1980, Boston lost an additional 12% of its population. The pattern for the Orchard Park neigh-borhood continued between 1970 and 1980 and is graphically
shown in Figures 1 and 2. The total number of individuals leaving each tract and the percentage decrease which it represents are displayed in Table 7 below.
TABLE 7. Change in Total Population
TRACT 1960-1970 1970-1980 1960-1980 Numerical Change
15 1960-1980
804 40% less 3% more 38% less 1019 less 803 26% less 27% less 46% less 2031 less 802 20% less 29% less 43% less 1081 less 906 32% less 25% less 49% less 1885 less 801 17% less 58% less 66% less 594 less
Nationally the flight to the suburbs during the 1960's and 1970's left the central cities with a larger proportion of
16
elderly, black, poor and needy people. This phenomenon is also seen in the census data for the Orchard Park neighborhood. From 1960 to 1970 the population became increasingly composed
Tract 804 Z 'o
I
T770Tract 803
Tract 802Figure 1. Total Populat
otv
Tract 906
ion
41 -.71> SSO 3~o 4 Ov" -.2ce-0 .2 OV-0Tract 801
of blacks. Between 1970 and 1980 there is a slight reversal
of this trend in some tracts. Far from indicating a positive
pattern, when the reversal is coupled with a continued loss
of population during this period, it probably indicates that
the blacks who could were also leaving the neighborhood.
The picture is one of evacuation, first by whites between
1960 and 1970 and then by blacks in the following decade.
TABLE 8.
Percent Black Population
TRACT
1960
1970
1980
804
21%
93%
91%
903
33%
78%
82%
802
15%
46%
43%
906
12%
37%
31%
801
2%
35%
3%
Although the figures for Boston during the 1960-1980 period
show an increase in the percentage black population, the
pro-portion is much lower than that which is seen in the Orchard
Park neighborhood. In 1960 Boston showed a 9% black population;
in 1970 it grew to 16% and by 1980 it was about 22%.
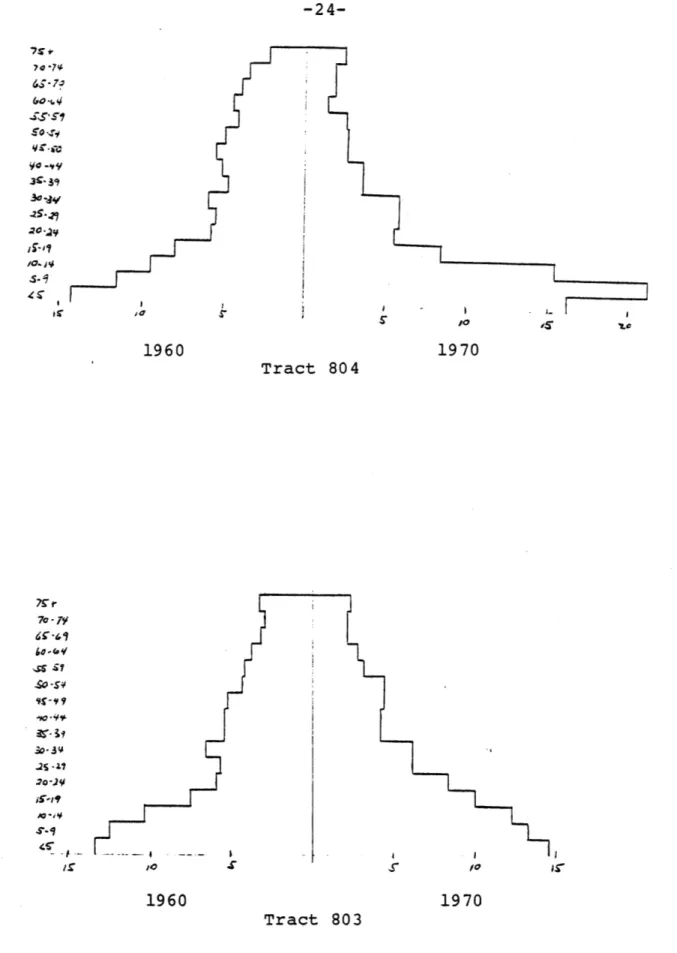
Figures 3, 4 and 5 show the population pyramids for each
tract.
It is interesting to note the increase in the
pro-portion of the population older than 75 years and in the group
younger than 18 years between 1960 and 1970.
Tract 803 shows
a slight decrease in its population older than 75 years.
However, Tracts 804 and 803, which Orchard Park spans,
graphically show the largest density of children. Tract 801,
which abuts the project tract, too, shows a population figure
heavily weighted with children. The proportion of each tract's
population under 18 years is shown in Table 9 compared with
the figures for Boston.
lo. 7~ 70 -s7 $o'51 3C- 31 30 -4v I7s.'7 20 -.14' /0-.4e1S- 1 79 7v-/ di--1 b"-"o 30-5D4 5-9
1960
1970
Tract 804
S---
- _ _ I -.~
_ _ 1 U-,0 X' S / Tract 8031970
Figure 3. Population Pyramid
I0
I-11-T
10
1960
-70
*
5
I L jO Tract 802 70-7 /0-w 5-? )o /01970
I0Tract 906
Figure 4. Population
5
so 51960
1960
1970
Pyramid50T
10. .
1960
1970
Tract 801
Figure 5. Population Pyramid
TABLE 9. Percent of Population under 18 Years TRACT 1960/Boston 1970'/Boston
804 42%/29% 59%/28%
803 43% 47%
802 34% 39%
906 37% 39%
801 31% 43%
Additionally, there was a decrease in the ratio of males to females during this period for all tracts except 802.
Table 10 itemizes the male/female ratio for each tract and contrasts them with the ratio indicative for Boston.
TABLE 10. Male/Fema'le Ratio
TRACT 1960/Boston 1970/Boston
804 86/92 72/85
803 89 83
802 84 91
906 97 93
801 99 81
The census tracts in which the housing project is located show lower ratios than the rest of the city. All the sampled tracts show a reduction in this ratio between 1960 and 1970 except tract 802. When there is a large proportion of children in the population, a high ratio of males to females would indicate that there are male figures present to discipline and act as paternal models for the children.
Another indicator of family stability can be derived from the proportion of single women in the population. As can be
seen in Table 11, the percent of single women increased during the years under study for every tract. When compared to Boston, all tracts have higher rates of single women in 1960 and 1970. Coupled with lower male/female ratios and a large proportion of children the figures suggest discipline problems in this
neighborhood.
TABLE 11. Percent of Single Women
1960/Boston
47%/31%
50%
55%
41%
38%
1970/Boston
54%/38%
53%
57%
48%
45%
Income is another variable which is also much lower than
that reported for Boston. Median family income for each tract
is shown as a percentage of Boston median family income in
Table 12 below. Not only is income low in each tract compared
to Boston, but it decreases relative to Boston between 1960
and 1970.
TABLE
12.
Median Income as a Percentage of Boston Median Income
196 0/Boston
60%
66%
92%
84%
71%
1970/Boston
48%
61%
69%
63%
63%
Likewise, these tracts generally report higher rates of
unemployment for those in the labor force compared with
Boston. However, it is important to note that there are
ex-ceptions to this pattern and also that the unemployment rate
for these tracts tended to decrease between 1960 and 1970.
TABLE 13~.
Unemlroyment Rates for Population in the Labor Force
MALES1960/Boston
0/Boston
14%/6%
14%
7%
7%
14%
10%/5%
12%
5%
1%
13%
FEMALES 1960/Boston 1970/Boston2%
2%
4%
0
5%
2%
7%7%
TRACT 804803
802 906 801 TRACT 804 803 802 906 801 TRACT 804803
802906
801
TABLE 13. Unemployment Rates (cont.) TOTAL (Males and Females) TRACT 1960/Boston 1970/Boston
804 ll%/5% 7%/4%
803 9% 9%
802 5% 4%
906 6% 4%
801 9% 10%
A 1980 report on the Orchard Park neighborhood performed by United Community Planning Corporation indicated that although
the 1980 unemployment statistics for the specific tracts under discussion were not available, it was reasonable to
assume that the rate is similar to that of the rest of Roxbury by 1977. Their report shows unemployment at 20.3%
17
for Roxbury, while Boston had a 12.8% level in 1977. The high unemployment rate in this section of the city is attri-buted to the fact that within the last thirty years Boston lost approximately 50% of its manufacturing activity and concur-rently about 53,000 jobs. 1 8
Education, a variable associated with income and
em-ployment, is also lower for the Orchard Park neighborhood than for the rest of the city. This is exemplified in Table 14 below.
TABLE 14. Median Years of School Completed
TRACT 1960/Boston 1970/Boston
804 8.8/11.2 9.4/12.1
803
9.9
9.7
802 9.0 9.5
906 9.0 8.7
801
8.6
8.7
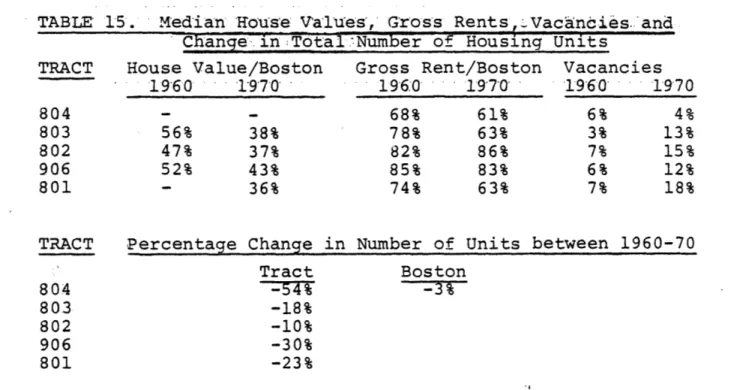
Another variable associated with income is house value. Census data shows that the median house value for the tracts examined is about one-half Boston values in 1960 and about 40%
the median house value of Boston by 1970. Median gross rent, too, declined relative to Boston rents, but it remained sub-stantially higher than the house value ratio. This is fairly
common in ghetto areas during periods when population is
di-minishing. Landlords receive less demand for their units and
charge relatively high rents in order to cover operating costs.
1 9This argument is supported by an examination of vacancy rates
which increased in all tracts but 804 between 1960 and 1970.
By way of comparison, available vacant units relative to total
units in Boston were 6% in 1960 and 8% in 1970.
The relatively
high rents and increased vacancies cannot be attributed to the
construction of new units since the total number of housing
units decreased for each tract between 1960 and 1970. Table
15 below displays these details.
TABLE 15.
Median House
Values, Gross
Rents
Vacandies.
and
Change
in
Total
Number of
Housing Units
TRACT
House Value/Boston
Gross Rent/Boston Vacancies
1960
1970
1960
1970*
1960
1970
804 - - 68% 61% 6% 4%803
56%
38%
78%
63%
3%
13%
802
47%
37%
82%
86%
7%
15%
906
52%
43%
85%
83%
6%
12%
801 - 36% 74% 63% 7% 18%TRACT
Percentage Change in Number of Units between 1960-70
Tract
Boston
804
-54%
-3%
803
-18%
802
-10%
906
-30%
801
-23%
The data on ownership also reinforces the conviction that
there was an evacuation from the area. The tracts where the
project is located (804 and 803) and abutting tract 801 were
affected to a greater degree, reporting decreases in ownership
rates between 1960 and 1970. As distance is gained from the
project, ownership rates actually stabilized or increased.
Although income did not increase in tracts 802 and 906 during
in employment, relatives may have pooled funds to switch from
renting to ownership as wary landlords began to sell and flee
the area. Table 16 reproduces the ownership data for these
tracts. The picture is one in which residents were abandoning
TABLE
16.
Percent Owner Occupancy
TRACT
1960
1970
804
8%
.4%
803
17%
12%
802
23%
23%
906
24%
28%
801
21%
17%
the neighborhood, vacancy rates were increasing, with a
subse-quent plummeting of house value, and landlords trying to recoup
losses by charging relatively high rents to the tenants they
could keep.
Another factor which must be examined is mobility. The
proportion of people who reported moving into the Orchard Park
neighborhood within two years of the census increased between
1960 and 1970.
Simultaneously, the percentage of long-time
residents decreased as the recent arrivals increased in tracts
804 and 803.
For tracts 802, 906 and 801 the residents of
21 years or more increased slightly. Rather than indicating
an increase in neighborhood stability, in this instance it
mirrors what was happening in inner cities nationally. The
elderly, who could not afford to move, ended up staying. It
is interesting to note that the long-time residents of the
tracts where the project is located got out. Unlike
uni-versity dominated neighborhoods throughout the city, the
high degree of transience here, does not have a common focus,
which would tend to unite residents. See Table 17 below for
details.
TABLE 17.
Moved to Current Residence within:
2 Years1960/1970
804
31% 47%
803
26%
33%
802
31%
36%
906
33%
36%
801
25%
28%
Bost. 31% 36% 5 Years1960/1970
27% 31%
36% 31%
29% 20%
26% 25%
34% 28% 26% 20% 10 Years1960/1970
30% 17%
27% 25% 25% 18% 24% 8%26% 12%
27% 15%20 Years
1960/1970
- 4% - 8% - 7% -12%
-12%
-15%
21+ Years1960/1970
12%
2%
11%
4%
16% 20%18% 19%
15% 21% 16% 15%To sum up, the Orchard Park neighborhood is a typical
example of a declining inner city area marked by:
higher than
average losses in total population and total number of housing
units; higher percentages of blacks, children, females to males,
single women, gross rents, transients and the unemployed; and
generally lower income, educational attainment, house values
and ownership levels.
Pro ject/Neighborhood Comparison
The census data for tracts 804 and 803 is naturally very
similar to project statistics, since the project population
of 2,292 in 1970 consisted of 47% of these tracts. By 1980
the project population of 2,258 comprised 56% of tracts 804
and 803.
Due to the large proportion of project residents
in these tracts, it is normal that the census reportings would
reflect the trends noted in the project. Looking at specific
variables, the following similarities are found. Both show
comparable increases and proportions of black residents. The
percentage of minors is almost identical for tract 804 and
the project. Median years of school completed is low in the
project and project census tracts compared to Boston. Income
is low in the project relative to other BHA family
develop-ments and it is low in tracts 804 and 803 compared to Boston.
Unemployment is very high in the project and relatively high
in the Orchard Park census tracts compared to Boston. Gross
rents collected in the projects are lower than the average
ones generated in other BHA family projects. The gross rents
in the project tracts are a lower proportion of city rents
than Orchard Park rents are compared to average BHA family
rents.
The proportion of recent movers to the project and
neighborhood are both high, while both also show reductions
in the number of residents of twenty-one years or more.
Va-cancy rates are high for both the project and its census
tracts. Strict comparisons between the project and the
neigh-borhood are not possible because the data measures slightly
different variables and also the reporting periods are not
the same. However, similar trends can be seen even if the
data is not exactly the same.
Regardless of the form of the data, there is one major
difference between the project and its census tracts; that
is, housing demand. The Orchard Park project has a waiting
despite sizeable losses in the number of housing units. Tract
804 in 1970 is the only exception, with a 4% vacancy rate.
This is not altogether an aberration from the other tracts
since 804 lost 54% of its housing units between 1960 and 1970
while its vacancy rate diminished by a mere 2%.
Characteristics similar to the project and its tracts
are found in tracts 802, 906 and 801 for the following
vari-ables. Population size decreased between 1960 and 1980 in
all the tracts except 801 by 38% to 49%.
Tract 801 showed
a 66% loss, but it had the smallest population of all the
tracts initially. Thus, its percentage change in population
is highest while the number of people who left it is half
or less than half when compared to the other tracts. The
percentage of single women is uniformly high compared to
Boston among all the tracts, ranging from 45% to 57% in
1970 versus Boston's 38%.
Income is also similarly low in
all tracts, ranging from 60-70% of Boston levels in 1970.
Educational attainment, too, is comparably low in all the
tracts, even those beyond Orchard Park's location.
Loss in
units and vacancies are uniformly high except for tract 804's
vacancy rate which was mentioned above.
There are some notable differences between the data found
in the project and its tracts (804 and 803) compared to the
ones outside of Orchard Park (802, 906 and 801).
The
pro-portion of blacks and minors is
much lower in the latter
tracts.
These tracts, too, show higher male/female ratios
than are seen in the project tracts or suggested by project
data. Additionally, unemployment rates in tracts 802 and
906 are comparable to Boston's rate in 1970.
Tracts 802 and
906 also show higher rents than the other tracts. Tract 801
again is an exception to the trends found in the outlying
tracts.
It had levels of unemployment and rents which more
closely resembled the project tracts, 804 and 803. Finally,
the tracts outside of Orchard Park show the largest
percent-ages of residents who had lived there for twenty-one years
or more.
Are there causal elements for the trends seen in the
pro-ject and the neighborhood?
One contributing force was the
Southwest Corridor land clearance which started in 1966.
The path cleared for the expressway cuts right through the
heart of tract 804 and through the western side of tract 801.
As shown earlier tract 804 lost 54% of its units and 801 lost
23% between 1960 and 1970. When land was being cleared
businesses as well as residents were relocated. As that
oc-curred other residents perceived that their local businesses
were gone and that a major expressway would be built nearby,
so chose to leave.
Study on housing investment in other inner
cities shows that the adverse affects of abutting public
works construction and renewal projects can lead to
residen-tial abandonment.20 Another influence was the national trend
of flight to the suburbs, which left inner cities with
re-duced populations. The out-migration from this vicinity
resulted in abandoned and-derdolished structures. This
neigh-borhood not only has the typical features of a declining inner
city area, but it suffered an additional jolt when land was
cleared for the expressway, compounding the disinvestment.
Finally, neither the project nor the neighborhood provides an
anchor of stability by which the other can improve.
As mentioned in the previous section, traditional socio-economic indicators and observation show that Orchard Park and its immediate neighborhood have declined dramatically
since 1960. Neither the project nor its abutting neighborhood provides the stability necessary to reinforce a stabilization effort in one. There are some exceptions to the downward spiral in the neighborhood, chiefly seen in tracts 802 and 906. While residential strength cannot be found on the lands
immediately surrounding the project, it is important to exa-mine what is occurring a little further south and east. Mod-erate revitalization is occurring about five blocks to the east of the project by Portuguese immigrants who have migrated
here from the Cape Verde Islands off the coast of northern Africa. Additionally, revitalization is occurring south of
Dudley Street in the Sav-Mor neighborhood. It is important to examine what is being done in these areas to see whether it will advance as far as the project, enhancing any stabi-lization effort there, or if more direct intervention in the Orchard Park neighborhood is necessary to link it to the other activities.
First, what are the city-directed housing programs for the neighborhoods near Orchard Park? The Sav-Mor neighborhood,
located south of Dudley Street between Warren Street and Blue Hill Avenue, was designated for the HUD Neighborhood Strategy Area Program in 1978. The program targets neighborhoods for
rehab and preservation investment which is funded by Com-munity Development Block Grants (CDBG) and the city's
capital budget.21 Additionally, within the Sav-Mor neigh-borhood, a.subdivision has been designated for t8 substantial rehab money. Under this program three rehab projects have been selected, with a total of 200 units to:bg rehabbed within this year. The first project will produce 40 units of elderly housing in the Sarah Baker School on Langford Street. Two other projects will produce mixed family and elderly units
but their precise locations are not yet known. What is clear is that these programs will be in the northern part of the Sav-Mor neighborhood, but south of Dudley Street. All of these projects will be for low-income families and will carry f8 rent supplement.2 2
Another program proposed by the city will extend north of Dudley Street into the Orchard Park neighborhood. In
February, 1981, the Mayor's Office of Housing applied to HUD's 510 Demonstration Program for substantial rehab funds for 90 vacant and 10 occupied housing units near Orchard Park com-bined with the rehab and cooperative conversion of Marksdale Gardens, a "troubled" HUD site with a stable tenant population located in the Washington Park section of Roxbury. The plan calls for using the syndication proceeds from the f8 rehab component as seed money for home ownership at Marksdale Gardens.
The sites chosen for the rehab component of the program are masonry structures of 3 or more units and include:
1) vacant residential brick structures acquired by the city through tax foreclosure,
2) masonry shells which were part of the BRA "in-fill" experiment. These are multi-unit structures completed in the early 1970's on vacant lots between residences but never oc-cupied. They were built for large families and most contain four bedrooms.
3) privately owned tax delinquent properties, and 4) closed or consolidated school buildings.
The following list provides details on the location and ownership of the buildings.
BRA In-fill Buildings Number of Units
105, 120 George Street 10
254, 281-283 Eustis Street 16
T6
Family Units City-owned Buildings54 Adams Street, 189 Eustis Street 3
56-58 Adams Street 6