EUROPEAN ORGANISATION FOR NUCLEAR RESEARCH (CERN)
Eur. Phys. J. C (2017) 77:26
DOI:10.1140/epjc/s10052-016-4580-0
CERN-EP-2016-149 26th January 2017
A measurement of the calorimeter response to
single hadrons and determination of the jet energy
scale uncertainty using LHC Run-1 pp-collision
data with the ATLAS detector
The ATLAS Collaboration
A measurement of the calorimeter response to isolated charged hadrons in the ATLAS de-tector at the LHC is presented. This measurement is performed with 3.2 nb−1 of proton– proton collision data at √s = 7 TeV from 2010 and 0.1 nb−1of data at √s = 8 TeV from 2012. A number of aspects of the calorimeter response to isolated hadrons are explored. After accounting for energy deposited by neutral particles, there is a 5% discrepancy in the modelling, using various sets of Geant4 hadronic physics models, of the calorimeter re-sponse to isolated charged hadrons in the central calorimeter region. The description of the response to anti-protons at low momenta is found to be improved with respect to previous analyses. The electromagnetic and hadronic calorimeters are also examined separately, and the detector simulation is found to describe the response in the hadronic calorimeter well. The jet energy scale uncertainty and correlations in scale between jets of different momenta and pseudorapidity are derived based on these studies. The uncertainty is 2–5% for jets with transverse momenta above 2 TeV, where this method provides the jet energy scale uncertainty for ATLAS.
c
2017 CERN for the benefit of the ATLAS Collaboration.
Reproduction of this article or parts of it is allowed as specified in the CC-BY-4.0 license.
Contents
1 Introduction 2
2 ATLAS detector 4
3 Data sets and selection 5
3.1 Data samples 5
3.2 Monte Carlo simulation 5
3.3 Event selection and reconstruction 6
4 Charged hadron response 7
4.1 E/p distributions 7
4.2 Neutral background subtraction 11
4.3 Reduction of hadronic interactions in the ID 15
4.4 Background-corrected single-hadron response 16
4.4.1 Use of clusters or cells in response measurement 16
4.4.2 Effect of cluster calibration on response measurement 16
4.4.3 Charge dependence of response 18
4.4.4 Single-hadron response in events with pile-up 19
4.4.5 Single-hadron response in the hadronic calorimeter 20
4.4.6 Single-hadron response in the EM calorimeter 21
4.4.7 Modelling of response with modified calorimeter noise thresholds 21
5 Identified particle response 28
5.1 Event selection 28
5.2 Reconstruction of particle candidates 28
5.3 Background estimation 30
5.4 Identified particle response 30
5.4.1 Differences in calorimeter response between particles of different species 31
5.4.2 Background-corrected isolated identified hadron response 33
5.4.3 Estimation of charged-kaon calorimeter response 34
5.4.4 Calorimeter response to additional species of particles and close-by particles 35
6 Extrapolation to jet energy response and uncertainty 36
6.1 Jet properties 36
6.2 Jet energy scale and uncertainty 41
7 Conclusion 45
1 Introduction
The proton–proton collisions measured by the ATLAS detector at the Large Hadron Collider (LHC) produce quarks and gluons that are observed as collimated sprays of hadrons, called jets. The hadrons in jets are measured as charged-particle tracks and showers of particles in the calorimeters. Uncertainties in the measurement of jet energies and the modelling of the calorimeter response to hadrons often dominate systematic uncertainties in measurements at the LHC.
The measurement of the calorimeter response to single charged hadrons provides an important validation of the modelling of hadronic showers in the calorimeters and of the detector geometry implemented in the ATLAS simulation [1]. It is one of the few low-level measurements that can verify specific aspects of the modelling of the jet response. It also allows a component-wise derivation of the jet energy scale uncertainty and the extension of the uncertainty to high jet transverse momentum (pT> 1.8 TeV in 2012) where there are too few jets in the data for standard in situ calibration techniques (e.g. dijet or multi-jet balance techniques) to be applied [2]. The response to isolated charged hadrons was measured in ATLAS using data collected in 2009 and 2010 [3] and has been used to evaluate part of the standard ATLAS jet energy scale uncertainty since 2010 [2, 4]. The response to charged hadrons also has been used for the calibration of the detector response to hadronically decaying τ-leptons [5].
This paper describes the updated measurement of the response to isolated charged hadrons using data from both 2010 and 2012 with the most recent detector simulation. Between 2010 and 2012, the centre-of-mass energy was increased from 7 TeV to 8 TeV, and the calorimeter conditions changed as the calorimeters were repaired and recalibrated. In particular for comparisons sensitive to these changes, both 7 and 8 TeV data are presented. Generally, the conclusions are consistent between the two years. The detector simulation includes significant improvements in the detector description [6, 7] and makes use of new models of hadronic physics in Geant4 [8]. Several variations of the inclusive response measurement are used to validate key aspects of the modelling of energy reconstruction in the calorimeter. As in Ref. [3], the decays of identified particles are used to identify the type of particle entering the calorimeter (e.g. π±, proton, or anti-proton), in order to further validate the details of the hadronic physics models.
The calibration of jets based on the energy deposited by individual particles involves a number of steps that can be separately tested. Many particles are not sufficiently energetic to reach the calorimeter, and some particles interact before reaching the calorimeter and do not deposit a significant amount of energy. The fraction of particles not depositing energy in the calorimeter is the first important test of the geometry (i.e. description of the detector material distribution) and simulation of hadrons, discussed in Section4.1. The energy deposited in the calorimeter is then grouped into topological clusters. The procedure by which the clusters are constructed should not bias the energy measured in the calorimeter; this is explored in Section 4.4.1. These topological clusters can be calibrated to the hadronic scale, and the way in which the calibration affects the calorimeter energy measurement is discussed in Section 4.4.2. The construction of topological clusters involves an energy threshold, which differs between different data-taking periods at the LHC. The effect of changing these thresholds on the measured response is explained in Section4.4.7.
A jet is a complex object, however, and good modelling of the average properties of jets does not always indicate that jets would be well described in more extreme configurations. Some jets may be composed of more positively or more negatively charged particles, resulting in differences in response. The separate modelling of positively and negatively charged particles is discussed in Section4.4.3. Because hadrons may interact early or late in the calorimeter, jets may not be regularly distributed longitudinally. The description of the separate calorimeter layers is discussed further in Sections4.4.5and4.4.6. A number of different hadron species can contribute to jets. Their charged components are primarily charged pions, charged kaons, and (anti-)protons. The responses of these individual species of hadrons are discussed further in Section5. These results primarily build confidence in the extrapolation from simple isolated-hadron configurations to complex jet configurations.
The studies of the calorimeter response to isolated charged hadrons are then used to construct a jet energy scale uncertainty in Section6. The jet energy scale uncertainty, derived in this manner, is applicable only
to the particular set of jets used in the derivation. Just as in the case of the other in situ uncertainty estim-ations, additional uncertainties that depend on the details of the jet selection must be considered. One of these is an uncertainty due to the modelling of additional proton–proton collisions (pile-up) simultaneous with the collision of interest. Historically, although searches for new physics and measurements of the Standard Model are almost always performed in events with pile-up, isolated hadron response studies have always been performed in events with low or no pile-up. In Section4.4.4, the calorimeter response to isolated charged hadrons in events with pile-up is discussed. These studies are sufficiently promising that future studies of the calorimeter response to isolated charged hadrons might be performed in larger data sets, including events with pile-up.
The paper is organised as follows. The ATLAS detector is briefly introduced in Section 2. Section3
describes the data and simulated event samples and event selection, as well as the reconstruction meth-odology. Section4then details several features of the response to isolated charged hadrons, including the subtraction of neutral background particles. The calorimeter response to specific species of charged hadrons identified using displaced decays is described in Section5. The calorimeter response to charged hadrons is used to understand the jet response and uncertainties in Section6. Finally, Section7provides the conclusions of these studies.
2 ATLAS detector
The ATLAS detector [9] is a general purpose particle detector covering almost 4π in solid angle1 and consisting of an inner tracking detector (ID), a calorimeter, and a muon spectrometer. The ID consists of silicon pixel and strip (SCT) tracking detectors covering |η| < 2.5 and a straw-tube tracker (TRT) covering |η| < 2.0, all immersed in an axial 2 T magnetic field provided by a superconducting solenoid. A typical central track includes three measurements (hits) in the pixel detector, eight hits in the SCT, and 35 hits in the TRT. Below |η| = 0.6, a particle passes through approximately 0.5 radiation lengths (0.2 interaction lengths) of material before reaching the calorimeter. Between |η| = 0.6 and |η| = 1.8, the amount of material in the ID rises from 1.5 radiation lengths (0.4 interaction lengths) to a maximum of almost 2.5 radiation lengths (0.7 interaction lengths). The sampling calorimeter is hermetic out to |η| = 4.9 and is generally divided into barrel (|η| < 1.4), endcap (1.4 ≤ |η| < 3.2) and forward (3.2 ≤ |η| < 4.9) regions. The highly-segmented electromagnetic (EM) calorimeter uses liquid argon (LAr) with lead or copper absorber material and includes three longitudinal sampling layers in addition to a presampler for |η| < 1.8. The hadronic calorimeter uses scintillator tiles with steel absorber in the barrel (|η| < 1.7) and LAr with copper (tungsten) absorber in the endcap (forward) region.
A three-level trigger system is used to select events for offline analysis. The first level is hardware-based, while the second two levels are implemented in software. The minimum-bias trigger scintillators, used for selecting events in this analysis, are two sets of 16 thin scintillators covering 2.08 < |η| < 3.83. These scintillators are highly efficient for selecting events with charged particles in this |η| range and are integrated into the first level of the trigger.
1ATLAS uses a right-handed coordinate system with its origin at the nominal interaction point (IP) in the centre of the detector
and the z-axis along the beam pipe. The x-axis points from the IP to the centre of the LHC ring, and the y-axis points upward. Cylindrical coordinates (r, φ) are used in the transverse plane, φ being the azimuthal angle around the z-axis. The
pseudorapidity is defined in terms of the polar angle θ as η= − ln tan(θ/2). The opening angle in φ (η) between two objects is
3 Data sets and selection
3.1 Data samples
The primary data sample consists of eight million proton–proton collision events corresponding to an integrated luminosity of 0.1 nb−1 from a data taking period at the beginning of 2012 at √s = 8 TeV. Additionally, a sample of three million data events corresponding to an integrated luminosity of 3.2 nb−1 recorded during 2010 at √s = 7 TeV are examined. These data from 2010 were studied previously in Ref. [3], but they were subsequently reanalysed with improved understanding of the detector (e.g. im-proved knowledge of the detector material and alignment). Both of these samples were collected during periods in which the fraction of events with pile-up was negligible. In events with pile-up, the average number of simultaneous collisions is denoted hµi. To study issues related to pile-up, an additional data sample from 2012 is used, corresponding to an integrated luminosity of 551 nb−1, which has approx-imately 15 proton–proton collisions per event on average and collisions every 50 ns. This data sample includes some effects from both in-time pile-up, collisions simultaneous to the collision of interest, and out-of-time up, collisions in bunch crossings before or after the collision of interest. Out-of-time pile-up primarily affects the calorimeter response due to the response time of the calorimeter and the bipolar signal pulse shaping in the LAr calorimeter [9]. All data samples are required to pass basic data-quality requirements.
3.2 Monte Carlo simulation
The primary 2012 data sample is compared to 20 million simulated single-, double-, and non-diffractive proton–proton collision events, generated using Pythia8.160 [10] using the A2 configuration of underly-ing event and hadronization parameters (tune) [11] and the MSTW 2008 leading-order parton distribution function set [12,13]. Throughout the paper, the pTspectrum of tracks in Monte Carlo (MC) simulation is weighted to match that of the data. A separate MC simulation sample is produced with conditions consistent with that of the 2010 data taking period for comparison to the 2010 data sample.
The simulated events are passed through the ATLAS detector simulation [1] based on Geant4 9.4 [8].2 Two samples with different collections of hadronic physics models [14] are used: one, called QGSP_BERT, includes a quark–gluon string model [15–19] with a pre-compound and evaporation model for hadron momenta above 12 GeV, the parameterised low-energy proton inelastic model based on GHEISHA [20] from 9.5 to 25 GeV, and the Bertini intra-nuclear cascade [21–23] and nuclear de-excitation model below 9.9 GeV. In the regions where the models overlap, a smooth transition from one to the other is enforced. For protons and neutrons, an additional quasi-elastic scattering model is applied. The other set of hadronic physics models, called FTFP_BERT, includes the Fritiof model [24–27] with a pre-compound model above 4 GeV and the Bertini intra-nuclear cascade model below 5 GeV. These two sets of hadronic physics models also differ in the models applied to anti-hyperons and anti-baryons, which in particular leads to an expected difference in the modelling of the calorimeter response to anti-protons.
In all cases, the simulated detector conditions match those of the data-taking period, and the simulated events and data are passed through the same trigger and reconstruction software. Where the data include pile-up, minimum-bias events generated with Pythia8 are overlaid on top of one another to mimic the
2
Simulation with Geant4 version 9.6, which includes slightly different tunes of hadronic and electromagnetic physics models, was also tested, and the results were found to be compatible between the two versions.
simultaneous collisions in the detector, including the bipolar pulse shape of the calorimeter electronics. The MC simulation samples with pile-up are only included using the QGSP_BERT set of hadronic physics models.
3.3 Event selection and reconstruction
In order to be selected by the trigger system, events in the low-hµi data are required to have at least two hits in the minimum-bias trigger scintillators. In the MC simulation, this trigger is more than 95% efficient for events passing the following offline selection.
To collect data during data-taking periods with pile-up, three triggers are used. Only a fraction of events passing the selection criteria of any of the triggers are written out, as the rates are above the maximum bandwidth for the trigger. The first trigger is random and requires only crossing proton bunches in the detector. The events accepted by this trigger correspond to an integrated luminosity of 24 nb−1. Two triggers that require tracks that are isolated from other charged tracks at the front-face of the calorimeter and have at least 9 GeV or 18 GeV of pT are used to provide additional events. The events accepted by these two triggers correspond to 499 nb−1and 551 nb−1, respectively. In the MC simulation, because it is highly efficient, the trigger requirement has no significant impact on the results.
Each event is required to have a well-reconstructed vertex with at least four associated tracks with pT > 400 MeV. In the low-hµi data set, the events are required to have exactly one vertex, to further suppress any residual contribution from pile-up. The tracks selected for the measurement are required to have pT > 500 MeV and to have at least one hit in the pixel detector and six hits in the SCT, as well as small longitudinal and transverse impact parameters |z0 × sin θ| < 1.5 mm and |d0| < 1.5 mm with respect to the primary vertex [3]. This reduces the contribution from spurious and poorly measured tracks to a negligible level. In order to ensure that the tracks are isolated, no other track extrapolated to the second longitudinal layer of the EM calorimeter is allowed within a cone of size∆R = p(∆φ)2+ (∆η)2 < 0.4 around the track of interest. This criterion was shown previously to reduce the effect from other nearby charged particles on the measurement to a negligible level [3].
Although it does not provide the same level of precision tracking information as the pixel and SCT layers, the TRT provides additional information to efficiently reject the tracks originating from hadronic interactions in the ID material. Tracks interacting in the ID produce a range of secondary particles, often including ions and neutrons, which can be difficult to model correctly. Moreover, the kinematics and species of of hadrons resulting from these interactions is generally poorly known and may not be well modeled. For most of the results in this paper, in the region |η| < 2.0, more than 20 hits in the TRT are required to ensure that the particle producing the track reaches the calorimeter. The impact of this selection criterion on the measured calorimeter response is carefully examined in Section4.3.
In each event, the calorimeter cells’ energies are topologically clustered using a 4–2–0 algorithm [28]. This algorithm suppresses noise by forming energy clusters around seeds with at least four times larger (in absolute value) signal than the average noise, which includes both the electronic noise and the pile-up contributions. The threshold is defined by the width of the energy distribution in a cell in an MC simulation sample containing a fixed amount of pile-up (e.g. hµi = 30). All neighbouring cells with at least twice larger signal than the average noise are added to the clusters, and a final layer of cells at the boundary of the cluster is added without any noise threshold requirement. This final layer improved the energy resolution in single-particle studies with the ATLAS calorimeter test beam [29]. After this procedure, clusters may be split if there are several local maxima of energy found within them. Because
the cell energy requirements are on the magnitude of the signal, negative energy clusters are possible. The topological clusters are not calibrated beyond a correction for the sampling fraction of an electron shower in the calorimeter; no correction is applied for non-compensation or energy loss outside of the sampling portion of the calorimeter. Thus, the topological clusters are calibrated only to the electromagnetic scale (EM scale).
The noise thresholds used in the clustering procedure for the low-hµi data and MC simulation are extracted from simulated events without pile-up. In the data and MC simulation that include pile-up, the thresholds are re-calculated in simulated events with hµi= 30. The difference between the two noise calculations is a factor of two in |η| < 2.0, rising to more than a factor of 20 for |η| > 4.0 [30]. The impact of the difference between these thresholds are described further in Section4.4.7. In the remainder of the paper, unless explicitly stated, the nominal data set includes the low-hµi data with calorimeter thresholds calculated in events with hµi= 0.
4 Charged hadron response
The calorimeter response to charged hadrons is studied using the ratio of the energy deposited by the isolated charged particle in the calorimeter, E, to the momentum of its track, p, as measured by the ID. The ratio is denoted E/p, and the average ratio is denoted hE/pi. As the track momentum measurement has a small uncertainty in for the range 0.5 < p/GeV < 30 considered in this paper, which is negligible below 5 GeV and is taken as a conservative 1% above this value [3], it is an excellent proxy for the energy measurement of the isolated charged hadron.
The energy of a topological cluster in a certain layer of the calorimeter is matched to the track if the energy-weighted position of the cells associated with the topological cluster in that layer is situated within ∆R = 0.2 of the extrapolated position of the track in that particular layer. The cone size of ∆R = 0.2 around the track was optimised such that, on average, about 90% of the energy of the charged hadron is included, while the contribution from the neutral-particle background is kept to a low level [3].
The construction of the E/p variable is illustrated in Figure1.
4.1 E/p distributions
Figure2shows several examples of the E/p distributions for data and MC simulations with both sets of hadronic physics models. The distributions are normalised to have unit area. Examples are given for two track momentum bins in the central region of the calorimeter, for data with low hµi and a higher |η| region, and for data in the central region of the calorimeter with higher hµi. In these distributions, no requirement is made on the number of TRT hits associated to the track. The mean of the distribution is significantly less than one because of the loss of some energy outside of the clusters included in the definition of E and the non-compensating response of the calorimeter. The large fraction of tracks with E/p= 0 corresponds to tracks without an associated topological cluster in the calorimeter. This can happen if either a particle interacts hadronically before reaching the calorimeter or no single energy deposit is large enough to seed a topological cluster [3]. The negative tail of these distributions is caused by noise in the calorimeter, which for data taking conditions with low hµi consists mostly of electronics noise, while the long positive tail is caused by the background of neutral particles, since these particles add to the measured E but not to p. In events with significant amounts of pile-up, such as those shown in Figure2(d), the positive tail
(a) (b)
Figure 1: An illustration (a) of the construction of the E/p variable used throughout this paper. The particle is identified by matching a track (green) with momentum p to topological energy clusters in the EM and hadronic calorimeters (red), while nearby topological energy clusters from neutral-particle background (light blue) must be removed. The red (black) dashed circle on the horizontal plane has a radius∆R = 0.1 (0.2) around the track. The same diagram is shown for the neutral-particle background selection (b) using late-showering hadrons, described in Section4.2. The construction is similar, but the energy deposited in the EM calorimeter by the particle is required to be consistent with a minimally-ionising particle (MIP). No attempt is made to identify individual clusters as originating from background particles. The subtraction is done on average
from in-time pile-up can be quite large, and the negative tail is enhanced by several orders of magnitude due to the impact of out-of-time pile-up. At low |η|, the MC simulation underestimates the negative E tail from noise; however, this tail is only a very small fraction of the distribution. In the same |η| region but at higher momenta, the amount of energy from neutral-particle backgrounds is overestimated by the MC simulation, as can be seen from the high E/p region in Figure2(b).
The fraction of the distribution with E ≤ 0 can be further examined to understand features of the geometry, hadronic interaction models, and noise modelling. No requirement is placed on the number of TRT hits associated to the track for these distributions in order to include particles that may have undergone a hadronic interaction earlier in the ID. This fraction for inclusive charged particles is shown in Figure3
as a function of track momentum and |η| separately for tracks of positive and negative charges. The bin edges in |η| in these distributions follow geometric features of the calorimeters. The 2010 and 2012 data are shown separately and display similar features. This fraction is directly displayed as a function of the number of traversed interaction lengths of material as described by the geometry of the simulation in Figure4for tracks with 1.2 < p/GeV < 1.8. The fraction of the distribution with E ≤ 0 increases with |η| and interaction lengths, as the detector material increases, and decreases with momentum. Differences between the two charge distributions are clearly visible, particularly at low momenta. These differences are closely related to the population of particle species present in the two samples and is discussed further in Section5.4. The data and MC simulation are discrepant across a large range of interaction lengths and
10−6 10−5 10−4 10−3 10−2 10−1 100 101 102 103 Normalized Distribution ATLAS L = 0.1 nb−1, 8 TeV |η| < 0.6 1.2 <p [GeV] < 1.8 Data 2012 FTFP BERT 2012 QGSP BERT 2012 −1.0 −0.5 0.0 0.5 1.0 1.5 2.0 2.5 3.0 E/p 0.2 0.6 1.0 1.4 MC/Data (a) 10−6 10−5 10−4 10−3 10−2 10−1 100 101 102 103 Normalized Distribution ATLAS L = 0.1 nb−1, 8 TeV |η| < 0.6 2.2 <p [GeV] < 2.8 Data 2012 FTFP BERT 2012 QGSP BERT 2012 −1.0 −0.5 0.0 0.5 1.0 1.5 2.0 2.5 3.0 E/p 0.2 0.6 1.0 1.4 MC/Data (b) 10−5 10−4 10−3 10−2 10−1 100 101 102 Normalized Distribution ATLAS L = 0.1 nb−1, 8 TeV 1.9 < |η| < 2.3 2.8 <p [GeV] < 3.6 Data 2012 FTFP BERT 2012 QGSP BERT 2012 −1.0 −0.5 0.0 0.5 1.0 1.5 2.0 2.5 3.0 E/p 0.50 0.75 1.00 1.25 MC/Data (c) 10−4 10−3 10−2 10−1 100 101 102 Normalized Distribution ATLAS L = 24-551 nb−1, 8 TeV |η| < 0.6 1.2 <p [GeV] < 1.8 9.6 < hµi < 20.6 Data 2012 QGSP BERT 2012 −1.0 −0.5 0.0 0.5 1.0 1.5 2.0 2.5 3.0 E/p 0.50 0.75 1.00 1.25 MC/Data (d)
Figure 2: The E/p distribution for isolated tracks with (a) |η| < 0.6 and 1.2 < p/GeV < 1.8; (b) |η| < 0.6 and 2.2 < p/GeV < 2.8; (c) 1.9 < |η| < 2.3 and 2.8 < p/GeV < 3.6; (d) |η| < 0.6 and 1.2 < p/GeV < 1.8 and high hµi (9.6 < hµi < 20.6). The bottom portion of each panel shows the ratio of MC simulation to data, separately for the two sets of hadronic physics models. The error bars represent statistical uncertainties.
|η| regions, indicating that the modelling of hadronic interactions, rather than of geometry, is primarily responsible for this discrepancy.
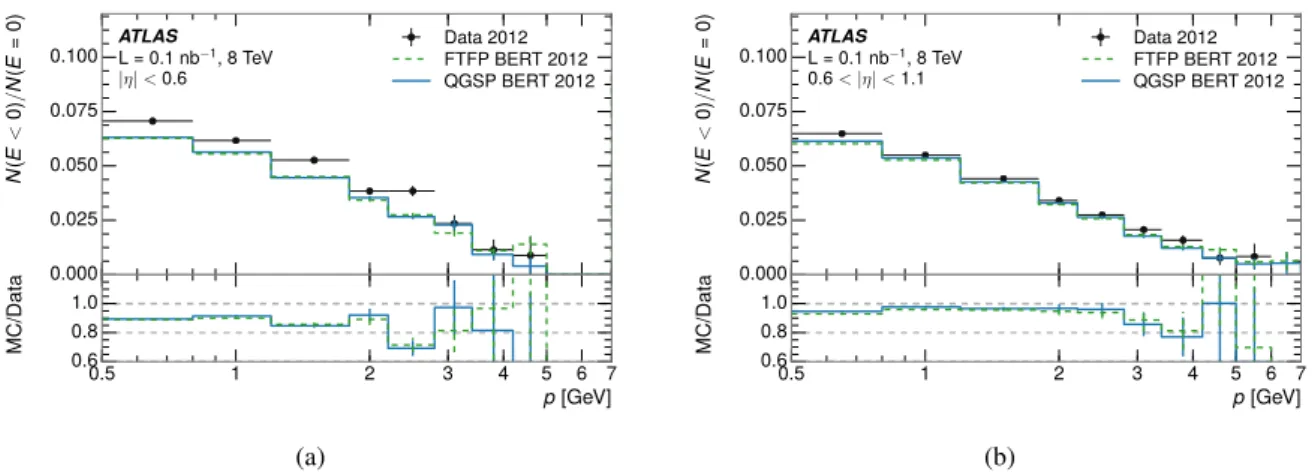
Detector noise, which is largely symmetric, drives the portion of the response distribution with E < 0. This region is dominated by particles that did not have any significant energy deposited in the calorimeter. Thus, the tail can be used to further examine the modelling of calorimeter noise by the simulation. Fig-ure5shows the ratio of the number of tracks with associated E < 0 to those with no associated clusters of energy as a function of track momentum – this is an approximation of the relative rate at which particles with low momenta, or which have scattered before reaching the calorimeter, coincide with a sufficiently large amount of noise that a negative-energy topological cluster is formed. In general, additional de-tector material in the simulation should manifest itself as a higher E = 0 rate in the simulation than in the data, but this effect is cancelled in the ratio. The ratio shows a disagreement at the 10% level in the central region of the calorimeter, but the data and MC simulation are consistent in a more forward region 0.6 < |η| < 1.1. Further forward |η| bins indicate 10%-level disagreements.
0.0 0.2 0.4 0.6 0.8 1.0 N (E ≤ 0) /N ATLAS L = 0.1 nb−1, 8 TeV Positive Charge Data 2012 FTFP BERT 2012 QGSP BERT 2012 0.0 0.2 0.4 0.6 0.8 N (E ≤ 0) /N L = 3.2 nb−1, 7 TeV Data 2010 FTFP BERT 2010 QGSP BERT 2010 0.5 1 2 3 4 5 6 7 10 p [GeV] 0.5 1.0 MC/Data (a) 0.0 0.2 0.4 0.6 0.8 1.0 N (E ≤ 0) /N ATLAS L = 0.1 nb−1, 8 TeV Negative Charge Data 2012 FTFP BERT 2012 QGSP BERT 2012 0.0 0.2 0.4 0.6 0.8 N (E ≤ 0) /N L = 3.2 nb−1, 7 TeV Data 2010 FTFP BERT 2010 QGSP BERT 2010 0.5 1 2 3 4 5 6 7 10 p [GeV] 0.0 0.5 1.0 1.5 MC/Data (b) 0.0 0.2 0.4 0.6 0.8 1.0 N (E ≤ 0) /N ATLAS L = 0.1 nb−1, 8 TeV Positive Charge Data 2012 FTFP BERT 2012 QGSP BERT 2012 0.0 0.2 0.4 0.6 0.8 N (E ≤ 0) /N L = 3.2 nb−1, 7 TeV Data 2010 FTFP BERT 2010 QGSP BERT 2010 0.0 0.5 1.0 1.5 2.0 |η| 0.75 1.00 MC/Data (c) 0.0 0.2 0.4 0.6 0.8 1.0 N (E ≤ 0) /N ATLAS L = 0.1 nb−1, 8 TeV Negative Charge Data 2012 FTFP BERT 2012 QGSP BERT 2012 0.0 0.2 0.4 0.6 0.8 N (E ≤ 0) /N L = 3.2 nb−1, 7 TeV Data 2010 FTFP BERT 2010 QGSP BERT 2010 0.0 0.5 1.0 1.5 2.0 |η| 0.75 1.00 MC/Data (d)
Figure 3: The fraction of tracks as a function (a, b) of momentum and (c, d) of |η| with E ≤ 0 for tracks with positive (a, c) and negative (b, d) charge. The bottom portion of each panel shows the ratio of MC simulation to data, separately for 2010 and 2012, and separately for the two sets of hadronic physics models. The error bars represent statistical uncertainties.
0.0 0.2 0.4 0.6 0.8 1.0 N (E ≤ 0) /N ATLAS L = 0.1 nb−1, 8 TeV Positive Charge Data 2012 FTFP BERT 2012 QGSP BERT 2012 0.0 0.2 0.4 0.6 0.8 N (E ≤ 0) /N L = 3.2 nb−1, 7 TeV Data 2010 FTFP BERT 2010 QGSP BERT 2010 0.1 0.2 0.3 0.4 0.5 0.6 Interaction Lengths 0.6 0.8 1.0 MC/Data (a) 0.0 0.2 0.4 0.6 0.8 1.0 N (E ≤ 0) /N ATLAS L = 0.1 nb−1, 8 TeV Negative Charge Data 2012 FTFP BERT 2012 QGSP BERT 2012 0.0 0.2 0.4 0.6 0.8 N (E ≤ 0) /N L = 3.2 nb−1, 7 TeV Data 2010 FTFP BERT 2010 QGSP BERT 2010 0.1 0.2 0.3 0.4 0.5 0.6 Interaction Lengths 0.6 0.8 1.0 MC/Data (b)
Figure 4: The fraction of tracks as a function of interaction lengths of material in front of the detector with E ≤ 0 for tracks with 1.2 < p/GeV < 1.8 and (a) positive or (b) negative charge. The bottom portion of each panel shows the ratio of MC simulation to data, separately for 2010 and 2012, and separately for the two sets of hadronic physics models. The error bars represent statistical uncertainties.
4.2 Neutral background subtraction
Energy deposits from close-by particles bias the calorimeter measurement of E. While the isolation requirement on the charged-hadron track is efficient at reducing the effect from other charged particles to negligible levels, there is no equivalent method for eliminating the contribution from neutral particles, such as neutral hadrons or photons from π0→γγ decays.
Since neutral particles, which are mostly photons with some low-energy hadrons, deposit their energy mostly in the EM calorimeter, it is possible to measure the background in situ by considering late shower-ing charged hadrons, which behave like minimally-ionisshower-ing particles (MIP) in the EM layers of the calor-imeter. Such late showering hadrons are selected by requiring that they leave less than 1.1 GeV in the EM calorimeter inside a cone of size∆R = 0.1 around their track. They are further required to have energy deposited in the same cone in the hadronic calorimeter that is at least 40% and less than 90% of the track momentum. The energy deposited by close-by neutral particles is then measured in the EM calorimeter in the region 0.1 < ∆R < 0.2 around the MIP particle’s track. A geometric factor of 4/3 is applied to estimate the energy deposits from the neutral-particle background in the whole∆R = 0.2 cone. The mean of this background distribution over many events in a given track momentum and pseudorapidity bin, hE/piBG, estimates the energy deposited by photons and neutral hadrons in the EM calorimeter. This selection is illustrated in Figure1. Using a similar method with the individual layers of the hadronic calorimeter, the energy deposited by the background particles in the hadronic calorimeter was found to be negligible. As described in Ref. [3], an alternative method that used information about the shape of the hadronic shower was used to estimate the neutral-particle background. The difference between this method and the nominal method of about 10% of the background, which itself is generally less than 25%
0.000 0.025 0.050 0.075 0.100 N (E < 0) /N (E = 0) ATLAS L = 0.1 nb−1, 8 TeV |η| < 0.6 Data 2012 FTFP BERT 2012 QGSP BERT 2012 0.5 1 2 3 4 5 6 7 p [GeV] 0.6 0.8 1.0 MC/Data (a) 0.000 0.025 0.050 0.075 0.100 N (E < 0) /N (E = 0) ATLAS L = 0.1 nb−1, 8 TeV 0.6 < |η| < 1.1 Data 2012 FTFP BERT 2012 QGSP BERT 2012 0.5 1 2 3 4 5 6 7 p [GeV] 0.6 0.8 1.0 MC/Data (b)
Figure 5: Ratio of the number of tracks with E < 0 to the number with E= 0 as a function of track momentum, for tracks with (a) |η| < 0.6 and (b) 0.6 < |η| < 1.1. The bottom portion of each panel shows the ratio of MC simulation to data, separately for the two sets of hadronic physics models. The error bars represent statistical uncertainties.
of the measured response, is taken as a systematic uncertainty.
The hE/pi is corrected by the average background to give the corrected average response: hE/piCOR = hE/pi − hE/piBG. This corrected response is the primary observable used in the studies of calorimeter response to isolated charged hadrons in the remainder of this paper.
While this method accounts for the average energy deposited by the neutral-particle background, it cannot account for per-event background fluctuations. This is particularly important when considering threshold effects, since a small background energy deposit might be sufficient to raise the signal in a cell above the threshold required to seed a topological cluster. In events with large background, this can lead to a positive bias in hE/piCOR. Even if the hadronic shower and calorimeter response to the charged hadron were perfectly modeled, significant mis-modelling of the neutral-particle background can lead to different rates of this signal promotion. Above p ≈ 4 GeV, when the fraction of tracks with E = 0 is small, this effect is negligible.
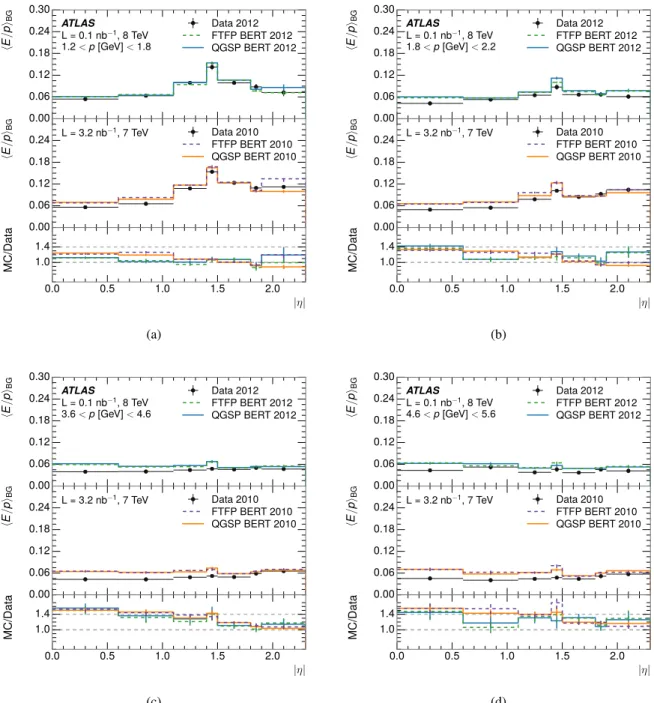
Figure6 and Figure 7 show the measured hE/piBG in data and MC simulation as a function of track momentum and pseudorapidity, respectively. The general shape of the background is reasonably well modeled by the simulations, but important discrepancies exist between the two, such as the simulation’s overestimation of the background at intermediate (2 < p/GeV < 8) track momentum in the central (|η| < 1.1) region of the detector. These differences are attributed to the phenomenological models used to describe non-perturbative QCD processes in Pythia8, as well as the difficulty of correctly modelling the calorimeter response to low-momentum neutral particles. They do not strongly indicate a deficiency in the detector description, which would typically be isolated in a narrow region of |η| away from the well-understood central ID region. The broad discrepancy as a function of |η| shown in Figure7(d) is consistent with a deficiency in the modelling of coherent neutral particle radiation in Pythia8, as the background is consistently and significantly higher in the MC simulation than in the data. Provided the neutral-particle background is correctly accounted for separately in data and MC simulation, however, any imperfection in the modelling of neutral particles can be removed from the comparison of calori-meter response. The neutral-particle background is calculated separately for each dataset and caloricalori-meter configuration considered in this paper.
0.00 0.05 0.10 0.15 0.20 0.25 hE /p iBG ATLAS L = 0.1 nb−1, 8 TeV |η| < 0.6 Data 2012 FTFP BERT 2012 QGSP BERT 2012 0.00 0.05 0.10 0.15 0.20 hE /p iBG L = 3.2 nb−1, 7 TeV Data 2010 FTFP BERT 2010 QGSP BERT 2010 0.5 1 2 3 4 5 6 7 10 20 30 p [GeV] 1.0 1.4 MC/Data (a) 0.00 0.05 0.10 0.15 0.20 0.25 hE /p iBG ATLAS L = 0.1 nb−1, 8 TeV 0.6 < |η| < 1.1 Data 2012 FTFP BERT 2012 QGSP BERT 2012 0.00 0.05 0.10 0.15 0.20 hE /p iBG L = 3.2 nb−1, 7 TeV Data 2010 FTFP BERT 2010 QGSP BERT 2010 0.5 1 2 3 4 5 6 7 10 20 30 p [GeV] 1.0 1.4 MC/Data (b) 0.00 0.05 0.10 0.15 0.20 0.25 hE /p iBG ATLAS L = 0.1 nb−1, 8 TeV 1.8 < |η| < 1.9 Data 2012 FTFP BERT 2012 QGSP BERT 2012 0.00 0.05 0.10 0.15 0.20 hE /p iBG L = 3.2 nb−1, 7 TeV Data 2010 FTFP BERT 2010 QGSP BERT 2010 2 3 4 5 6 7 10 20 30 p [GeV] 1.0 1.4 MC/Data (c) 0.00 0.05 0.10 0.15 0.20 0.25 hE /p iBG ATLAS L = 0.1 nb−1, 8 TeV 1.9 < |η| < 2.3 Data 2012 FTFP BERT 2012 QGSP BERT 2012 0.00 0.05 0.10 0.15 0.20 hE /p iBG L = 3.2 nb−1, 7 TeV Data 2010 FTFP BERT 2010 QGSP BERT 2010 2 3 4 5 6 7 10 20 30 p [GeV] 1.0 1.4 MC/Data (d)
Figure 6: hE/piBGas a function of the track momentum, for tracks with at least 20 TRT hits and (a) |η| < 0.6, (b)
0.6 < |η| < 1.1, (c) 1.8 < |η| < 1.9, and (d) 1.9 < |η| < 2.3. The bottom portion of each panel shows the ratio of MC simulation to data. The error bars represent statistical uncertainties.
0.00 0.06 0.12 0.18 0.24 0.30 hE /p iBG ATLAS L = 0.1 nb−1, 8 TeV 1.2 <p [GeV] < 1.8 Data 2012 FTFP BERT 2012 QGSP BERT 2012 0.00 0.06 0.12 0.18 0.24 hE /p iBG L = 3.2 nb−1, 7 TeV Data 2010 FTFP BERT 2010 QGSP BERT 2010 0.0 0.5 1.0 1.5 2.0 |η| 1.0 1.4 MC/Data (a) 0.00 0.06 0.12 0.18 0.24 0.30 hE /p iBG ATLAS L = 0.1 nb−1, 8 TeV 1.8 <p [GeV] < 2.2 Data 2012 FTFP BERT 2012 QGSP BERT 2012 0.00 0.06 0.12 0.18 0.24 hE /p iBG L = 3.2 nb−1, 7 TeV Data 2010 FTFP BERT 2010 QGSP BERT 2010 0.0 0.5 1.0 1.5 2.0 |η| 1.0 1.4 MC/Data (b) 0.00 0.06 0.12 0.18 0.24 0.30 hE /p iBG ATLAS L = 0.1 nb−1, 8 TeV 3.6 <p [GeV] < 4.6 Data 2012 FTFP BERT 2012 QGSP BERT 2012 0.00 0.06 0.12 0.18 0.24 hE /p iBG L = 3.2 nb−1, 7 TeV Data 2010 FTFP BERT 2010 QGSP BERT 2010 0.0 0.5 1.0 1.5 2.0 |η| 1.0 1.4 MC/Data (c) 0.00 0.06 0.12 0.18 0.24 0.30 hE /p iBG ATLAS L = 0.1 nb−1, 8 TeV 4.6 <p [GeV] < 5.6 Data 2012 FTFP BERT 2012 QGSP BERT 2012 0.00 0.06 0.12 0.18 0.24 hE /p iBG L = 3.2 nb−1, 7 TeV Data 2010 FTFP BERT 2010 QGSP BERT 2010 0.0 0.5 1.0 1.5 2.0 |η| 1.0 1.4 MC/Data (d)
Figure 7: hE/piBG as a function of the track pseudorapidity, for tracks with at least 20 TRT hits and (a) 1.2 <
p/GeV < 1.8, (b) 1.8 < p/GeV < 2.2, (c) 3.6 < p/GeV < 4.6, and (d) 4.6 < p/GeV < 5.6. The bottom portion of each panel shows the ratio of MC simulation to data. The error bars represent statistical uncertainties.
0.0 0.3 0.6 0.9 hE /p iCOR ATLAS L = 0.1 nb−1, 8 TeV NTRT<20 Data 2012 FTFP BERT 2012 QGSP BERT 2012 0.0 0.3 0.6 0.9 hE /p iCOR L = 3.2 nb−1, 7 TeV Data 2010 FTFP BERT 2010 QGSP BERT 2010 0.5 1 2 3 4 5 6 7 10 20 30 p [GeV] 1.0 1.4 MC/Data (a) 0.0 0.3 0.6 0.9 hE /p iCOR ATLAS L = 0.1 nb−1, 8 TeV NTRT>20 Data 2012 FTFP BERT 2012 QGSP BERT 2012 0.0 0.3 0.6 0.9 hE /p iCOR L = 3.2 nb−1, 7 TeV Data 2010 FTFP BERT 2010 QGSP BERT 2010 0.5 1 2 3 4 5 6 7 10 20 30 p [GeV] 1.0 1.4 MC/Data (b)
Figure 8: Comparison of the hE/piCORfor tracks with (a) less than and (b) greater than 20 hits in the TRT. The
bottom portion of each panel shows the ratio of MC simulation to data, separately for the two sets of hadronic physics models, and separately for 2010 and 2012 data. The error bars represent statistical uncertainties.
4.3 Reduction of hadronic interactions in the ID
Part of the difference between the rate of tracks with no associated energy in the simulation and the data (e.g. in Figure4) may be due to geometry differences, since additional material tends to increase the rate of particles that do not reach the calorimeter and deposit significant energy. Another part may be due to poor modelling of secondary particles from hadronic interactions that occur before the calorimeter, as suggested in Section3. Tracks that do not have a large number of hits in the TRT are likely to result from particles that have undergone hadronic interactions while propagating through the ID. The large scattering angles of secondary charged particles, as well as the rate of secondary neutral particles, both contribute to the original track not being extended to the face of the calorimeter. Thus, examining tracks with a small number of hits in the TRT provides information about particles that likely underwent hadronic interactions. A comparison of the hE/piCORfor tracks that do not have a large number of hits in the TRT with those that do is shown in Figure8. The hE/piCORfor tracks without a large number of TRT hits is very poorly modeled by the simulation, showing 25%-level discrepancies at low momenta, suggesting problems with the description of secondary particles from these relatively low-energy nuclear interactions. For tracks with a large number of TRT hits, there remains a 5–10% discrepancy. This discrepancy, which is smaller for 2012 data than in the case of 2010 data, is explored in subsequent sections of the paper. For the remainder of the paper, more than 20 hits are required in the TRT, in order to suppress tracks from particles that undergo nuclear interactions before the calorimeter.
4.4 Background-corrected single-hadron response
The corrected hE/pi variable (hE/piCOR), in which the average neutral-particle background is subtrac-ted, is shown in Figure 9, with statistical uncertainties, for several bins of pseudorapidity. Here, the background estimated in data is subtracted from the raw data hE/pi, and the background estimated in MC simulation is subtracted from the raw MC simulation hE/pi. The maximum momentum that can be effectively probed with the available data is about 30 GeV, and the measurement has large statistical uncertainties above 20 GeV, limiting the comparison. Both the QGSP_BERT and FTFP_BERT MC simula-tion event samples overestimate hE/piCORat low momentum, by approximately 5% in the most central |η| region. In more forward regions (e.g. beyond |η| = 1.8), where the background is well modeled for the same momenta but the material in front of the calorimeter is substantially larger, the MC simulation describes the data to within the uncertainties. Tracks that are assigned calorimeter energy E = 0 are included in these distributions.
4.4.1 Use of clusters or cells in response measurement
The calorimeter response is normally calculated using topological clusters of energy in the calorimeter. Figure10 shows a ratio of the hE/piCORderived directly from the energy deposition in the calorimeter cells near the extrapolated track position, hE/picell, to the hE/piCORcalculated using topological energy clusters, here labelled hE/picluster. For this comparison, all cells within ∆R = 0.2 of the extrapolated track position are included in calculating the cell-level energy. In order to provide a subtraction of the appropriate background contribution, the background is also calculated using cells instead of clusters. This comparison provides a useful test of the modelling of topological clustering effects and the hadronic shower width by the simulation. These distributions agree within the statistical uncertainties for central |η|, demonstrating an excellent modelling of the effect of topological clustering on the calorimeter response distribution. In the more forward region, there are percent-level disagreements. It is also clear that the cell calculation provides a response up to 15% higher in the central region at low momentum, which is expected because of the effect of the threshold on the calorimeter cells applied during the clustering. 4.4.2 Effect of cluster calibration on response measurement
The topological clusters used for the calorimeter response comparison are measured at the EM scale, meaning that the calibration does not attempt to compensate for energy depositions measured by the calorimeter outside of the topological cluster, energy losses in uninstrumented material inside and out-side of the topological cluster, or the non-compensating response of the calorimeter. The local cluster weighting (LCW) technique [2] applies a calibration to the topological cluster energy according to the position and properties of the energy depositions in the topological cluster (e.g. depth in the calori-meter and energy density) in order to account for these effects. Figure11 shows a comparison of the LCW-calibrated hE/piCORin data and simulation, both including and omitting tracks with E = 0. When calculating hE/piCOR with the LCW calibration, the same calibration method is applied to the clusters used to determine the background. The response is significantly higher than that of Figure9(a) due to the calibration, since the calibration raises the average response for the clusters. Agreement between data and MC simulation is almost identical with both calibrations, implying no gross mis-modelling of the hadronic shower properties on which the LCW calibration depends. Agreement is marginally better when considering only tracks with at least one associated topological cluster in the calorimeter, again
0.0 0.2 0.4 0.6 0.8 1.0 hE /p iCOR ATLASL = 0.1 nb−1, 8 TeV |η| < 0.6 Data 2012 FTFP BERT 2012 QGSP BERT 2012 0.0 0.2 0.4 0.6 0.8 hE /p iCOR L = 3.2 nb−1, 7 TeV Data 2010 FTFP BERT 2010 QGSP BERT 2010 0.5 1 2 3 4 5 6 7 10 20 30 p [GeV] 0.8 1.0 1.2 MC/Data (a) 0.0 0.2 0.4 0.6 0.8 1.0 hE /p iCOR ATLASL = 0.1 nb−1, 8 TeV 0.6 < |η| < 1.1 Data 2012 FTFP BERT 2012 QGSP BERT 2012 0.0 0.2 0.4 0.6 0.8 hE /p iCOR L = 3.2 nb−1, 7 TeV Data 2010 FTFP BERT 2010 QGSP BERT 2010 0.5 1 2 3 4 5 6 7 10 20 30 p [GeV] 0.8 1.0 1.2 MC/Data (b) 0.0 0.2 0.4 0.6 0.8 1.0 hE /p iCOR ATLASL = 0.1 nb−1, 8 TeV 1.8 < |η| < 1.9 Data 2012 FTFP BERT 2012 QGSP BERT 2012 0.0 0.2 0.4 0.6 0.8 hE /p iCOR L = 3.2 nb−1, 7 TeV Data 2010 FTFP BERT 2010 QGSP BERT 2010 2 3 4 5 6 7 10 20 30 p [GeV] 0.8 1.0 1.2 MC/Data (c) 0.0 0.2 0.4 0.6 0.8 1.0 hE /p iCOR ATLASL = 0.1 nb−1, 8 TeV 1.9 < |η| < 2.3 Data 2012 FTFP BERT 2012 QGSP BERT 2012 0.0 0.2 0.4 0.6 0.8 hE /p iCOR L = 3.2 nb−1, 7 TeV Data 2010 FTFP BERT 2010 QGSP BERT 2010 2 3 4 5 6 7 10 20 30 p [GeV] 0.8 1.0 1.2 MC/Data (d)
Figure 9: hE/piCOR as a function of track momentum, for tracks with (a) |η| < 0.6, (b) 0.6 < |η| < 1.1, (c)
1.8 < |η| < 1.9, and (d) 1.9 < |η| < 2.3. Tracks not matching any topological energy clusters in the calorimeter are included. The bottom portion of each panel shows the ratio of MC simulation to data. The error bars represent statistical uncertainties.
0.8 1.2 1.6 2.0 hE /p icell /h E /p iclust er ATLAS L = 0.1 nb−1, 8 TeV |η| < 0.6 Data 2012 FTFP BERT 2012 QGSP BERT 2012 0.5 1 2 3 4 5 6 7 10 20 30 p [GeV] 0.90 0.96 1.02 1.08 MC/Data (a) 0.8 1.2 1.6 2.0 hE /p icell /h E /p iclust er ATLAS L = 0.1 nb−1, 8 TeV 0.6 < |η| < 1.1 Data 2012 FTFP BERT 2012 QGSP BERT 2012 0.5 1 2 3 4 5 6 7 10 20 30 p [GeV] 0.90 0.96 1.02 1.08 MC/Data (b)
Figure 10: Ratio of hE/piCORcalculated with cells to hE/piCORcalculated with topological clusters as a function
of track momentum, for tracks with (a) |η| < 0.6 and (b) 0.6 < |η| < 1.1. The bottom portion of each panel shows the ratio of MC simulation to data. The error bars represent statistical uncertainties.
suggesting a discrepancy in the description of hadronic interactions before the sampling portion of the calorimeter. The calibrated response to single particles, which is not unity with either of these selections, is a result of imperfections in the calibration procedure. Nonetheless, the momentum dependence of the response is almost completely removed by the LCW calibration when considering tracks with at least one associated topological cluster. As the discrepancies between MC simulation and data are most critical for the studies presented here and the LCW calibration does not affect these discrepancies significantly, in the remainder of this paper the EM-scale response is used for almost all comparisons.
4.4.3 Charge dependence of response
The hE/piCORfor positive and negative tracks, including tracks that do not match a topological cluster, is shown in Figure12. The two sets of hadronic physics models provide an almost identical result for positively charged tracks, which are dominated by π+, K+, and protons. At low momenta the models are identical, and at high momenta they are tuned to the same thin-target data. For negatively charged tracks, some difference between QGSP_BERT and FTFP_BERT is observed.
This difference is primarily due to the difference in the modelling of the response to anti-protons, as is sug-gested by Figure13, which compares the E/p distributions for negatively charged and positively charged tracks in a low-momentum bin. The two sets of hadronic physics models show identical distributions for positively charged tracks and show a clear discrepancy for negatively charged tracks with E ≈ 1.5 × p. In this momentum bin, the average calorimeter response is around 0.4, as seen in Figure9(a). Anti-protons, however, also contribute their annihilation energy in the calorimeter. This additional 2 GeV (938 MeV for each of the anti-proton and the proton with which it annihilates), after including the effect of the non-compensating response of the calorimeter (roughly 50%), gives an extra 1 GeV to the energy measured in the calorimeter. This difference is explored further in Section5.4.
−0.25 0.00 0.25 0.50 0.75 1.00 hE /p iCOR ATLAS L = 0.1 nb−1, 8 TeV LCW Clusters Ncluster≥ 0 Data 2012 FTFP BERT 2012 QGSP BERT 2012 −0.25 0.00 0.25 0.50 0.75 hE /p iCOR L = 3.2 nb−1, 7 TeV Data 2010 FTFP BERT 2010 QGSP BERT 2010 0.5 1 2 3 4 5 6 7 10 20 30 p [GeV] 0.8 1.0 1.2 MC/Data (a) −0.25 0.00 0.25 0.50 0.75 1.00 hE /p iCOR ATLAS L = 0.1 nb−1, 8 TeV LCW Clusters Ncluster>0 Data 2012 FTFP BERT 2012 QGSP BERT 2012 −0.25 0.00 0.25 0.50 0.75 hE /p iCOR L = 3.2 nb−1, 7 TeV Data 2010 FTFP BERT 2010 QGSP BERT 2010 0.5 1 2 3 4 5 6 7 10 20 30 p [GeV] 0.8 1.0 1.2 MC/Data (b)
Figure 11: Comparison of the hE/piCORcalculated using LCW-calibrated topological clusters as a function of track
momentum, corrected for the neutral-particle background, for tracks with |η| < 0.6, and (a) zero or more associated topological clusters or (b) one or more associated topological clusters. Figure9(a)shows the same quantity as Figure11(a), calculated using EM-scale topological clusters. The bottom portion of each panel shows the ratio of MC simulation to data, separately for the two sets of hadronic physics models, and separately for 2010 and 2012 data. The error bars represent statistical uncertainties.
4.4.4 Single-hadron response in events with pile-up
Historically, the calorimeter response to isolated single particles has been measured using events with only a single proton–proton collision in the event. Pile-up contributes additional neutral-particle background to the event that is normally only removed on average from the topological clusters. The charged-particle background from pile-up can still be removed using the track isolation requirement. Moreover, fluctu-ations of the neutral-particle background significantly worsen the energy resolution for low-momentum particles. Nonetheless, as the background subtraction technique in this paper depends only on the aver-age background distributions, the (pile-up and background-corrected) hE/piCORcan still be measured in events with pile-up, in this case also binned in hµi and the number of reconstructed vertices. To ensure a fair comparison, all data and MC simulation samples used in these comparisons are reconstructed with consistent calorimeter thresholds corresponding to hµi= 30.
There are two response issues to be addressed in these events. The first is the dependence of the response on the number of reconstructed vertices, which is an excellent proxy for the in-time pile-up. The raw response, background, and background-corrected response to isolated charged hadrons as a function of the number of reconstructed vertices is shown in Figure14. There is a clear dependence in both the raw and background distributions. The difference is almost completely removed, however, in the hE/piCOR distribution. After the background subtraction, the values are also in good agreement with those calculated in the low-hµi dataset. In each case, similar trends are present in both data and MC simulation. In the MC simulation with pile-up, the events are weighted such that the hµi distribution matches that of the data,
0.0 0.2 0.4 0.6 0.8 1.0 hE /p iCOR ATLASL = 0.1 nb−1, 8 TeV Positive Charge Data 2012 FTFP BERT 2012 QGSP BERT 2012 0.0 0.2 0.4 0.6 0.8 hE /p iCOR L = 3.2 nb−1, 7 TeV Data 2010 FTFP BERT 2010 QGSP BERT 2010 0.5 1 2 3 4 5 6 7 10 20 30 p [GeV] 0.8 1.0 1.2 MC/Data (a) 0.0 0.2 0.4 0.6 0.8 1.0 hE /p iCOR ATLASL = 0.1 nb−1, 8 TeV Negative Charge Data 2012 FTFP BERT 2012 QGSP BERT 2012 0.0 0.2 0.4 0.6 0.8 hE /p iCOR L = 3.2 nb−1, 7 TeV Data 2010 FTFP BERT 2010 QGSP BERT 2010 0.5 1 2 3 4 5 6 7 10 20 30 p [GeV] 0.8 1.0 1.2 MC/Data (b)
Figure 12: Comparison of the hE/piCORfor (a) positive and (b) negative tracks as a function of track momentum,
corrected for the neutral-particle background, for tracks with |η| < 0.6, in simulation with the FTFP_BERT and QGSP_BERT sets of hadronic physics models. The bottom portion of each panel shows the ratio of MC simulation to data, separately for the two sets of hadronic physics models, and separately for 2010 and 2012 data. The error bars represent statistical uncertainties.
in order to ensure that out-of-time pile-up contributions are well modeled. Both samples are required to have hµi < 20.6.
The ATLAS calorimeter is additionally sensitive to out-of-time pile-up, collisions in bunch crossings close in time to the one that was selected by the trigger, although this dependence is mitigated somewhat by the bipolar pulse shape of the calorimeter electronics. A bunch-dependent correction is applied to the calorimeter energy measured in each calorimeter cell to correct for the residual average energy shift per bunch due to the bunch train structure and the fluctuations in the luminosity per bunch crossing. Energy deposits up to 100 ns after, and up to 800 ns before the collision of interest may affect the energy measured in a calorimeter cell. Thus, an equally important test is the stability of the response to isolated charged hadrons against the average number of proton–proton collisions per bunch crossing, hµi. This dependence is shown in Figure15. Again, there is a dependence in both the raw and background distributions, while the hE/piCORdistribution shows that the pile-up is well compensated for by the background subtraction scheme. As shown in the figure, the low-hµi values of hE/piCORare consistent with those at higher values of hµi.
4.4.5 Single-hadron response in the hadronic calorimeter
To measure the response of the hadronic calorimeter, only tracks that deposit an amount of energy in the EM calorimeter consistent with a MIP are selected. The criteria for selecting a MIP are identical to those described in Section4.2. The measured energy corresponds to the energy of the topological clusters in the hadronic calorimeter within∆R = 0.2 of the extrapolated track.
10−6 10−5 10−4 10−3 10−2 10−1 100 101 Normalized Distribution ATLAS Simulation
Positive Charge FTFP BERT 2012QGSP BERT 2012
−1.0 −0.5 0.0 0.5 1.0 1.5 2.0 2.5 3.0 E/p 0.8 1.0 1.2 1.4 FTFP/QGSP (a) 10−6 10−5 10−4 10−3 10−2 10−1 100 101 Normalized Distribution ATLAS Simulation
Negative Charge FTFP BERT 2012QGSP BERT 2012
−1.0 −0.5 0.0 0.5 1.0 1.5 2.0 2.5 3.0 E/p 0.8 1.0 1.2 1.4 FTFP/QGSP (b)
Figure 13: Comparison of the E/p distributions for (a) positive and (b) negative tracks with 0.8 < p/GeV < 1.2 and |η| < 0.6, in simulation with the FTFP_BERT and QGSP_BERT sets of hadronic physics models. The bottom portion of each panel shows the ratio of the two sets of hadronic physics models. The error bars represent statistical uncertainties.
Figure16shows a comparison of the data to the MC simulation for tracks passing this MIP selection of hE/piHad
RAW, built using topological clusters in the hadronic calorimeter, calibrated at the EM scale and after the LCW calibration, in the central region, |η| < 0.6. The raw and corrected values are identical because the background in the tile calorimeter is negligible. Agreement of the data and the simulation is better than in the inclusive hE/piCOR shown in the previous section. Any residual neutral-particle background effects that might be present in the response to inclusive single particles are negligible in this comparison, but particles are selected that had a particularly late shower, weakening the dependence on the distribution of secondary particles from hadronic interactions. This measure of the response is repeated for different detector regions. Figure 17 shows the response of the hadronic calorimeter for 0.6 < |η| < 1.1 and 1.1 < |η| < 1.4.
4.4.6 Single-hadron response in the EM calorimeter
In order to examine the response of the EM calorimeter alone, particles are selected that deposit most of their energy in the EM calorimeter. In this case, tracks are required to have no associated energy in the hadronic calorimeter. Such a selection is inherently more sensitive to neutral-particle backgrounds, which deposit most of their energy in the EM calorimeter. A comparison of hE/piEMCOR, the hE/piCORbuilt only from energy deposits in the EM calorimeter, between data and MC simulation is shown in Figure18
for EM scale response and after the LCW calibration is applied. These distributions show disagreement at the 5% level over much of the momentum range, for both topological cluster calibrations. This is consistent with the description of the response of this calorimeter component being the main cause of the discrepancy observed in the inclusive distributions.
4.4.7 Modelling of response with modified calorimeter noise thresholds
During the low-hµi data-taking period, the noise threshold used for clustering of energy included only electronics noise. During most of the data-taking period in 2012, however, a different calorimeter noise
0.0 0.3 0.6 0.9 1.2 hE /p iRA W ATLAS L = 24-551 nb−1, 8 TeV |η| < 0.6 1.2 <p [GeV] < 1.8
QGSP BERT 2012, Low hµi Data 2012, Low hµi Data 2012 QGSP BERT 2012 0 2 4 6 8 10 12 14 16 Nvertex 0.75 1.00 1.25 MC/Data (a) 0.0 0.3 0.6 0.9 1.2 hE /p iBG ATLAS L = 24-551 nb−1, 8 TeV |η| < 0.6, 1.2 < p [GeV] < 1.8 QGSP BERT 2012, Low hµi Data 2012, Low hµi Data 2012 QGSP BERT 2012 0 2 4 6 8 10 12 14 16 Nvertex 0.0 0.5 1.0 1.5 MC/Data (b) 0.0 0.3 0.6 0.9 1.2 hE /p iCOR ATLASL = 24-551 nb−1, 8 TeV |η| < 0.6 1.2 <p [GeV] < 1.8
QGSP BERT 2012, Low hµi Data 2012, Low hµi Data 2012 QGSP BERT 2012 0 2 4 6 8 10 12 14 16 Nvertex 0.4 0.8 1.2 1.6 MC/Data (c) 0.0 0.3 0.6 0.9 1.2 hE /p iCOR ATLASL = 24-551 nb−1, 8 TeV |η| < 0.6 1.8 <p [GeV] < 50
QGSP BERT 2012, Low hµi Data 2012, Low hµi Data 2012 QGSP BERT 2012 0 2 4 6 8 10 12 14 16 Nvertex 0.4 0.8 1.2 1.6 MC/Data (d)
Figure 14: The (a) hE/piRAW, (b) hE/piBG, and (c) hE/piCORwith 1.2 < p/GeV < 1.8 and (d) hE/piCORwith
1.8 < p/GeV < 50 as a function of the number of reconstructed primary vertices, for tracks with |η| < 0.6 and for hµi < 20.6. Here, low-hµi refers to data taken with average pile-up hµi 1. The bottom portion of each panel shows the ratio of MC simulation to data. The error bars represent statistical uncertainties.
threshold setting was applied when defining topological clusters. This higher threshold serves to suppress pile-up, while lowering the clustering efficiency for true energy deposits. A comparison of the raised threshold used for most of 2012 (corresponding to hµi = 30) to the threshold used during the low-hµi data-taking period (corresponding to hµi= 0) in the same dataset is shown in Figure19. When including a higher threshold, as expected, a higher fraction of tracks are not associated with a topological cluster because a more significant energy deposit is required to seed a cluster. This manifests as a significant drop in the average response at low momentum. At high momentum (p > 6 GeV), however, and when considering only tracks that match to at least one topological cluster, agreement between the two threshold settings is typically within 10%. As most pile-up consists of low-momentum particles, this is an indication that the higher threshold setting is successful at rejecting pile-up, while keeping and not altering the high-energy signals typically associated with energetic jets. When excluding tracks that do not match any cluster, at low momentum the higher minimum cluster energy increases the average response, because the majority of tracks match only one cluster. At moderate momenta (2 < p/GeV < 7), most tracks match more than one cluster, and a low-energy cluster is cut away by the higher threshold, resulting in a reduction in hE/piCOR. Figure20shows the same comparison for a higher |η| range.
0.0 0.2 0.4 0.6 0.8 1.0 hE /p iRA W ATLAS L = 24-551 nb−1, 8 TeV |η| < 0.6 1.2 <p [GeV] < 1.8
QGSP BERT 2012, Low hµi Data 2012, Low hµi Data 2012 QGSP BERT 2012 0 5 10 15 20 hµi 0.75 1.00 1.25 MC/Data (a) 0.0 0.2 0.4 0.6 0.8 1.0 hE /p iBG ATLAS L = 24-551 nb−1, 8 TeV |η| < 0.6 1.2 <p [GeV] < 1.8
QGSP BERT 2012, Low hµi Data 2012, Low hµi Data 2012 QGSP BERT 2012 0 5 10 15 20 hµi 0.0 0.6 1.2 1.8 MC/Data (b) 0.0 0.2 0.4 0.6 0.8 1.0 hE /p iCOR ATLASL = 24-551 nb−1, 8 TeV |η| < 0.6 1.2 <p [GeV] < 1.8
QGSP BERT 2012, Low hµi Data 2012, Low hµi Data 2012 QGSP BERT 2012 0 5 10 15 20 hµi 0.75 1.00 1.25 MC/Data (c) 0.0 0.2 0.4 0.6 0.8 1.0 hE /p iCOR ATLASL = 24-551 nb−1, 8 TeV |η| < 0.6 1.8 <p [GeV] < 50
QGSP BERT 2012, Low hµi Data 2012, Low hµi Data 2012 QGSP BERT 2012 0 5 10 15 20 hµi 0.75 1.00 1.25 MC/Data (d)
Figure 15: The (a) hE/piRAW, (b) hE/piBG, and (c) hE/piCORwith 1.2 < p/GeV < 1.8 and (d) hE/piCORwith
1.8 < p/GeV < 50 as a function of hµi for tracks with |η| < 0.6. Here, low-hµi refers to data taken with average pile-up hµi 1. The bottom portion of each panel shows the ratio of MC simulation to data. The error bars represent statistical uncertainties.
Figure21shows the ratio of hE/piCORwith higher threshold to hE/piCORwith the nominal threshold for data and MC simulation, where tracks with E ≤ 0 have been excluded. The data and MC simulation agree over the entire range of momentum.
The change in threshold settings affects the EM calorimeter in particular, because particles from pile-up tend to be low-energy and deposit most of their energy in the EM calorimeter, leading to more similar threshold settings in the hadronic calorimeter when calculated with and without pile-up. For tracks leav-ing significant energy in the tile calorimeter and only minimal energy in the EM calorimeter, therefore, the two topological cluster settings are expected to provide comparable results. This comparison is shown in Figure22 for two different ranges of |η|. As expected, agreement is better than 5% above 800 MeV, and the distributions are statistically consistent over most of the range.
0.60 0.75 0.90 hE /p i Had RAW ATLAS L = 0.1 nb−1, 8 TeV |η| < 0.6 EM Scale Data 2012 FTFP BERT 2012 QGSP BERT 2012 0.5 1 2 3 4 5 6 7 10 20 30 p [GeV] 0.8 1.0 1.2 MC/Data (a) 0.60 0.75 0.90 hE /p i Had RAW ATLAS L = 0.1 nb−1, 8 TeV |η| < 0.6 LCW Clusters Data 2012 FTFP BERT 2012 QGSP BERT 2012 0.5 1 2 3 4 5 6 7 10 20 30 p [GeV] 0.8 1.0 1.2 MC/Data (b)
Figure 16: Comparison of the response of the hadronic calorimeter as a function of track momentum between the data and MC simulation in |η| < 0.6 (a) at the EM-scale and (b) after the LCW calibration. The bottom portion of each panel shows the ratio of MC simulation to data, separately for the two sets of hadronic physics models. The error bars represent statistical uncertainties.
0.60 0.75 0.90 hE /p i Had RAW ATLAS L = 0.1 nb−1, 8 TeV 0.6 < |η| < 1.1 Data 2012 FTFP BERT 2012 QGSP BERT 2012 0.5 1 2 3 4 5 6 7 10 20 30 p [GeV] 0.8 1.0 1.2 MC/Data (a) 0.60 0.75 0.90 hE /p i Had RAW ATLAS L = 0.1 nb−1, 8 TeV 1.1 < |η| < 1.4 Data 2012 FTFP BERT 2012 QGSP BERT 2012 0.5 1 2 3 4 5 6 7 10 20 30 p [GeV] 0.8 1.0 1.2 MC/Data (b)
Figure 17: Response of the hadronic calorimeter as a function of track momentum in (a) 0.6 < |η| < 1.1 and (b) 1.1 < |η| < 1.4 at the EM-scale. The bottom portion of each panel shows the ratio of MC simulation to data, separately for the two physics sets of hadronic physics models. The error bars represent statistical uncertainties.
0.0 0.4 0.8 1.2 1.6 hE /p i EM COR ATLAS L = 0.1 nb−1, 8 TeV |η| < 0.6 EM Scale Data 2012 FTFP BERT 2012 QGSP BERT 2012 0.5 1 2 3 4 5 6 7 10 20 p [GeV] 0.9 1.0 1.1 MC/Data (a) 0.0 0.4 0.8 1.2 1.6 hE /p i EM COR ATLAS L = 0.1 nb−1, 8 TeV |η| < 0.6 LCW Clusters Data 2012 FTFP BERT 2012 QGSP BERT 2012 0.5 1 2 3 4 5 6 7 10 20 p [GeV] 0.9 1.0 1.1 MC/Data (b)
Figure 18: Comparison of the response of the EM calorimeter as a function of track momentum between the data and MC simulation in |η| < 0.6, (a) at the EM-scale and (b) with the LCW calibration. The bottom portion of each panel shows the ratio of MC simulation to data, separately for the two physics sets of hadronic physics models. The error bars represent statistical uncertainties.
0.0 0.2 0.4 0.6 0.8 1.0 hE /p iCOR ATLASL = 0.1 nb−1, 8 TeV |η| < 0.6 30hµi Threshold Nominal 0.5 1 2 3 4 5 6 7 10 20 30 p [GeV] 0.50 0.75 1.00 1.25 hµ i = 30/Nom (a) 0.0 0.2 0.4 0.6 0.8 1.0 hE /p iCOR ATLASL = 0.1 nb−1, 8 TeV |η| < 0.6 |E| > 0 30hµi Threshold Nominal 0.5 1 2 3 4 5 6 7 10 20 30 p [GeV] 0.50 0.75 1.00 1.25 hµ i = 30/Nom (b)
Figure 19: Comparison of the response of the calorimeter between the nominal topological cluster threshold and the threshold corresponding to hµi= 30 with |η| < 0.6. (a), with no requirement on E/p, and (b), with E/p > 0. The bottom portion of each panel shows the ratio of the response with the different thresholds. The error bars represent statistical uncertainties.
0.0 0.3 0.6 0.9 1.2 hE /p iCOR ATLASL = 0.1 nb−1, 8 TeV 0.6 < |η| < 1.1 30hµi Threshold Nominal 0.5 1 2 3 4 5 6 7 10 20 30 p [GeV] 0.50 0.75 1.00 1.25 hµ i = 30/Nom (a) 0.0 0.3 0.6 0.9 1.2 hE /p iCOR ATLASL = 0.1 nb−1, 8 TeV 0.6 < |η| < 1.1 |E| > 0 30hµi Threshold Nominal 0.5 1 2 3 4 5 6 7 10 20 30 p [GeV] 0.50 0.75 1.00 1.25 hµ i = 30/Nom (b)
Figure 20: Comparison of the response of the calorimeter between the nominal topological cluster threshold and the threshold corresponding to hµi = 30 with 0.6 < |η| < 1.1. (a), with no requirement on E/p, and (b), with E/p > 0. The bottom portion of each panel shows the ratio of the response with the different thresholds. The error bars represent statistical uncertainties.
0.8 1.2 1.6 2.0 hE /p iµ=30 /hE /p inominal ATLAS L = 0.1 nb−1, 8 TeV |η| < 0.6 Data 2012 QGSP BERT 2012 0.5 1 2 3 4 5 6 7 10 20 30 p [GeV] 0.96 1.04 1.12 MC/Data (a) 0.8 1.2 1.6 2.0 hE /p iµ=30 /hE /p inominal ATLAS L = 0.1 nb−1, 8 TeV 0.6 < |η| < 1.1 Data 2012 QGSP BERT 2012 0.5 1 2 3 4 5 6 7 10 20 30 p [GeV] 0.96 1.04 1.12 MC/Data (b)
Figure 21: Ratio of the response of the calorimeter between the threshold corresponding to hµi= 30 and the nominal topological cluster threshold with (a) |η| < 0.6 and (b) 0.6 < |η| < 1.1, excluding tracks with E ≤ 0. The bottom portion of each panel shows the ratio of MC simulation to data. The error bars represent statistical uncertainties.
0.60 0.75 0.90 hE /p i Had RA W ATLAS L = 0.1 nb−1, 8 TeV |η| < 0.6 30hµi Threshold Nominal 0.5 1 2 3 4 5 6 7 10 20 30 p [GeV] 0.96 1.04 1.12 hµ i = 30/Nom (a) 0.60 0.75 0.90 hE /p i Had RA W ATLAS L = 0.1 nb−1, 8 TeV 0.6 < |η| < 1.1 30hµi Threshold Nominal 0.5 1 2 3 4 5 6 7 10 20 30 p [GeV] 0.96 1.04 1.12 hµ i = 30/Nom (b)
Figure 22: Comparison of the response of the hadronic calorimeter with the nominal topological cluster threshold to that with the threshold corresponding to hµi= 30 for (a) |η| < 0.6 and (b) 0.6 < |η| < 1.1. The bottom portion of each panel shows the ratio of the response with the different thresholds. The error bars represent statistical uncertainties.