Publisher’s version / Version de l'éditeur:
Magnetic Resonance in Medicine, 63, 5, pp. 1346-1356, 2010-05-01
READ THESE TERMS AND CONDITIONS CAREFULLY BEFORE USING THIS WEBSITE.
https://nrc-publications.canada.ca/eng/copyright
Vous avez des questions? Nous pouvons vous aider. Pour communiquer directement avec un auteur, consultez la première page de la revue dans laquelle son article a été publié afin de trouver ses coordonnées. Si vous n’arrivez pas à les repérer, communiquez avec nous à [email protected].
Questions? Contact the NRC Publications Archive team at
[email protected]. If you wish to email the authors directly, please see the first page of the publication for their contact information.
NRC Publications Archive
Archives des publications du CNRC
This publication could be one of several versions: author’s original, accepted manuscript or the publisher’s version. / La version de cette publication peut être l’une des suivantes : la version prépublication de l’auteur, la version acceptée du manuscrit ou la version de l’éditeur.
For the publisher’s version, please access the DOI link below./ Pour consulter la version de l’éditeur, utilisez le lien DOI ci-dessous.
https://doi.org/10.1002/mrm.22295
Access and use of this website and the material on it are subject to the Terms and Conditions set forth at Optimum SNR data compression in hardware using an Eigencoil array King, Scott B.; Varosi, Steve M.; Duensing, G. Randy
https://publications-cnrc.canada.ca/fra/droits
L’accès à ce site Web et l’utilisation de son contenu sont assujettis aux conditions présentées dans le site LISEZ CES CONDITIONS ATTENTIVEMENT AVANT D’UTILISER CE SITE WEB.
NRC Publications Record / Notice d'Archives des publications de CNRC:
https://nrc-publications.canada.ca/eng/view/object/?id=fde268a8-117b-48e9-b3d3-e073c836313b https://publications-cnrc.canada.ca/fra/voir/objet/?id=fde268a8-117b-48e9-b3d3-e073c836313b
Optimum SNR data compression in hardware using an Eigencoil array
King, Scott B.; Varosi, Steve M.; Duensing, G. Randy
Keywords:
phased array; signal-to-noise ratio; SNR; receiver channel reduction; data compression
Abstract
With the number of receivers available on clinical MRI systems now ranging from 8 to 32 channels, data compression methods are being explored to lessen the demands on the computer for data handling and processing. Although software-based methods of compression after reception lessen computational requirements, a hardware-based method before the receiver also reduces the number of receive channels required. An eight-channel Eigencoil array is constructed by placing a hardware radiofrequency signal combiner inline after preamplification, before the receiver system. The Eigencoil array produces signal-to-noise ratio (SNR) of an optimal reconstruction using a standard sum-of-squares reconstruction, with peripheral SNR gains of 30% over the standard array. The concept of “receiver channel reduction” or MRI data compression is demonstrated, with optimal SNR using only four channels, and with a three-channel Eigencoil, superior sum-of-squares SNR was achieved over the standard eight-three-channel array. A three-channel Eigencoil portion of a product neurovascular array confirms in vivo SNR performance and demonstrates parallel MRI up to R = 3. This SNR-preserving data compression method advantageously allows users of MRI systems with fewer receiver channels to achieve the SNR of higher-channel MRI systems. Magn Reson Med 63:1346–1356, 2010. © 2010 Wiley-Liss, Inc.
In a typical phased-array data acquisition, signals from individual array elements are passed into separate low-input impedance, low-noise preamplifiers and then through separate receivers to the host computer for image reconstruction through combination of the individual images of each receiver channel (1). Individual channel images are combined in the image domain to produce a single composite image. It is desired to obtain maximum signal-to-noise ratio (SNR) at every pixel location over a large field of view. The industry standard method of image combination used on all MRI scanners is the sum-of-squares technique. It had been shown (1) that even though the sum-of-squares technique is not the SNR-optimal method of array-image
combination, it would produce at least 91% (and within a few percent for most pixels) of the maximum SNR available for every pixel in the composite image given certain conditions. For a truly optimal SNR, the reconstruction is given using a matched filter weighting (1–4). In the past, the reason for not employing an optimal combination on clinical MRI scanners was that the sum-of-squares technique was computationally simple to implement. The additional effort associated with a noise correlation measurement and further matched filter matrix multiplication of an optimal-SNR reconstruction did not seem reasonable for the small benefits offered (1, 5). The early work predicting that greater than 91% of the optimal SNR was achieved using a
sum-of-squares reconstruction was demonstrated on a two-element array of linear elements such as in spine arrays. But recently, it has been shown that for certain arrays, in particular volume arrays of large numbers of array elements, employing optimal image reconstruction strategies can indeed result in significant SNR gains relative to the sum-of-squares technique (6, 7). The steadily increasing number of receiver channels available on MRI systems, which have allowed employment of up to 32 channel arrays on clinical MRI scanners (8–10) and 128 channel arrays on research MRI scanners (11, 12), has put even larger demands on the computer, resulting in slower data handling and processing. Therefore, it is desirable to utilize a method that retains the optimal SNR benefits of large arrays while minimizing the amount of data acquired, ideally without the computational efforts of a full optimal reconstruction.
The concept of precombining the signals from individual array elements, based on the eigenmodes of an array (13, 14) may offer a solution. Signal combination can be done in
hardware before the receiver, the so-called Eigencoil array (7) and mode matrix (15) concepts, so that it may be possible to reduce the number of receivers required, or done in software after the data are received, the so-called array compression concept (16, 17), or simply by using only those channels that contribute significantly to the reconstruction (18), so that at least the
computational efforts of optimizing SNR and reconstructing images from multichannel data can be minimized. Alternatively, it is also possible to construct coils that inherently produce one or more eigenmodes (19, 20).
Based on the eigenmode behavior of volume array structures (14), we will describe in detail a method for obtaining optimal SNR gains in hardware, using the standard sum-of-squares reconstruction, and an Eigencoil array (7). Finally, we will demonstrate “receiver channel reduction” where such Eigencoil arrays can be used to achieve equivalent SNR of an N-channel array coil with, for instance, only N/2 receiver channels, leading to absolute maximum SNR for a given number of receiver channels.
THEORY
In a previous paper (14), the theoretical background for forming eigenmodes of a phased array was given, to which the reader is referred. It was shown that for an n-element phased array whose preamplifier outputs are the signal vectors s = (s1… sn), and corresponding n × n
Hermitian (Nmn = Nnm*) noise covariance matrix
(1)
eigenmode signal vectors can be created by the transformation
(2)
where T′ is the conjugate transpose of a matrix whose columns are the eigenvectors of N, λ is a diagonal matrix of real eigenvalues of N, and K′ is the signal combiner matrix associated with this basis transformation. The significance of this new eigenmode basis set of image vectors is
that the new effective noise correlation matrix is diagonal ( ). This means two things: effectively no coupling exists between these modes, so therefore the eigenmodes are orthogonal, and also, all channels have the same noise level, so the eigenmodes are whitened. On most MRI scanners, a noise variance correction is applied during reconstruction to account for differences in noise levels of separate receive channels, so therefore the λ term in Eq. 2 is not absolutely necessary. It was shown that in this basis an optimal SNR reconstruction could be obtained from a simple sum-of-squares algorithm without noise variance correction. That is,
(3)
where is the conjugate transpose of .
The SNR for the sum-of-squares reconstruction is calculated from,
(4)
Although the new optimal SNR eigenmode image basis transformation can be formed in software, it will be shown how it is much more beneficial to do this in hardware before input to the receivers. For instance, after preamplification, signals coming from individual array elements may be combined with reactive radiofrequency (RF) combiner networks without significant loss in SNR. If some basic symmetry exists between the n-elements of the array, such as an array of equal-sized elements, spaced equally about a cylinder, then the noise correlation matrix N will also exhibit this symmetry, with many off-diagonal values being equal, and therefore there may exist some degeneracy between the eigenmodes. The number of degenerate eigenmodes (d) means the n-element phased array has degree m = n − d and hence m < n. In this paper, this degeneracy will be exploited for optimal data compression/channel reduction and improved SNR for a given number of RF receive channels.
Design
Assuming that signal crosstalk due to mutual inductance coupling is minimized, a purely resistive and hence real noise-coupling matrix results. Consider an array of eight equal-sized rectangular elements, each 25 cm long, uniformly spaced with zero overlap about a 24-cm-diameter cylinder (14), symmetrically loaded with a saline phantom. For such an array, the resistive coupling coefficient between nearest neighbor elements (R12) is on the order +0.35, next-nearest neighbors is close to zero (R13), and the last two independent resistive couplings (R14 and R15) are both about −0.3. Eigenmode analysis (14) of the coupling matrix of this array reveals the theoretical eigenvectors/eigenvalues shown in Table 1. As expected, all eigenvectors are orthogonal to each other, with purely real eigenvalues. Although this is not intuitive, the key realization in this work is that these eigenvectors represent the linearly polarized modes of the eight-element birdcage resonator (21). Therefore, the degenerate eigenvectors can be linearly mixed/combined with a simple ±90° phase applied to one vector to form two new
quadrature/antiquadrature pairs of eigenvectors, which also preserves the degenerate
eigenvalues. The magnitude and phase of the new theoretical quad/antiquad eigenvectors are shown in Table 2. Each mode is a linear combination of signals from each of the array elements
(5)
where i is the array element and m is the quad/antiquad birdcage mode. Each eigenmode has an incremental phase of mπ/4 delivered to each array element, for a total azimuthal phase variation of m2π.
Table 1. Theoretical Eigenvectors (Columns) and Corresponding Eigenvalues (Bottom Row) of the Resistance Matrix of the Eight-Channel Array
−0.35355 0.11945 0.48552 0.23641 0.44058 −0.11839−0.48578 −0.35355 −0.35355 0.42778 0.25886 −0.44058 0.23641 0.42721 0.25978 0.35355 −0.35355 0.48552 −0.11945−0.23641 −0.44058 −0.485780.11839 −0.35355 −0.35355 0.25886 −0.427780.44058 −0.23641 0.25978 −0.42721 0.35355 −0.35355 −0.11945 −0.485520.23641 0.44058 0.11839 0.48578 −0.35355 −0.35355 −0.42778 −0.25886−0.44058 0.23641 −0.42721−0.25978 0.35355 −0.35355 −0.48552 0.11945 −0.23641 −0.44058 0.48578 −0.11839 −0.35355 −0.35355 −0.25886 0.42778 0.44058 −0.23641 −0.259780.42721 0.35355 0.8 2.2192 2.2192 0.7 0.7 0.38076 0.38076 0.6
Table 2. Theoretical Quad/Antiquad Eigenvectors (Columns) and Corresponding Eigenvalues (Bottom Row) of the Resistance Matrix of the Eight-Channel Array
0.35∠ 0° 0.5∠ 0°0.5∠ 0° 0.5∠ 0° 0.5∠ 0° 0.5∠ 0° 0.5∠ 0° 0.35∠ 0° 0.35∠ 0° 0.5∠ 45° 0.5∠ −45° 0.5∠ 90° 0.5∠ −90° 0.5∠ 135° 0.5∠ −135° 0.35∠ 180° 0.35∠ 0° 0.5∠ 90° 0.5∠ −90° 0.5∠ 180° 0.5∠ −180° 0.5∠ 270° 0.5∠ −270° 0.35∠ 0° 0.35∠ 0° 0.5∠ 135° 0.5∠ −135° 0.5∠ 270° 0.5∠ −270° 0.5∠ 45° 0.5∠ −45° 0.35∠ 180° 0.35∠ 0° 0.5∠ 0.5∠ 0.5∠ 0° 0.5∠ 0° 0.5∠ 0.5∠ 0.35∠ 0°
180° −180° 180° −180° 0.35∠ 0° 0.5∠ 225° 0.5∠ −225° 0.5∠ 90° 0.5∠ −90° 0.5∠ 315° 0.5∠ −315° 0.35∠ 180° 0.35∠ 0° 0.5∠ 270° 0.5∠ −270° 0.5∠ 180° 0.5∠ −180° 0.5∠ 90° 0.5∠ −90° 0.35∠ 0° 0.35∠ 0° 0.5∠ 315° 0.5∠ −315° 0.5∠ 270° 0.5∠ −270° 0.5∠ 225° 0.5∠ −225° 0.35∠ 180° 0.8 2.2192 2.2192 0.7 0.7 0.38076 0.38076 0.6
If the sample resistance of the load is symmetrically altered by adjusting either the saline
concentration or the diameter of the phantom, it is intuitive that the normalized resistive coupling coefficients will also be scaled but the symmetry of the coupling will be preserved. If the values of the resistance matrix are altered, for instance, R12 is change from +0.35 to +0.25, it turns out that the eigenvectors remain unchanged; only the eigenvalues change. What this means is that the design of such an eigenvector transformation combiner is relatively invariant to such loading changes. Although a detailed treatment of how asymmetric changes in loading such as the human head affect the eigenmodes is beyond the scope of this paper, degradation in performance would not be expected to be any worse than that of a quadrature birdcage or transverse electromagnetic (TEM) coil with the same asymmetric load. In fact, shimming of the amplitude of the RF field through birdcage/TEM leg/rung tuning is typically performed with a symmetric load and not adjusted for the asymmetric human head.
The full advantages of this quad/antiquad transformation will become obvious later, but clearly each of the eigenvectors requires equal amplitude combination from each of the original signals, placing less demand on the complexity of the signal combiner.
MATERIALS AND METHODS
An eight-channel head array (22) was constructed, with each loop element made from 0.25-inch-wide 2-oz. copper strip on a flexible printed circuit board, placed on a 24-cm-diameter inner head former, slightly domed at the superior end (Fig. 1). Each element was tuned to 63.6 MHz with distributed capacitors and decoupled from the transmit body coil with passive and active diode resonant traps. To minimize crosstalk due to mutual inductance coupling, neighboring loops were overlapped and next nearest neighboring loops were isolated using shared inductors. A shared leg was used between elements 1 and 8, isolated with a shared capacitance. It was prudent to connect the coaxial cables for these two elements such that both grounds were connected to the shared leg. Therefore, the coaxial cables for elements 5-8 were connected with opposite polarity to elements 1-4. To further reduce crosstalk, ultra-low-input impedance preamplifiers (23) (0.8 Ω input impedance, noise figure = 0.3 dB, gain 28dB) were placed directly at the 50-ohm input to the coil element matched to a load made from a 20-cm-diameter, 25-cm-long cylindrical phantom with 3 g/L NaCL and 2 g/L CuSO4. Preamplifier noise figure
was measured using an HP8970A Noise Figure Meter (Hewlett-Packard, Palo Alto, CA). The array element unloaded and loaded Q values were 245 and 55, respectively.
Figure 1. The eight-element volume phased array, with integrated ultra-low-input impedance preamplifiers.
The construction of the eigenmode signal combiner can be done in several different ways.
Recently, a similar method was demonstrated for transmit array applications that utilized a Butler matrix signal splitter method connected to a degenerate birdcage coil (24). Having designed and constructed our hardware network prior to this, we aimed at first generating the linear birdcage modes and then combining together with a final quadrature hybrid to form the quad/antiquad modes. Although our hardware network constructed here is not identical to the Butler matrix method (24), the output signals are the same, the eigenmode outputs of the array. Even though the signal combiner is placed after preamplification, one would still want to minimize losses from the signal combiner circuit by avoiding resistive components and also minimize the number of reactive components used. The naturally isolated inputs and outputs of a quadrature hybrid were chosen as the basis for all phase shifting so that cross talk within the signal combiner could be minimized. The constructed RF combiner is shown in Fig. 2, with a schematic representation shown in Fig. 3. The combiner was constructed using two double-sided printed circuit boards, placed back to back using a common ground plane. This included 25-quadrature hybrid
combiners and 23–90° phase shifters. Unused outputs were terminated with 50-Ω chip resistors. The polarity of the RF connection to the signal combiner was adjusted to account for different polarity connections at the coil interface chosen in the original construction. Each array element output was first split two ways using a simple ±45° phase shift using a 50-Ω capacitor (51 pF) and inductor (120 nH) respectively. The rest of the network consisted of 90° phase shifters (Fig. 4a) and quadrature hybrids (Fig. 4b), which are labeled Q in Fig. 3. In all cases where a 90° phase shifter was used, it preceded a quadrature hybrid, so they were combined as shown in Fig. 4c. The magnitude and phase performance of the RF eigenmode combiner network were
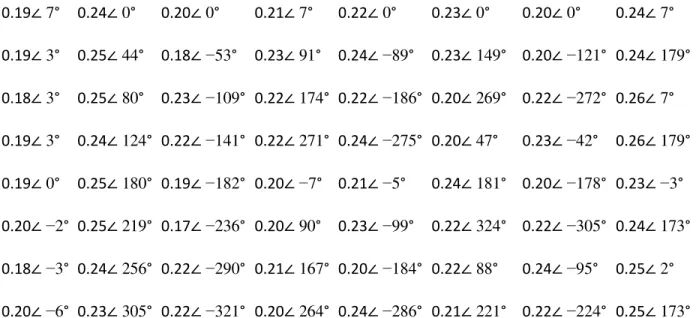
measured on the bench by driving with an HP8752A network analyzer (Hewlett Packard) into one of the eigenmode output channels, with all other ports terminated into 50-Ω resistors and measuring the voltage across each 50-Ω resistor of the eight input terminals (standard basis end of network), using an Agilent 85024A high-impedance probe (Agilent Technologies, Santa Clara, CA). The experimental eigenmode outputs of this network are shown in Table 3, reasonably uniform in magnitude and with phases in good agreement with what is required theoretically (Table 2).
Figure 2. RF signal combiner equivalent to the operation of the K′-matrix of Eq. 2. On the left are the eight inputs from the eight elements of the array coil and on the right are the eight
Eigencoil outputs. [Color figure can be viewed in the online issue, which is available at www.interscience.wiley.com.]
Figure 3. Schematic representation of the RF signal combiner for producing the eigenmodes (m = 0, ±1, ±2, ±3, 4). On the top is the schematic for one side of the constructed board and the bottom schematic is for the bottom half of the board. On the left are the eight inputs from the eight elements of the array coil and on the right are the eight Eigencoil outputs.
Figure 4. Design and components used for the (a) 90° phase shifter, (b) quadrature hybrid, and (c) combined 90° phase shifter and hybrid.
Table 3. Measured Magnitude (V) and Phases (°) of the Constructed Quad/Antiquad RF Signal Combiner 0.19∠ 7° 0.24∠ 0° 0.20∠ 0° 0.21∠ 7° 0.22∠ 0° 0.23∠ 0° 0.20∠ 0° 0.24∠ 7° 0.19∠ 3° 0.25∠ 44° 0.18∠ −53° 0.23∠ 91° 0.24∠ −89° 0.23∠ 149° 0.20∠ −121° 0.24∠ 179° 0.18∠ 3° 0.25∠ 80° 0.23∠ −109° 0.22∠ 174° 0.22∠ −186° 0.20∠ 269° 0.22∠ −272° 0.26∠ 7° 0.19∠ 3° 0.24∠ 124° 0.22∠ −141° 0.22∠ 271° 0.24∠ −275° 0.20∠ 47° 0.23∠ −42° 0.26∠ 179° 0.19∠ 0° 0.25∠ 180° 0.19∠ −182° 0.20∠ −7° 0.21∠ −5° 0.24∠ 181° 0.20∠ −178° 0.23∠ −3° 0.20∠ −2° 0.25∠ 219° 0.17∠ −236° 0.20∠ 90° 0.23∠ −99° 0.22∠ 324° 0.22∠ −305° 0.24∠ 173° 0.18∠ −3° 0.24∠ 256° 0.22∠ −290° 0.21∠ 167° 0.20∠ −184° 0.22∠ 88° 0.24∠ −95° 0.25∠ 2° 0.20∠ −6° 0.23∠ 305° 0.22∠ −321° 0.20∠ 264° 0.24∠ −286° 0.21∠ 221° 0.22∠ −224° 0.25∠ 173°
0° mode +45° mode −45° mode +90° mode −90° mode +135° mode −135° mode 180° mode
The Eigencoil array is formed by inserting this eigenmode signal combiner hardware inline between the output of the array and the system interface. The eight array-element output signals coming from the eight preamplifiers represent the original signal basis, s. This eight-to-eight port signal mixer (K′) converts the original eight signals into a new set of eight signals represented by
. These eight signals are then passed into the eight receivers of the eight-channel MRI system. MRI experiments were carried out on a Siemens Symphony 1.5-T eight-channel MRI scanner (Siemens Medical Solutions, Germany). Experimental SNR was found from eight channel images, using a standard spin echo imaging sequence (slice orientation = axial, pulse repetition time = 300 ms, echo time = 16 ms, 5 mm thickness, 32-cm field of view). A large field of view was used to ensure a signal-free noise background from which the noise and noise correlation matrix were determined from the eight-channel individual uncombined output images. Each channel's noise was calculated as the standard deviation of pixel values in a signal-free noise region-of-interest (ROI). The noise correlation matrix was found from the covariance of noise ROI pixel values between respective channels. SNR was then calculated using Eq. 4.
RESULTS AND DISCUSSION
The eight-channel volume array shown in Fig. 1 produced eight individual channel axial images shown in Fig. 5. The SNR distribution exhibits the typical surface coil inhomogeneous fall-off with distance from the array element, with the highest SNR near each element. The noise
correlations between nearest neighbors (N12) ranged from 0.3 to 0.45, and next nearest neighbors (N13) less than 0.1, and furthest neighbors (N14 and N15) approximately 0.35. In the Eigencoil data acquisition, the eigenmode signal combiner (Fig. 2) was placed inline after preamplification, and eight eigenmode images were then collected. The eight-channel axial images obtained with the Eigencoil are shown in Fig. 6. These experimental results are similar to the simulated eigenmodes of King et al. (14), except in this case, quadrature combinations of the linear eigenmodes have been formed as given in Table 3. Eigenmode (a) is equivalent to the end-ring mode (m = 0) of a typical quadrature birdcage coil where array element signals are added together with equal magnitude and phase weighting (0° phase mode). Modes (b) and (f) are degenerate quad/antiquad pairs (the same eigenvalue), formed from equal-magnitude weighting and a successive +45° phase shift for the quadrature mode (b) or successive −45° phase shift for the antiquadrature mode (f). These modes form the uniform modes normally associated with the quadrature birdcage coil (m = ±1). Similarly, modes m = ±2 (c) and (g), as well as modes m = ±3 (d) and (h), are degenerate quad/antiquad pairs. These are formed from successive ±90° (c and g) and ± 135° (d and h) phase shifts, but with equal-magnitude weighting. Finally, eigenmode m = 4 (e) represents combining signals equally in magnitude, but with a successive 180° phase shifts to each array element, which is equivalent to an array driven in counterrotating-current mode. These experimental eigenmode images closely resemble the theoretically predicted eigenmodes of King et al. (14), and also, the antiquad modes indeed produce very little signal.
Figure 5. Axial image SNR distribution of each of the eight elements from a slice in the z-center of the array.
Figure 6. Axial image SNR distribution of each of the eight channels of the Eigencoil array. Modes: (a) is the end-ring mode, (b,f) are the degenerate quadrature/anti-quadrature uniform modes, (c,g) are the degenerate quadrature/antiquadrature first-order (linear) modes, (d,h) are the degenerate quadrature/antiquadrature second-order (quadratic) modes, and (e) is the third-order counterrotating-current mode.
From the eight individual images in the Eigencoil basis, a noise covariance analysis was
performed from a signal-free noise background region of each of the individual channel images. In the new eigenmode basis, the output images are noise correlation matrix eigenmodes of the initial basis images, and hence all noise correlations in this basis should be zero. We found the noise correlation coefficient was Nbc = 0.13, Nbd = 0.13, and Nbe = 0.07 between the uniform quadrature m = +1 eigenmode (b, +45° mode) and the other main eigenmodes m = +2, +3, 4 (c, d, and e, respectively). Among the main higher-order modes, the resultant noise correlations were, Ncd = 0.08, Nce = 0.08, and Nde = 0.17. Correlations less than 0.17 can be considered low. Other noise correlations were low, except Nba = 0.38, Nbh = 0.22, Naf = 0.38, Nad = 0.27, Ndh = 0.24, which involve at least one antiquadrature or end-ring eigenmode and therefore are not important as these modes contribute very little to the overall SNR.
It is from this noise correlation matrix that proper combination of the individual images can be made that allows maximum SNR to be achieved for all pixels in the composite image. A composite axial image using the optimal reconstruction method of Eq. 3 is shown in Fig. 7 for the standard eight-channel array (Fig. 7a) and for the Eigencoil array (Fig. 7b). Theoretically, the optimal SNR in both these cases should be identical, but there are differences at isocenter and in the periphery averaging 5%, ranging from 0% to 10%. This is likely due to nonideal performance of the eigenmode combiner hardware, causing SNR loss and asymmetry in the SNR distribution. Figure 7. Optimal reconstructed composite image SNR for (a) the standard eight-channel array, and (b) the eight-channel Eigencoil array.
A sum-of-squares reconstruction of the images from the standard eight-channel array is shown in Fig. 8a. Notice that there is approximately 30% (ranging from 23-35%) reduced SNR in the periphery relative to the optimal reconstruction (Fig. 7a). This is in contrast to the factor 0.91 predicted by Roemer et al. (1) that applied to a two-element linear array and not volume arrays of
many elements such as the one used here. This higher optimal SNR gain behavior is predicted from eigenmode analysis of volume arrays (14), where it can be seen that as the number of channels increases (and therefore the number of higher-order eigenmodes increases), the peripheral gain in SNR can be increased for optimal reconstruction relative to sum of squares. This SNR difference comes from high noise correlations among array elements with significant contributions to SNR for peripheral pixels, and in cases of volume arrays of many elements, there are more contributors. In this eight-channel case, three nearest neighbors contribute most to a peripheral pixel SNR and have a correspondingly high noise correlation among them (ranging from 0.3 to 0.45).
Figure 8. Sum-of-squares reconstructed composite image SNR for (a) the standard eight-channel array, (b) the eight-channel Eigencoil array, (c) the best four channels of the Eigencoil array, (d) the best three-channel Eigencoil array.
A simple sum-of-squares reconstruction in a basis set of signals with low noise correlations (<0.15) will result in near-optimal SNR. In our Eigencoil array, the main contributors to the composite image SNR for any pixel are modes m = +1, +2, +3, and 4 (b, c, d, e, respectively). The main noise correlations among these modes is indeed low (<0.17), and therefore a simple sum-of-squares reconstruction on this new basis set of images results in near-optimal SNR for all pixels in the composite image, shown in Fig. 8b, within approximately 6% (ranging from 3 to 12%) of the true optimal reconstruction of the eigenmode images in Fig. 7b. This 6% SNR loss would be attributed to the relatively high noise correlation still existing from the other antiquad and end-ring modes. Compared to a sum-of-squares reconstruction of images collected using the standard eight-channel array in the normal phased-array basis (Fig. 8a), the gain in SNR in the periphery of the sample using the Eigencoil was approximately 22% (ranging from 15 to 32%), which is what you would expect from an optimal reconstruction using such a volume array when the nearest neighbor coupling is on the order of 40%.
Looking again at Fig. 6, one can see that most of the SNR is contained in the quadrature eigenmodes (b,c,d) and the counterrotating-current eigenmode (e). By limiting the composite image reconstruction to only those channels with significant SNR, a final composite image may be formed from fewer channels. Similarly, in the context of parallel transmission, Alagappan et al. (24) have recently used the same eigenmode concept to obtain transmit sensitivity encoding (Transmit-SENSE) acceleration with fewer transmit channels. The sum-of-squares composite SNR of the best four channels of the Eigencoil array basis set, that is, the three-quadrature eigenmodes (b,c,d) and the counterrotating-current eigenmode (e), is shown in Fig. 8c, and the best three-channel Eigencoil array basis set using just the three-quadrature eigenmodes (b,c,d) is shown in Fig. 8d. As seen, the best four channels of the Eigencoil array actually have slightly higher sum-of-squares SNR than using all eight eigenmode channels. This is expected because
there were relatively high noise correlations when including antiquad and end-ring eigenmodes that would result in more SNR harm than good when included into a sum-of-squares
reconstruction. Even using only the best three channels (Fig. 8d) results in better SNR than a sum-of-squares reconstruction using the standard eight-channel phased array (Fig. 8a).
Although it may be perceived as a complicated endeavor, because this is done after preamplifier decoupling, the construction of such an Eigencoil array was extremely robust to load variations, requiring little to no fine tuning of the RF signal combiner from its theoretical determined design parameters. In fact, the utility of this method is apparent as an equivalent eigenmode signal combiner has been implemented in an industry eight-channel neurovascular phased array (Invivo Corporation, Gainesville, FL). In this case, the array can be operated in head-only mode, using all eight receiver channels for the eight loop elements of the head portion of the coil, or in neurovascular mode; only three receivers are utilized for the head portion using this eigenmode signal combiner, leaving five receive channels for array elements of the neck portion of the coil. In vivo images collected using the three-channel Eigencoil mode of the neurovascular array are compared to an image collected with only the uniform quadrature mode (Fig. 9). Notice that the same factor-of-2 improvement in peripheral SNR relative to the isocenter SNR is seen in vivo from this three-channel Eigencoil (Fig. 9a) relative to the single uniform mode (Fig. 9b), as is seen in the phantom results of Fig. 8d and Fig. 6b, respectively. This suggests that the eigenmode hardware combiner works well even in this case of asymmetric loading by a human head.
Figure 9. In vivo SNR image from (a) the three-channel Eigencoil portion of a product neurovascular array (Invivo Corp. Gainesville, FL) showing the expected 2× SNR gain in the periphery relative to (b) the single-channel uniform mode.
In our eight-channel Eigencoil example, there are three pairs of degenerate eigenmodes, so as described in the Theory section, this eight-element array structure has degree m = 5. In general, this means that if the antiquadrature modes are perfect and produced zero SNR, then all the SNR is available in m channels. This, of course, is the principle of quad/antiquad pairs now extended to higher degrees. Finally, the end-ring eigenmode (a), which is equivalent to the end-ring mode of a similarly dimensioned birdcage coil, has relatively low SNR. It is worth noting that in the extreme condition that the end-rings were very far apart, the SNR of this mode at the center of the coil would be zero. In fact, if there were little loading associated with such far-apart end-rings, one would expect the resistance of this mode to be zero. As described in King et al. (14), the eigenvalue is equal to the resistance of the eigenmode, so of course the closer an eigenvalue gets to zero, the less SNR it will produce. Therefore, in an ideal case of perfect quad/antiquad fields and far-apart end-rings, we could simply eliminate channels that do not produce significant SNR and be left with all the optimal SNR of the eight-channel array, in only four channels! This means that by forming eigenmodes of symmetric array structures, the number of channels required for full SNR data collection may be reduced. Done in hardware, SNR's equivalent to an
N-channel array can be achieved using, for instance, N/2 channels, dependent on the degree m of
symmetry is equivalent to the resistive symmetry, and therefore signal modes produced from the noise eigenmode combiner are also signal eigenmodes. This inherent orthogonality of the signal modes of the Eigencoil array may also provide a means for reducing the number of receivers required in parallel MRI data acquisitions. Figure 10 demonstrates the use of the three-channel Eigencoil for SENSE parallel MRI, for R = 2 where g-factors are below 1.2, and for R = 3. For R = 3 acceleration, the three-channel Eigencoil is able to SENSE reconstruct without the very large noise amplification one would expect from R = 3 using three channels. Although optimum data compression for parallel MRI reconstruction (16) is in general not achieved using such hardware eigenmodes, the orthogonality may be useful for parallel MRI data acquisitions, even if only considering that image unwrapping computation time may be reduced because in the eigenmode basis N−1 = I. The main advantage of channel reduction is that not only is optimal SNR achieved but also additional receivers are available, and hence more array elements may be used either for further SNR improvement or extended field-of-view coverage. Future work will extend this two-dimensional eigenmode array distribution to a three-two-dimensional array distribution, such as with array elements additionally placed along the z-axis. This may allow one to achieve truly
optimum SNR for all spatial positions while using the fewest number of receive channels possible.
Figure 10. In vivo parallel MRI results obtained from the three-channel Eigencoil portion of a product neurovascular array (Invivo Corp. Gainesville, FL). a: R = 1 image, (b) R = 2 wrapped image, (c) R = 2 SENSE unwrapped image, (d) R = 2 g-factor map, (e) R = 3 wrapped image, (f)
R = 3 SENSE unwrapped image, (g) R = 3 g-factor map.
CONCLUSIONS
An eight-channel Eigencoil array has been constructed by placing a hardware RF signal combiner inline after preamplification, before the receiver system. This Eigencoil array
generated eight predominantly orthogonal eigenmode outputs, such that when received signals were combined using a standard sum-of-squares algorithm, the SNR gain typical of an optimal reconstruction was produced with peripheral SNR gains averaging 22% and as high as 30% over the standard sum-of-squares reconstruction using the standard array. The concept of “receiver channel reduction” or MRI data compression was demonstrated, where N-channel optimal SNR was achieved using only N/2 receivers, demonstrated here using only four channels of the Eigencoil array, producing the same SNR as an optimal reconstruction of all eight channels of the standard array. In fact, using only three channels of the Eigencoil array provided superior SNR over the standard eight-channel array, using a sum-of-squares reconstruction. This hardware-based data compression method provides a means of achieving absolute maximum SNR from an array while minimizing the number of receivers required, allowing remaining receivers for even more array elements, leading to increased SNR or extended field-of-view coverage, and may also be useful for parallel MRI applications in which a reduced number of receivers are required.
Acknowledgements
The authors thank Dr. David Molyneaux, Uli Gotshal, Dr. Feng Huang, and Dr. Charles Saylor for numerous helpful discussions. This paper is dedicated to the memory of a great friend and colleague, coauthor Steve Varosi.
REFERENCES
1.Roemer PB, Edelstein WA, Hayes CE, Souza SP, Mueller OM. The NMR phased array.
Magn Reson Med 1990; 16: 192–225.
2.Hayes CE, Roemer PB. Noise correlations in data simultaneously acquired from multiple
surface coil arrays. Magn Reson Med 1990; 16: 181–191.
3.Wang J, Reykowski A, Dickas J. Calculation of the signal-to-noise ratio for simple surface
coils and arrays of coils. IEEE Trans Biomed Eng 1995; 42: 908–917.
4.Walsh DO, Gmitro AF, Marcellin MW. Adaptive reconstruction of phased array MR
imagery. Magn Reson Med 2000; 43: 682–690.
5.Hayes CE, Hattes N, Roemer PB. Volume imaging with MR phased arrays. Magn Reson
Med 1991; 18: 309–319.
6.King SB, Duensing GR. Zero shared resistance between coil elements of a phased array?
In: Proceedings of the 8th Annual Meeting of ISMRM, Denver, CO, 2000. p 1406.
7.King SB, Varosi SM, Huang F, Duensing GR. The MRI Eigencoil: 2channel SNR with
N-receivers. In: Proceedings of the 11th Annual Meeting of ISMRM, Toronto, Ontario, Canada, 2003. p 712.
8.Zhu Y, Hardy CJ, Sodickson DK, Giaquinto RA, Dumoulin CL, Kenwood G, Niendorf T,
LeJay H, McKenzie CA, Ohliger MA, Rofsky NM. Highly parallel volumetric imaging with a 32-element RF coil array. Magn Reson Med 2004; 52: 869–877.
9.Hardy CJ, Cline HE, Giaquinto RO, Niendorf T, Grant AK, Sodickson DK. 32-Element
receiver-coil array for cardiac imaging. Magn Reson Med 2006; 55: 1142–1149.
10.Wiggins GC, Triantafyllou C, Potthast A, Reykowski A, Nittka M, Wald LL. 32-Channel 3
tesla receive-only phased-array head coil with soccer-ball element geometry. Magn Reson Med 2006; 56: 216–223.
11.Schmitt M, Potthast A, Sosnovik DE, Polimeni JR, Wiggins GC, Triantafyllou C, Wald LL.
A 128-channel receive-only cardiac coil for highly accelerated cardiac MRI at 3 tesla. Magn Reson Med 2008; 59: 1431–1439.
12.Hardy CJ, Giaquinto RO, Piel JE, Rohling KW, Marinelli L, Fiveland EW, Rossi CJ, Park
KJ, Darrow RD, Foo TK. 128-Channel body MRI with a flexible high density receiver-coil array. In: Proceedings of the 15th Annual Meeting of ISMRM, Berlin, Germany, 2007. p 244.
13.King SB, Duensing GR. Eigenmode analysis for understanding phased array coils and
their limits. In: Proceedings of the 11th Annual Meeting of ISMRM, Toronto, Ontario, Canada, 2003. p 427.
14.King SB, Varosi SM, Duensing GR. Eigenmode analysis for understanding phased array
coils and their limits. Concepts Magn Reson B 2006; 29B: 42–49.
15.Reykowski A, Blasche M. Mode matrix: a generalized signal combiner for parallel
imaging arrays. In: Proceedings of the 12th Annual Meeting of ISMRM, Kyoto, Japan, 2004. p 1587.
16.Buehrer M, Pruessmann KP, Boesiger P, Kozerke S. Array compression for MRI with
large coil arrays. Magn Reson Med 2007; 57: 1131–1139.
17.Huang F, Vijayakumar S, Akao J. Software compression for partially parallel imaging
with multi-channels. In: Proceedings of the 27th Annual International Conference of the Engineering in Medicine and Biology Society. IEEE, Shanghai, China, 2005. p 1348–1351.
18.Doneva M, Börnert P. Automatic coil selection for channel reduction in SENSE-based
parallel imaging. Magn Reson Mater Phys 2008; 21: 187–196.
19.Duensing GR, Gotshal U, Huang F, King SB. N-dimensional orthogonality of volume
coils. In: Proceedings of the 10th Annual Meeting of ISMRM, Honolulu, Hawaii, 2002. p 771.
20.Lin F-H, Kwong KK, Huang I-J, Belliveau JW, Wald LL. Degenerate mode birdcage
volume coil for sensitivity-encoded imaging. Magn Reson Med 2003; 50: 1107–1111.
21.Jin J. Electromagnetic analysis and design in magnetic resonance imaging (Ch.4). Boca
Raton, FL: CRC Press; 1999.
22.King SB, Duensing GR, Varosi SM, Peterson DM, Molyneaux DA. A comparison of 1, 4
and 8 channel phased array head coils at 1.5T. In: Proceedings of the 9th Annual Meeting of ISMRM, Glasgow, Scotland, UK, 2001. p 1090.
23.King SB, Varosi SM, Molyneaux DA, Duensing GR. The effects of ultra low input
impedance preamplifiers on phased array coil design. In: Proceedings of the 10th Annual Meeting of ISMRM, Honolulu, Hawaii, 2002. p 330.
24.Alagappan V, Nistler J, Adalsteinsson E, Setsompop K, Fontius U, Zelinski A, Vester M,
Wiggins GC, Hebrank F, Renz W, Schmitt F, Wald LL. Degenerate mode band-pass birdcage coil for accelerated parallel excitation. Magn Reson Med 2007; 57: 1148–1158.