Publisher’s version / Version de l'éditeur:
Vous avez des questions? Nous pouvons vous aider. Pour communiquer directement avec un auteur, consultez
la première page de la revue dans laquelle son article a été publié afin de trouver ses coordonnées. Si vous n’arrivez pas à les repérer, communiquez avec nous à PublicationsArchive-ArchivesPublications@nrc-cnrc.gc.ca.
Questions? Contact the NRC Publications Archive team at
PublicationsArchive-ArchivesPublications@nrc-cnrc.gc.ca. If you wish to email the authors directly, please see the first page of the publication for their contact information.
https://publications-cnrc.canada.ca/fra/droits
L’accès à ce site Web et l’utilisation de son contenu sont assujettis aux conditions présentées dans le site LISEZ CES CONDITIONS ATTENTIVEMENT AVANT D’UTILISER CE SITE WEB.
9th International Conference on Stability of Ships and Ocean Vehicles [Proceedings], 2006
READ THESE TERMS AND CONDITIONS CAREFULLY BEFORE USING THIS WEBSITE. https://nrc-publications.canada.ca/eng/copyright
NRC Publications Archive Record / Notice des Archives des publications du CNRC : https://nrc-publications.canada.ca/eng/view/object/?id=861e52c8-3d73-44bf-bc7c-6e18437bc4e4 https://publications-cnrc.canada.ca/fra/voir/objet/?id=861e52c8-3d73-44bf-bc7c-6e18437bc4e4
NRC Publications Archive
Archives des publications du CNRC
This publication could be one of several versions: author’s original, accepted manuscript or the publisher’s version. / La version de cette publication peut être l’une des suivantes : la version prépublication de l’auteur, la version acceptée du manuscrit ou la version de l’éditeur.
Access and use of this website and the material on it are subject to the Terms and Conditions set forth at
A computational investigation of the three dimensional geometric parameters' effect on the discharge rate of a ship opening
A Computational Investigation of the Three
Dimensional Geometric Parameters’ Effects on the
Discharge Rate of a Ship Opening
Yasser Nabavi, University of British Columbia Sander M. Calisal, University of British Columbia
Ayhan Akinturk, NRC-IMD
Voytek Klaptocz, University of British Columbia
ABSTRACT
The current research is an extension of a previous study conducted at the University of British Columbia on the effect that specific geometric parameters have on the water discharge rate of a ship opening. This research focuses on open deck ferries and fishing vessels where the collection of water on deck may affect the stability and manoeuvring of the vessel. The geometric parameters affecting the discharge rate, namely the vessel beam, the depth of the water collected on deck, and the width of the opening were studied using CFD methods. The effect of each parameter was analyzed by varying the parameter of interest while the other parameters were kept constant. Froude number and non-dimensional discharge time were calculated using the instantaneous water depth, the water discharge rate, and the opening area as a part of the non-dimensional simulation. The results were compared to the experimental results that were obtained previously at UBC.
Keywords: Discharge Rate, Ship Opening, Free-Surface Simulation
1. INTRODUCTION
The interaction between vessel motion and ocean waves, especially at higher speeds, may result in a collection of water on deck. This water collection may cause the loss of vessel stability that can affect the manoeuvring of the vessel, damage the equipment and cargo on deck, and endanger the safety of the vessel and its passengers and crew. Significant research was done in the past to study different methods and requirements that can eliminate or decrease the amount of accumulated water on deck (Calisal, 1997) (Molyneux, 1997) (Molyneux, 1998). In addition, a number of researchers
have investigated the relationship between water collection on deck and ship manoeuvring (Belenky, 2002). Earlier researches at the University of British Columbia (UBC) have focused on establishing the relationship between the geometric parameters and the water discharge rate (Nabavi, 2006) (Akinturk, 2003). The aim of the experimental (Akinturk, 2003) and computational (Nabavi, 2006) these researches was to find the significance of each parameter on the discharge rate for design and optimization purposes. These researches, however, did not take the effect of the opening width into account. The current work is an extension of the computational research by focusing on the three-dimensional effects of the geometric parameters on the discharge process. Two values for both the beam and the initial
water depth were selected in conjunction with five different values for the opening width. The opening height was kept constant at four inches. Twenty models were identified and analyzed numerically in order to understand the significance of each geometric parameter. A summary of all model configurations is presented in Table 1.
Table 1. Models configurations
Parameter Values
Tank Length [ft] 2 and 4 Water Depth [in] 10 and 14 Opening width ratio 0.2,0.4,0.6,0.8,1
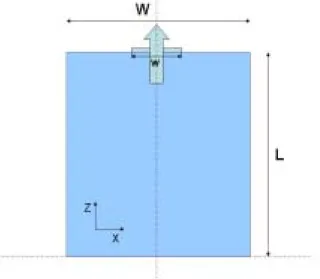
The non-dimensional opening width ratio was defined as the ratio of the opening width to the vessel section width
( )
W
w . The vessel
section width is the width of the tank as shown in Figures 1 and 2.
Figure 1: Simulated sections of the vessel
Figure 2: Top view of the simulated section and its dimensions
Figure 3: Side view of the simulated section and its dimensions
As shown in Figures 1 through 3, the problem can be simplified to a cubic container (tank) from which water is drained through an outlet area. This is the basis of the computational fluid dynamics (CFD) simulations done for water discharge from an opening on deck.
2. CFD MODEL
The commercial CFD code, FLUENT, was used as the solver while GAMBIT was used as the modelling and mesh generation software. Because three-dimensional simulations usually require a very large number of cells, and based on the fact that the time and cost of computations are important restrictions, three simplifying assumption were made to reduce the number of cells and consequently, decrease the solution time and number of computations. The first step in minimizing the number of cells was a grid refinement study. Three models with different mesh densities were used, and the results were compared with extrapolated results obtained from the Richardson Extrapolation method as shown in Table 2 and Figure 4.
Table 2. Grid refinement study results Grid Density Number of Cells Average Error % Coarse 163,800 1.8378 Medium 331,200 1.0408 Fine 604,800 0.1235
0 5 10 15 20 25 30 35 0 5 10 15 Time (Sec) Di schar ge R a te ( K g/ Se c) 163,800 331,200 604,800
Figure 4: The comparison of the results using different mesh densities
To further reduce the computational cost, the flow was assumed to be symmetric about the longitudinal plane crossing the vessel and parallel to the x-axis. In other words, the flow was simulated for only half the beam of the vessel. The results of this study, presented in Figure 5, show that this assumption is acceptable and indicate that the error imposed by a symmetry assumption is negligible (approximately 0.02%). 0 20 40 60 80 100 120 140 160 0 0.5 1 1.5 2 2.5 3 3.5 Time (Sec) D isc ha rg e R a te ( K g/ S e c )
Half Beam Full Beam
Figure 5: The comparison of the results of the simulations for half beam and full beam to check the validity of symmetry assumption used for the simulations
The flow was also assumed to be symmetric about the mid-plane of the tank parallel to the y-z plane.The results of the study for a full tank simulation and a half tank simulation show that this assumption is acceptable and does not lower the accuracy of the solution significantly
(0.0003% error). These results are illustrated in Figure 6. 0 2 4 6 8 10 12 14 16 18 20 0 1 2 3 4 5 6 Time (Sec) D isch ar g e R at e ( K g/ S ec)
Full Scale Half Scale
Figure 6: The comparison of the results obtained for a full geometry of the tank and a half geometry of the tank
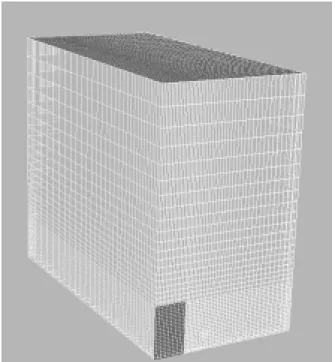
For all models, a hexahedral structured grid was used to maximize the accuracy and convergence speed (Figure 7). A finer grid was also used close to the outlet because of the existence of strong velocity gradients and complicated flow field in that region. In order to generate a hexahedral mesh for the models, the domain was divided into a number of cubic blocks (Figure 8).
Figure 7: Hexahedral structured grid used for the simulations
Figure 8: The blocks used to generate the structured hexahedral high quality grid
A three-dimensional, unsteady, first-order solver was used for the simulations. The Volume of Fluid (VOF) method was used to simulate the two-phase flow. In addition, the Geometric Reconstruction Scheme was used to simulate the free surface. This scheme represents the interface between two fluids using a piece-wise linear approximation (Fluent, 2005). Also the implicit body force formulation was used in conjunction with the VOF method to improve the convergence of the solution by accounting for the partial equilibrium of the pressure gradient and body forces in the momentum equations. Air, at standard atmospheric condition, was used as the primary phase while fresh water at 20 degrees Celsius was used as the secondary phase. In addition, the PISO scheme was used for the pressure-velocity coupling while a second-order discretization scheme was applied for the momentum equations. During the solution process, the instantaneous water depth at the rear of the tank was recorded at the end of each time step.
The boundary conditions used for the simulations are symmetry boundary conditions
at the rear wall and the two side walls. Also, the no-slip wall boundary condition was applied to the bottom and front walls. The inlet and outlet were defined as inlet vent and outlet vent respectively.
3. DISCHARGE RATE AND TIME
After obtaining the discharge rate as a function of time from the CFD solutions, the discharge rate and simulation time were non-dimensionalised using equations 1 and 2.
r n H g t t = (1) r n gH A Q F = (2)
To find a practical criterion for the time required for the water to be discharged, the discharge time was defined as the time required for the water level to reduce to half of the initial level. Using the continuity equation, equation 1 and Figure 9:
r r r n H dH A LW H g A F t Q( )= . . . =− (3)
Figure 9: Discharge time calculation
Equation 4 is derived from equation 3 by a number of simple algebraic manipulations.
n n r r
t
F
H
dH
A
WL
=
−
(4)( )
[
ln
]
0ln
( )
2
0 0 0 * 5 . 0 5 . 0 0A
WL
H
A
WL
H
dH
A
WL
t
F
H H r H H r r t n n=
−
=
−
=
∫
∫
(5)Obtaining the values of tn and Fn from the
CFD results (Figures 11 through 14), the left hand side of equation 5 can be plotted vs. tn.
The intersection of this curve and right hand side of equation 5 which is constant for a specific geometry specifies the value of discharge time.
An application of the discharge time concept was shown for the first set of geometries (L=2ft, W=6 ft, and Hg=4 in and w=0.2W, 0.4W, 0.6W, 0.8W, W). The discharge time obtained for each case is presented in Table 3.
Table 3. Opening width effect on the water discharge time (L=2 ft, W=6 ft, and Hg=4 in) w/W Discharge Time (t*) 0.2 20.75 0.4 10.40 0.6 6.78 0.8 5.20 1 4.17 0 5 10 15 20 25 0 0.2 0.4 0.6 0.8 1 1.2 w/W N on-D imens ion a l D is c ha rg e Ti me
Figure 10: Opening width effect on the water discharge time (L=2 ft, W=6 ft, and Hg=4 in)
Table 3 indicates that the discharge time decreases more slowly as the opening width increases. In other words, the discharge time
does not vary linearly with change in the opening width
4. RESULTS AND DISCUSSION
The results of the simulations are presented in Figures 11 through 14 for different tank lengths and initial water heights. The non-dimensional time and Froude number were calculated using equations 1 and 2 respectively.
0 0.2 0.4 0.6 0.8 1 1.2 0 50 100 150 200 250 300 tn Fn 2 10 20 2 10 40 2 10 60 2 10 80 2 10 100
Figure 11: Opening width effect on the discharge rate for L=2 ft; H=10 in for a constant opening gap height of 4 in
0 0.2 0.4 0.6 0.8 1 1.2 0 50 100 150 200 250 300 350 tn Fn 2 14 20 2 14 40 2 14 60 2 14 80 214 100
Figure 12: Opening width effect on the discharge rate for L=2 ft; H=14 in for a constant opening gap height of 4 in
0 0.2 0.4 0.6 0.8 1 1.2 0 200 400 600 800 tn Fn 4 10 20 4 10 40 4 10 60 4 10 80 4 10 100
Figure 13: Opening width effect on the discharge rate for L=4 ft; H=10 in for a constant opening gfp height of 4 in
0 0.2 0.4 0.6 0.8 1 1.2 1.4 0 100 200 300 400 500 600 tn Fn 4 14 20 4 14 40 4 14 60 4 14 80 4 14 100
Figure 14: Opening width effect on the discharge rate for L=4 ft; H=14 in for a constant opening gap height of 4 in
Previous research on open channel flow showed that the Froude number associated with a steady waterfall does not exceed unity. However, the findings presented in this paper indicate that the Froude number may exceed unity in certain cases by up to 10%.
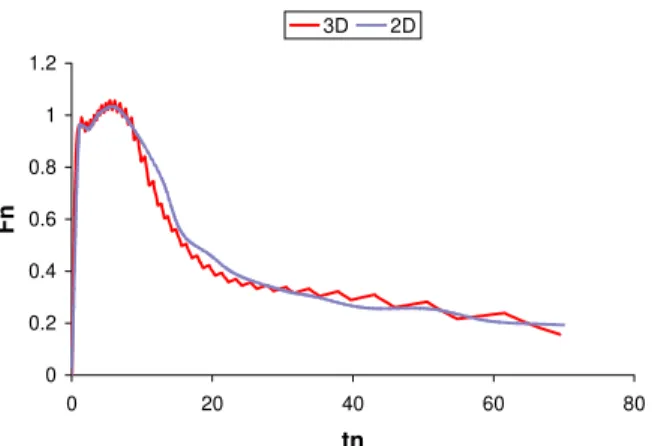
0 0.2 0.4 0.6 0.8 1 1.2 0 20 40 60 80 100 tn Fn 3D 2D
Figure 15: The comparison of 2D and 3D results for L=2 ft; H=10 in, Hg = 4 in and W = 6 ft 0 0.2 0.4 0.6 0.8 1 1.2 0 20 40 60 80 tn Fn 3D 2D
Figure 16: The comparison of 2D and 3D results for L=2 ft; H=14 in, Hg = 4 in and W =6 ft
The comparison between] the results of two-dimensional (Nabavi, 2006) and three- dimensional solutions is presented for two selected cases in Figures 15 and 16. As shown in these figures, the Froude number obtained from the three-dimensional solution begins to fluctuate about a mean value that can be approximated by Froude numbers obtained using a two-dimensional solution. These fluctuations seemed to be the effect of lateral waves which start to propagate in the x- direction. Moreover, it can be observed that the amplitude of these fluctuations increases with time (from larger Froude number values at the beginning to a point where the Froude number decreases gradually). Based on the results obtained from this comparison, it can be concluded that two-dimensional simulations give acceptable results for the discharge rate. The value of maximum Froude number and the trends are well predicted in the two-dimensional model. The only limitation associated with using a two-dimensional model instead of a three-dimensional one is the inability to simulate the small fluctuations shown in Figures 15 and 16 that occur in the three-dimensional model.
Figures 17 through 20 also serve to understand the relationship between the initial water height and the tank length. As illustrated in Figures 11 through 14 and 17 through 20, when the initial water height increases, the
shape of the Froude number vs. non-dimensional time curve tends to decrease in slope and approaches to a linear case. However, this effect is less pronounced when the opening width increases. It is also observed that the initial water height has a very small impact on the maximum Froude number. Furthermore, the increase in beam (tank length) results in an increase in the maximum Froude number (10% in this study) and the Froude number vs. time curve is no longer linear. This means that the water tends to be discharged more rapidly when the tank length increases.
0.8 0.85 0.9 0.95 1 1.05 0 10 20 30 40 tn Fn 2 10 20 2 10 40 2 10 60 2 10 80 2 10 100
Figure 17: Maximum Froude number for a tank with L=2 ft and H=10 in 0.8 0.85 0.9 0.95 1 1.05 1.1 0 10 20 30 40 50 60 70 tn Fn 2 14 20 2 14 40 2 14 60 2 14 80 214 100
Figure 18: Maximum Froude number for a tank with L=2 ft and H=14 in 0.8 0.85 0.9 0.95 1 1.05 1.1 1.15 0 20 40 60 80 100 tn Fn 4 10 20 4 10 40 4 10 60 4 10 80 4 10 100
Figure 19: Maximum Froude number for a tank with L=4 ft and H=10 in 0.8 0.85 0.9 0.95 1 1.05 1.1 1.15 1.2 0 10 20 30 40 tn Fn 4 14 20 4 14 40 4 14 60 4 14 80 4 14 100
Figure 20: Maximum Froude number for a tank with L=4 ft and H=14 in
As a validation of CFD simulations, the results obtained from the two-dimensional and three-dimensional simulations were compared to the experimental data obtained previously at UBC (Akinturk, 2003). The comparison shows that the CFD results are consistent with the experimental data as there are some fluctuations on the discharge rate in the three-dimensional simulation results (Figure 21).
0 0.2 0.4 0.6 0.8 1 1.2 0 5 10 15 tn Fn CFD 2D Experimental Results CFD 3D
Figure 21: The comparison of two-dimensional and three dimensional CFD solutions with the experimental results
However, the results show that the amplitude of these fluctuations is smaller in the CFD results in comparison with the experimental results. Possible sources of this discrepancy can be the uncertainty associated with the imaging system and the image analysis code used to measure the instantaneous free surface profiles along the discharge tank. One of the suspected largest sources of error may be the estimation of the instantaneous water height at the rear end of
the discharge tank for Fn computations.
5. CONCLUSIONS
This research was a continuation of the previously conducted computational and experimental work done at UBC on the water discharge rate from an opening on deck. The current research focused on using CFD simulations to study the three-dimensional characteristics affecting the discharge rates. In total, twenty models were built and simulated for varying water heights on deck, vessel beams, and opening widths. The results showed that the propagation of longitudinal waves causes the discharge rate to fluctuate. This fact was validated by the experimental results as well. It was also found that the two-dimensional results were in close agreement with the values and trends obtained from three-dimensional simulations. Therefore, two-dimensional models proved to be very useful in the design and optimization of the geometric parameters with the added benefit of significant savings in computational cost. In addition, it was shown that the effect of size of the opening width on lowering the rate of the discharge time decreases as the opening width increases.
6. NOMENCLATURE
A Opening cross sectional area B Beam of the vessel
L Flooded length of the tank
H Initial water height inside the tank Hg Height of the opening
Hr Instantaneous water height at the rear end of the tank
dHr Instantaneous water level differential W Width of the tank
w Opening width Fn Depth Froude Number tn Non-dimensional time Q Volumetric flow rate t Real time of simulation
t* Non-dimensional discharge time g Gravitational acceleration
7. REFERENCES
Akinturk, A., Calisal, S. M., Sireli E.M., 2003. “Water collection and discharge from an opening in ships”. OMAE2003, 22nd Conference on Offshore Mechanics and Arctic Engineering, Cancun, Mexico
Belenky, V., Liut, D., Weems, K., and Shin, Y. S., 2002, ‘‘Nonlinear Ship Roll Simulation With Water-On-Deck”, Proceedings of the 2002 Stability Workshop, Webb
Calisal, S. M., Akinturk, A., Roddan, G. and Stensgaard, G. N., 1997. “Occurrence of water-on-deck for large, open shelter-deck ferries”. STAB’97, Sixth International
Conference on Stability of Ships and Ocean Vehicles, Varna, Bulgaria.
Fluent Inc., “Fluent 6.2 User’s Guide”. 2005 Molyneux, D. W., Cumming, D., and Rousseau, J., 1997, “The use of freeing ports to prevent the capsize of damaged RO-RO ferries”, 4th Canadian Hydrodynamics and Structures Conference, Ottawa.
Molyneux, D. W., Rousseau, J., Cumming D., and Koniecki, M., 1998, “Model experiments to determine the survivability limits of damaged RO-RO ferries in waves”, Transactions of SNAME, Vol 105, pp. 297-321.
Nabavi, Y., Calisal, S. M., Akinturk A.,2006. “A computational investigation of the effect of geometric parameters on the discharge rate of a ship opening”. OMAE2006, 22nd Conference on Offshore Mechanics and Arctic Engieering, Hamburg, Germany