Publisher’s version / Version de l'éditeur:
Vous avez des questions? Nous pouvons vous aider. Pour communiquer directement avec un auteur, consultez la première page de la revue dans laquelle son article a été publié afin de trouver ses coordonnées. Si vous n’arrivez pas à les repérer, communiquez avec nous à [email protected].
Questions? Contact the NRC Publications Archive team at
[email protected]. If you wish to email the authors directly, please see the first page of the publication for their contact information.
https://publications-cnrc.canada.ca/fra/droits
L’accès à ce site Web et l’utilisation de son contenu sont assujettis aux conditions présentées dans le site LISEZ CES CONDITIONS ATTENTIVEMENT AVANT D’UTILISER CE SITE WEB.
Proceedings of the Fourth International Building Physics Conference: Energy Efficiency and New Approaches: 15 June 2009, Istanbul, Turkey, pp. 355-362, 2009-06-15
READ THESE TERMS AND CONDITIONS CAREFULLY BEFORE USING THIS WEBSITE. https://nrc-publications.canada.ca/eng/copyright
NRC Publications Archive Record / Notice des Archives des publications du CNRC :
https://nrc-publications.canada.ca/eng/view/object/?id=c9d0241a-88da-41be-b964-16accee8e577 https://publications-cnrc.canada.ca/fra/voir/objet/?id=c9d0241a-88da-41be-b964-16accee8e577
Archives des publications du CNRC
This publication could be one of several versions: author’s original, accepted manuscript or the publisher’s version. / La version de cette publication peut être l’une des suivantes : la version prépublication de l’auteur, la version acceptée du manuscrit ou la version de l’éditeur.
Access and use of this website and the material on it are subject to the Terms and Conditions set forth at
The need for an accurate indoor humidity model for building envelope performance analysis
http://irc.nrc-cnrc.gc.ca
T he ne e d for a n a c c ura t e indoor hum idit y
m ode l for building e nve lope pe rfor m a nc e
a na lysis
N R C C - 5 1 3 5 1
T a r i k u , F . ; K u m a r a n , M . K . ; F a z i o , P .
J u n e 2 0 0 9
A version of this document is published in / Une version de ce document se trouve dans:
Fourth International Building Physics Conference: Energy Efficiency and New Approaches, Istanbul, Turkey, June 15-18, 2009, pp. 355-362
The material in this document is covered by the provisions of the Copyright Act, by Canadian laws, policies, regulations and international agreements. Such provisions serve to identify the information source and, in specific instances, to prohibit reproduction of materials without written permission. For more information visit http://laws.justice.gc.ca/en/showtdm/cs/C-42
Les renseignements dans ce document sont protégés par la Loi sur le droit d'auteur, par les lois, les politiques et les règlements du Canada et des accords internationaux. Ces dispositions permettent d'identifier la source de l'information et, dans certains cas, d'interdire la copie de documents sans permission écrite. Pour obtenir de plus amples renseignements : http://lois.justice.gc.ca/fr/showtdm/cs/C-42
1 INTRODUCTION
The performance of a building envelope component depends on the indoor and outdoor boundary conditions that it is exposed to (Tariku and Kumaran, 2006; Tariku et al. 2007). Thus, establish-ing boundary conditions that represent the ‘real’ in-door and outin-door climatic conditions with which the building envelope component performance is as-sessed is very important. The outdoor boundary conditions are usually well defined based on meas-ured weather data. The weather data that is available for a location can be used for hygrothermal assess-ment of different building enclosure types that are built in the same location. But the indoor climatic conditions of those buildings can vary depending on the number of occupants, amount of indoor heat and moisture gains, type of interior furnishing, HVAC system and other factors. In fact, the outdoor bound-ary conditions themselves influence the indoor boundary conditions. Subsequently, the indoor
boundary conditions are usually highly variable with time, and are the result of heat and moisture balance of the indoor air. In building performance analysis, assumption of indoor boundary conditions with sim-ple indoor boundary conditions profiles such as con-stant temperature and relative humidity conditions or one set of values for winter and another set for summer may not be appropriate. The current trend is to use humidity models such as Class model (Sandberg, 1995) or ASHRAE Standard 160P mod-els (2006) to define the indoor boundary conditions. In this paper, the impact of indoor humidity assump-tions on the hygrothermal performance assessment of building envelope component is presented.
performance analysis
F. Tariku & K. Kumaran
National Research Council, Institute for Research in Construction, Ottawa, Canada
P. Fazio
Concordia University, Department of Building, Civil and Environmental Engineering, Montreal, Canada
ABSTRACT: The performance of a building envelope component is usually assessed based on the moisture analysis of individual components (such as cladding, sheathing board and/or drywall) for their drying poten-tials and likelihood of occurrence of problems associated with high moisture accumulation. In the current building envelope simulation practice, the indoor and outdoor boundary conditions are predefined in the con-text of the local weather data. The indoor boundary conditions are usually assumed to be constant throughout the simulation period, or two sets of values for the summer and winter periods are assumed. Although the outdoor boundary condition (weather data) is independent of the hygrothermal condition of the envelope, the indoor condition is highly influenced by the building enclosure and occupants’ activities. Consequently, sim-plistic assumptions of indoor humidity profiles, which ignore the dynamic coupling of the indoor environment and building enclosure and represented with a set of empirical values, may lead to inaccurate conclusion about the moisture performance of the building enclosure. In this paper, the effects of indoor humidity pro-files that are assumed during moisture performance evaluation of exterior building envelope component are analyzed. The indoor humidity profiles, which are considered in the study, are based on measured and simu-lated data of a real house. Indoor humidity models including a whole building hygrothermal model are used to generate four indoor humidity profiles. The hygrothermal dynamic responses of the building envelope com-ponent with respect to the various cases of indoor humidity assumptions are simulated and analyzed. The simulation results suggest that it is important to have more accurate indoor boundary conditions data, which are based on measurement or whole building hygrothermal modelling, to satisfactorily asses the moisture per-formance of a building enclosure and potential occupants health problems related to mould growth.
2 REFERENCE HOUSE INDOOR HUMIDITY The reference house considered in this paper is an occupied building in Carmacks, which is located in the northwestern part of Canada in Yukon Territo-ries at latitude of 62° 7' north and longitude of 136° 11' west and has an elevation of 543 m above sea level. As part of a NRC-IRC research project (Rous-seau et al., 2007) the indoor and outdoor conditions of the house were monitored for four weeks, January 19th to February 20th, 2006. The average outdoor temperature during the monitoring period is –19oC while the indoor temperature is fairly constant at 20oC. In addition to the indoor and outdoor tempera-ture and relative humidity the dimension, orienta-tion, building enclosure components including win-dows areas and orientations, air-tightness, occupancy and mechanical systems of the house were documented. Based on the available data the indoor humidity of the house is predicted using the Class, ASHRAE Standard 160P and HAMFitPlus (Tariku, 2008) models. Class-model is developed by Sandberg (1995) based on large-scale field survey results. Later on, the model is adopted in the Euro-pean Standard (EN ISO 13788) to generate the in-door humidity boundary condition that is required in the hygrothermal performance assessment of build-ing envelope components. The house is occupied by five people in the day time and six at night. It has a floor area of 81.9 m2 and volume of 196 m3. Based on the occupancy and use of the building the house can be categorized between medium and high classes. The corresponding indoor relative humidity predictions are represented as “Lower bound” and “Upper bound”, respectively, to cover the possible range of values. The ASHRAE Standard 160P In-termediate model takes four important building pa-rameters in consideration; these are: building size (volume), hurly local weather conditions (tempera-ture, relative humidity, wind speed and direction), moisture generation, and ventilation rates. The daily moisture generation rat (16 kg/day) is approximated based on occupant size as per the Standard. While the average ventilation rate, which is calculate by talking account the measured airtightness of the house, building orientation, wind speed and direc-tion, is 0.2 ACH (air-exchange per hour). The only set of data that is required to calculate the indoor relative humidity of the house using the ASHRAE Standard 160P Simple model is outdoor temperature record. The whole building hgyrothermal model, HAMFitPlus, takes into account window condensa-tion and moisture buffering effect of building enclo-sures in addition to 0 10 20 30 40 50 60 70 80 90 100
19-Jan 23-Jan 27-Jan 31-Jan 4-Feb 8-Feb 12-Feb 16-Feb
Time (Days)
Relative humidity (%)
ASHRAE Stanadard 160P--Simplified ASHRAE Stanadard 160P--Intermediate Class Model--Lower bound
Class Model--Upper bound HAMFitPlus
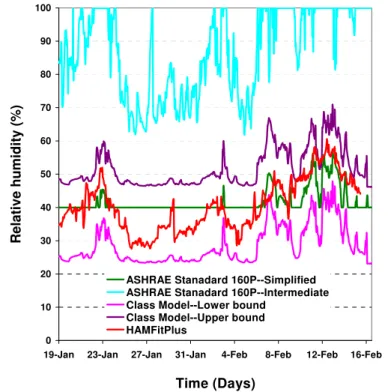
Figure 1 Indoor humidity profiles of a house under considera-tion generated by various models
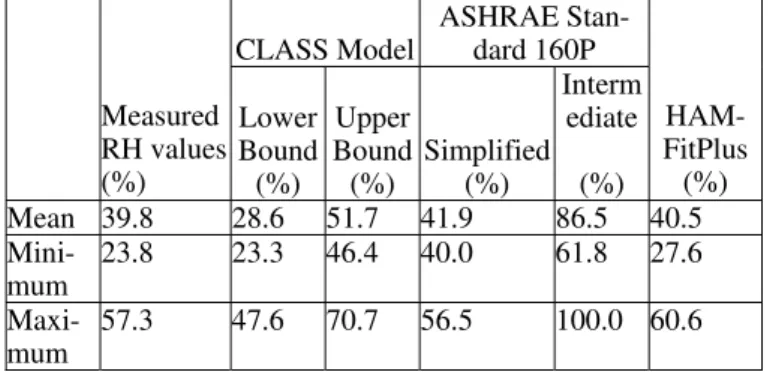
the parameters considered in the Intermediate model. The indoor relative humidity predication of these models for the house under consideration and moni-toring period (January 19th to February 20th 2006) are presented in Figure 1. As shown in Figure 1 and summarized in Table 1, the indoor humidity profiles obtained from the indoor models considered in this paper vary significantly. The mean predicted indoor relative humidity values of the HAMFitPlus and ASHRAE Standard 160P Simplified models (40.5 and 41.9%, respectively) are close to the correspond-ing mean measured value (39.8%). The highest and lowest predicted mean relative humidity values are 86.5 and 28.6%, respectively, which correspond to ASHRAE Standard 160P Intermediate model and lower bound of the Class model results, respectively. The minimum indoor relative humidity value pre-dicted by the Intermediate model is 61.8%, which is very high when compared to the actual measured minimum value (23.8%). Moreover, the Intermedi-ate model predicIntermedi-ated the highest indoor relative hu-midity value of 100% while the maximum measured value is 57.3%. HAMFitPlus’s minimum and maxi-mum indoor relative humidity values are 27.6 and 60.6%, respectively, which are close to the corre-sponding measured values (23.8 and 57.3%, respec-tively).
values obtained from measurements and numerical models. CLASS Model ASHRAE Stan-dard 160P Measured RH values (%) Lower Bound (%) Upper Bound (%) Simplified (%) Interm ediate (%) HAM-FitPlus (%) Mean 39.8 28.6 51.7 41.9 86.5 40.5 Mini-mum 23.8 23.3 46.4 40.0 61.8 27.6 Maxi-mum 57.3 47.6 70.7 56.5 100.0 60.6
In the following section, the indoor humidity pro-files that are generated by the Class model (Lower and Upper bounds), ASHRAE Standard 160P Sim-ple model and HAMFitPlus model are used for hy-grothermal performance assessment of a building envelope component. The ASHRAE Standard 160P Intermediate model’s prediction, however, is not considered due to its unrealistic and excessive in-door humidity prediction.
3 HYGROTHERMAL PERFORMANCE ASSESSEMENT OF BUILDING ENVELOPE COMPONET
3.1 Numerical tool
In this paper, the two-dimensional version of HAM-Fit (Tariku, 2008 and Tariku et al., 2008) called HAMFit2D is used to simulate the hygrothermal performance of a section of building enclosure. This transient model has the capability of handling the non-linear and coupled heat air and moisture (HAM) transfer processes through multilayered porous me-dia. It takes into account the non-linear hygrother-mal properties of materials, moisture transfer by va-por diffusion, capillary liquid water transva-port and convective heat and moisture transfers. The devel-opment and benchmarking of this simulation tool are described in detail in Tariku (2008) and Tariku et al. (2008).
In this model, the set of partial differential equations (PDEs) that govern the HAM transfer across building en-velope component are formulated based on building physics. The formulated PDEs are solved simultaneously for air velocity, temperature, and moisture distributions in the computational domain for a given outside environ-mental condition (weather data) and prescribed indoor conditions using finite-element based commercial soft-ware called COMSOL Multiphysics and MatLab. The model is successfully benchmarked against interna-tionally published analytical, numerical and experi-mental test cases (Tariku, 2008; Tariku et al., 2008).
The schematic diagram of this two-dimensional cor-ner section of the house, which is considered for evaluation of indoor humidity profile assumptions effect on building component performance, is shown in Figure 2. The exterior surfaces are covered with sheet metal, which is attached to 12.5 mm thick OSB sheathing board. The wall sections are insulted with 152.4 mm fiberglass insulation. The vapor barrier (Polyethylene sheet), which is installed behind the 12.5 mm gypsum board, is assumed to be continu-ous. The hygrothermal properties of the OSB, insu-lation, gypsum board and spruce are taken from the ASHRAE Research project RP-1018 ‘A Thermal
and Moisture Transport Database for Common Building and Insulating Materials’ (Kumaran et al.,
2002). The moisture storage capacity, heat capacity, liquid permeability and thermal resistance of the po-lyethylene sheet are assumed to be negligible. Its vapor permeability value, however, is taken from ASHRAE Fundamental (2005). For modeling pur-pose, the thermal and moisture transfer properties of the sheet metal are replaced with the respective equivalent surface resistance coefficients. The ab-sorptivity and emissivity of the exterior surfaces are estimated to be 0.40 and 0.60, respectively.
Figure 2 The schematic diagram of two-dimensional corner section that is considered for hygrothermal performance analy-sis.
Sheathing board (12.5 mm OSB) Sheet metal Glassfiber insulation (152.4 mm) Polyethylene sheet Gypsum board (12 mm) 50.8 X 152.4 mm Stud (Spruce) 400 mm 400 mm 152.4 X 152.4 mm Corner post (Spruce)
3.3 Boundary conditions
The hygrothermal simulations are carried out for the same period for which the indoor humidity profiles are predicted (January 19 to February 16, 2006). The computational domain of the corner section is descritized into 1920 quadratic elements, Figure 3. To control the overall mesh density (avoid excessively small and/or large number of elements) each layer is meshed independently, but in conformity with the other. This procedure is necessary due to the high variation in the thickness of the layers, for instance the insulation is about 1000 times thicker than the thinnest layer (Polyethylene sheet). The boundary conditions that are applied on all surfaces are Neumann type boundary conditions, where moisture and heat fluxes are used instead of surface temperature and relative humidity conditions (Dirichlet type boundary conditions). For surfaces A-F and C-D, shown in Figure 3, adiabatic/closed boundary conditions (zero flux) are assumed for both heat and moisture transfers. This is based on an assumption that the temperature and moisture gradients in the lateral directions of the walls become negligible at the mid section of a cavity, 400 mm from the corner point. The heat and moisture fluxes at the interior surface of the domain (D-E-F) are calculated from the in-door climate data, which are determined in Section Figure 3 by the respective humidity model, and us-ing heat and moisture transfer coefficients. The heat transfer coefficient of the two-dimensional corner surfaces is estimated to be 6 W/Km2 (Sanders 1996, IEA Annex 14 1991). The moisture transfer coeffi-cient of the corresponding surface is 2E-8 s/m, which is estimated based on Lewis relation (ASH-RAE Fundamental 2005). The heat transfer coeffi-cient accounts for both convection and long-wave radiation heat exchanges. The external surfaces (A-B-C) are exposed to the local weather conditions. Figure 4 and Figure 5 show the outdoor temperature and relative humidity that are recorded during the monitoring period.
Figure 3 Quadratic mesh of the corner section
Since the exterior layers are metal sheets, wind-driven rain load and moisture exchange with the sur-rounding is zero. Consequently a zero-flux condition for moisture exchange is assumed for these external surfaces. The effective heat flux on these boundary are calculated by adding the heat gain due to solar radiation and the net heat exchange between the sur-faces and the surrounding environment due to long-wave radiation and convective heat exchange mechanisms. For these external boundaries, the con-vective and longwave radiation heat exchanges are treated independently. The convective heat transfer coefficient depends on wind speed, and approxi-mated by Equation (1) (Sanders 1996). The long-wave radiation heat exchange is estimated based on European Standard prEN ISO 13791 (2004), Annex E.
(1)
where V is the wind speed measured at 10 m ‘adja-cent’ to the house.
Figure 4. Measured outdoor temperature
Figure 5 Measured outdoor relative humidity -50 -40 -30 -20 -10 0 10 20 30
19-Jan 23-Jan 27-Jan 31-Jan 4-Feb 8-Feb 12-Feb 16-Feb
Time (Days) Temperature ( oC) 20 30 40 50 60 70 80 90 100
19-Jan 23-Jan 27-Jan 31-Jan 4-Feb 8-Feb 12-Feb 16-Feb Time (Days) Relative humidity (%) 0.75 5.82 3.96 5 / 7.68 5 / o c o c h V V m s h V V m s = + ≤ = > A C B D E F
This building envelope section is relatively cold as a result of the thermal bridge that is created by the corner post (152.4 X 152.4 mm) and studs (50.8 x 152.4 mm). Figure 6 shows the typical temperature profile of the corner section of the house on January 29th, 2006. On this particular date, the daily average outdoor and indoor air temperatures were –40.4oC and 17.5oC, respectively. Observation of the tem-perature profile suggests that the coldest spot on the interior gypsum is a region around the junction of the two perpendicular gypsum boards. Similar tem-perature profiles are observed in all four simulation cases where the Lower bound (Class model), HAM-FitPlus, ASHRAE Standard 160P Simple model and the Upper bound (Class model) indoor humidity pro-files are used. This is expected since the indoor tem-perature is the same in all four cases. But the mois-ture distributions on the back of the gypsum board, more specifically at the region of interest, are quite different. The moisture distributions across the cor-ner section of the house at the time that corresponds to the temperature profile presented are shown in Figure 7 to Figure 10. In these figures the moisture distributions are represented in terms of relative hu-midity, and plotted in the same scale for comparison purpose. At this particular time, the daily average indoor relative humidity as predicted by the Lower bound (Class model), HAMFitPlus, ASHRAE Stan-dard 160P Simple model and the Upper bound (Class model) are 25, 34, 40 and 48%, respectively.
In all the four cases the moisture profile in the OSB and insulation layers does not change. This is because these layers do not exchange moisture nei-ther with the internal nor external environmental conditions as they are sealed with polyethylene and metal sheets in the interior and exterior surfaces, re-spectively.
Figure 6 Temperature profile of the corner section of the house on January 29th
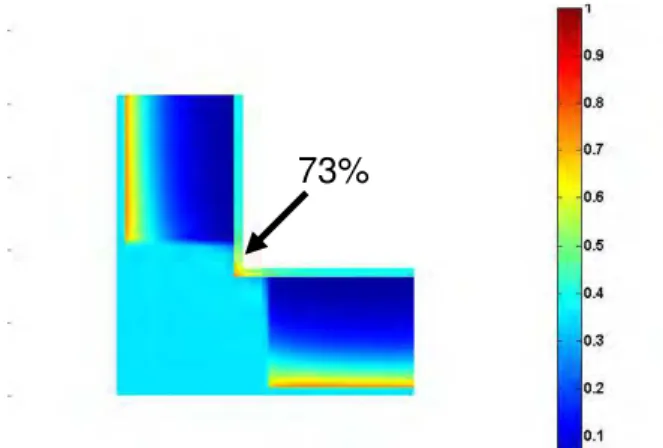
the corresponding indoor environmental conditions. As can be seen in all four relative humidity profile plots, the gypsum at the junction region experiences elevated moisture accumulation compared to the corresponding adjacent gypsum section. The figures also show various degree of moisture accumulation (at the junction region) for the four indoor humidity profiles used. The corresponding relative humidities are: 56% (Lower bound of Class model-Figure 7), 73 % (HAMFitPlus model-Figure 8), 94% (ASH-RAE Standard 160P Simple model-Figure 9), and finally 96% (Upper bound of Class model-Figure 10). The implies that the relative humidity at the junction region can vary from 56 to 96% depending on the indoor humidity profile that is assumed for the house under consideration. This wide range of simulation results reinforces the need for accurate determination of indoor humidity that can be used as indoor boundary condition in the analysis of build-ing envelope components performance.
Figure 7 Relative humidity profile of the corner section using indoor humidity profile generated by Lower bound of Class model
Figure 8 Relative humidity profile of the corner section using indoor humidity profile generated by HAMFitPlus
56%
Figure 9 Relative humidity profile of the corner section using indoor humidity profile generated by ASHRAE Standard 160P Simple model
Figure 10 Relative humidity profile of the corner section using indoor humidity profile generated by Upper bound of Class model
Figure 11 shows the temperature time history of the outermost junction point of the two joining gyp-sum boards. The temperature of this location varies between 2.4oC on January 29th and 15.7oC on Febru-ary 12, 2006. Generally, it is believed that tempera-ture over 0oC creates a favorable condition for mold growth if accompanied with high relative humidity for long enough time (Viitanen and Salonvaara, 2001). Accordingly, this critical location satisfies one of the criteria for mold growth. The relative hu-midity profiles of the same critical location as ex-posed to the four indoor humidity conditions are shown in Figure 12.
Figure 11 Temperature profile at the rear junction point of the two gypsum boards
Figure 12 Relative humidity profiles at the rear junction point of the two gypsum boards
The hygrothermal simulation results suggest that the amount of moisture accumulation in the corner gypsum depends on the type of indoor humidity model used to generate the indoor boundary condi-tions. The combination of the cold outdoor tempera-ture, which promotes condensation, and the higher indoor humidity predicted by the Upper bound (Class model) brings the relative humidity profile of the corner piece to a high level. In the simulation case where the indoor humidity predicted by the Lower bound (Class model) is used as an indoor humidity boundary condition, the same location ex-periences the lowest level of moisture accumulation. For most of the simulation period, the moisture pro-files of the critical point in cases with HAMFitPlus and ASHRAE 160P Simple models are close to each other, and lie more or less in the middle of the Upper and Lower bounds (Class model) results. Their de-viations are pronounced for about a week (26th of January to 2nd of February) when the ASHRAE Standard 160P Simple model over predicted the in-door humidity level. At this time the HAMFitPlus indoor relative humidity prediction reaches its low-est value of 23% due to the high ventilation rate that is caused by the relatively cold outdoor temperature, while the ASHRAE Standard 160P Simple model maintains the lower cutoff value of 40%. In general, the relative humidity of the critical point during the entire simulation period is less than 80% in the case of Lower bound (Class model) and 90% in the case of HAMFitPlus. In Table 2 the percentage of time at which the relative humidity of the corner piece is over 80 and 90% in the four indoor humidity models considered are presented. As shown in the table, the critical location experiences a relative humidity over 90% for 70 percent of the simulation period in the case of the Upper bound (Class model) and 26% of the simulation period in the case of the ASHRAE Standard 160P Simple model. The percentage of time in which this critical location has a relative hu-midity over 80% are 93, 47 and 30% for cases with the Upper bound (Class model), ASHRAE Standard 160P Simple model and HAMFitPlus, respectively. The average relative humidity of the
0 4 8 12 16 20
19-Jan 23-Jan 27-Jan 31-Jan 4-Feb 8-Feb 12-Feb 16-Feb T im e (D ays) T e m p er atu re (o C) 0 20 40 60 80 100
19-Jan 23-Jan 27-Jan 31-Jan 04-Feb 08-Feb 12-Feb 16-Feb Time (Days) Relative h u m id ity (% )
HAMFitPlus Lower bound--Class Model Upper bound--Class Model ASHRAE Standard Simple model
94%
96%
attains a relative humidity over 80 and 90%.
critical point for the cases with Upper bound (Class model), HAMFitPlus, ASHRAE Standard 160P Simple model and Upper bound (Class model) are 56, 76, 78 and 90%, respectively. Vittanen and Sa-lonvaara (2001) suggested that a gypsum board with relative humidity over 80% might create a favorable condition for mold growth. If one uses this relative humidity threshold as a measure of building enve-lope performance, the use of one or the other indoor humidity profiles that are generated by the various indoor models may yield different conclusions about the hygrothermal performance of the building enve-lope component. For instance, in the cases consid-ered here, the gypsum board can be assessed as it is at high mold growth risk (if one used the Upper bound Class model) or no risk (if one uses Lower bound Class model). As these simulation results suggest, it is very important to use a more accurate indoor model, which is based on whole building heat and moisture balance, to generate the indoor humid-ity profile that will be used as boundary condition in the hygrothermal performance analysis of building envelope components.
CONCLUSION
In this paper, the impact of indoor humidity assump-tions on the hygrothermal performance assessment of building envelope component is presented. The indoor humidity profiles of an occupied building that are generated using different indoor humidity mod-els including Class model, ASHRAE Standard 160P models and a whole building hygrothermal model, HAMFitPlus varies significantly. Subsequent use of one or the other model for hygrothermal perform-ance assessment of a building component yields dif-ferent moisture accumulation in the critical element of the building envelope section under consideration. As illustrated in this paper, incorrect assumption of indoor humidity profiles lead to inaccurate conclu-sion about the moisture performance of the building enclosure. Thus, it is very important to use a more accurate model, which is based on whole building hygrothermal analysis, to generate the indoor humid-ity profile that will be used as an indoor boundary condition in the hygrothermal analysis of building envelope components.
ASHRAE Handbook of Fundamentals (2005). American Soci-ety of Heating, Refrigeration, and Air-Conditioning Engi-neers, Atlanta
ASHRAE Standard 160P. (2006). Design Criteria for Moisture Control in Buildings. Draft
COMSOL Multiphysics: http://www.comsol.com/
European Standard prEN ISO 13791 (2004). Thermal Performance of Buildings – Calculation of Internal Temperatures of a Room in Summer Without Mechanical Cooling –General Criteria and Validation Procedures.
ISO/FDIS 13791:2004
IEA-Annex 14 (1991). Sourcebook, Annex 14 Final Report, Vol. 1, Leuven, Belgium
Kumaran, K.; Lackey, J.; Normandin, N.; Tariku, F.; van Re-enen, D. (2002). A Thermal and Moisture Transport Prop-erty Database for Common Building and Insulating Materi-als, Final Report—ASHRAE Research Project 1018-RP,
pp.229
Matlab: http://www.mathworks.com
Sanders, C. (1996). Heat, Air and Moisture Transfer through New and Retrofitted Insulated Envelope Parts, IEA Annex
24 HAMTIE, Final Report, Vol.2, Task2: Environmental
Conditions, ISBN 90-75741-03-0
Tariku, F.; Kumaran, M.K.; Fazio, P. (2008). Development and benchmarking of a new hygrothermal model. 11th
Interna-tional Conference on Durability of Building Materials and Components, May 11-14, Istanbul, Turkey, pp. 1413-1420
Tariku, F. (2008). PhD. Thesis, Concordia University, Mont-real, Canada
Tariku, F.; Cornick, S.; Lacasse, M. (2007). Simulation of Wind-Driven Rain Effects on the Performance of a Stucco-Clad Wall. Proceedings of Thermal Performance of the
Ex-terior Envelopes of Whole Buildings X International Con-ference. Dec. 2-7, Clearwater, FL
Tariku, F.; Kumaran, M. K. (2006). Hygrothermal Modeling of Aerated Concrete Wall and Comparison With Field Ex-periment. Proceeding of the 3rd International Building Physics /Engineering Conference, August 26-31, Montreal,
Canada, pp 321-328
Rousseau, M., M. Manning, M.N. Said, S.M. Cornick, M.C. Swinton, and M.K. Kumaran (2007), “Characterization of Indoor Hygrothermal Conditions in Houses in Different Northern Climates”, Thermal Performance of the Exterior Envelopes of Whole Buildings X International Conference, Clearwater Beach, FL, pp. 14, Dec. 2-7.
Viitanen, H.; Salonvaara, M. (2001). Failure criteria. Moisture
Analysis and Condensation Control in Building Envelopes,
ASTM Manual series 50: Chapter 4 CLASS Model Relative humidity (%) Lower Bound (%) Upper Bound (%) ASHRAE Stan-dard 160P Simplified (%) HAMFitPlus (%) > 80 0 93 47 30 > 90 0 70 26 0