Publisher’s version / Version de l'éditeur:
Technical Report, 2013-03-01
READ THESE TERMS AND CONDITIONS CAREFULLY BEFORE USING THIS WEBSITE.
https://nrc-publications.canada.ca/eng/copyright
Vous avez des questions? Nous pouvons vous aider. Pour communiquer directement avec un auteur, consultez la première page de la revue dans laquelle son article a été publié afin de trouver ses coordonnées. Si vous n’arrivez pas à les repérer, communiquez avec nous à [email protected].
Questions? Contact the NRC Publications Archive team at
[email protected]. If you wish to email the authors directly, please see the first page of the publication for their contact information.
For the publisher’s version, please access the DOI link below./ Pour consulter la version de l’éditeur, utilisez le lien DOI ci-dessous.
https://doi.org/10.4224/21271017
Access and use of this website and the material on it are subject to the Terms and Conditions set forth at
Requirements and system design for the new CIS MLR forecasting system (SIPS)
Serrer, Martin; Tivy, Adrienne
https://publications-cnrc.canada.ca/fra/droits
L’accès à ce site Web et l’utilisation de son contenu sont assujettis aux conditions présentées dans le site LISEZ CES CONDITIONS ATTENTIVEMENT AVANT D’UTILISER CE SITE WEB.
NRC Publications Record / Notice d'Archives des publications de CNRC: https://nrc-publications.canada.ca/eng/view/object/?id=16989651-7a0f-472a-a4c5-a8a0387c3d2b https://publications-cnrc.canada.ca/fra/voir/objet/?id=16989651-7a0f-472a-a4c5-a8a0387c3d2b
NATIONAL RESEARCH COUNCIL CANADA OCEAN, COASTAL AND RIVER ENGINEERING
Requirements and System Design for the
new CIS MLR Forecasting System (SIPS)
Type of Report - UNCLASSIFIED
OCRE-TR-2013-016Martin Serrer Adrienne Tivy March 2013
Re port Doc um e nt a t ion Form
Re port N um be r: Proje c t N um be r: Progra m
Arctic Technologies
Se c urit y Cla ssific a t ion
UNCLASSIFIED
Dist ribut ion
UNLIMITED
T it le (a nd/or ot he r t it le )
Requirements and System Design for the new CIS MLR Forecasting System (SIPS)
Aut hor(s) – Ple a se spe c ify if ne c e ssa ry, c orpora t e a ut hor(s) a nd N on-N RC a ut hor(s)
Martin Serrer, Adrienne Tivy
Clie nt (s)
Canadian Ice Service
Public a t ion T ype
Technical Report
La ngua ge
English
K e y Words (5 m a x im um )
software system, sea ice forecasting
Pa ge s
12
Confide nt ia lit y Pe riod
N/A
Da t e : REV # De sc ript ion: Pre pa re d
by: Che c k by: Approve d by: Click here to enter a date. Click here to enter a date. Click here to enter a date. Click here to enter a date. Click here to enter a date. Click here to enter a date. Click here to enter a date. Click here to enter a date. OCRE-TR-2013-016
National Research Council Conseil national de recherches
Canada Canada
Ocean, Coastal and River Génie océanique, côtier et fluvial Engineering
Requirements and System Design for the CIS MLR Forecasting System
(SIPS)
Type of Report UNCLASSIFIED OCRE-TR-2013-016 Martin Serrer Adrienne Tivy March 2013TABLE OF CONTENT
1 OVERVIEW ... 3
2 SOURCE DATA ... 4
2.1 Core source data ... 4
2.2 Additional source data ... 6
3 SYSTEM ARCHITECTURE ... 7
3.1 Functional diagram ... 7
3.2 File Types ... 8
3.3 Preprocessing - Source Data Translators ... 8
3.3.1 InitMasterPredictorTable ... 9
3.3.2 GenTSPredictors (source data 1,2,3,4,5,11,12) ... 10
3.3.3 GenGridPredictors (source data 6,7,8,9,10) ... 11
4 Regression Model ... 12 4.1 Input ... 12 4.2 Output ... 12 5 Forecasting ... 13 5.1 Input ... 13 5.2 Output ... 13 6 Visualization ... 14
1 OVERVIEW
SIPS will replace the current regression-based forecasting system, MLR-Model, that is run as a research tool and experimental operational tool at the Canadian Ice Service. The existing system is a large and complex collection of Fortran programs and scripts written in numerous languages (python, bsh, ksh, sed, etc.) that rely on a very rigid configuration both from an operating system as well as from a data organization point of view. The purpose of developing a new software system is to ease portability between computers, simplify the pre-processing and post-processing of input/output data, simplify the data structure, expand the application of the model, improve visualization, eliminate dependence on the proprietary NAG library and make the system accessible to other ice centers. All functionality found in the existing system will be retained.
In addition to the above stated improvements the SIPS system will include the following new functionality.
the ability to forecast on different time-scales
a mechanism to easily integrate new predictor datasets visualization and analysis tools
2 SOURCE
DATA
Source data for the MLR model is aggregated from many different sources. These data are published by different government and academic organizations from around the world. There are few data standards common to these organizations so that each database effectively is its own “standard”. A requirement of the new SIPS system is that all these existing databases be explicitly supported.
2.1 Core source data
This section lists the common data sources currently used by the Canadian Ice Service as input to the current MLR model. These data are all stored in proprietary formats and custom functions that decode these files are defined as part of the new SIPS system. These custom functions read these proprietary file formats and store the information in internal EnSim data-structures, from where it be manipulated and saved to various standard file formats.
1. http://climate.rutgers.edu/snowcover/files/moncov.nhland.txt http://climate.rutgers.edu/snowcover/files/moncov.eurasia.txt http://climate.rutgers.edu/snowcover/files/moncov.namgnld.txt http://climate.rutgers.edu/snowcover/files/moncov.nam.txt
- Snow cover for
- nhland - northern hemisphere - eurasia - eurasia
- namgnld - north america and greenland - nam - north america
- monthly from Nov 1966 to present - units million sq. km.
- format: ASCII time series files
2.http://www.cpc.noaa.gov/products/precip/CWlink/daily_ao_index/monthly.ao.index.b5 0.current.ascii.txt
- Atlantic Oscillation index
- monthly from Jan 1950 to present - format: ASCII time series files
3. http://jisao.washington.edu/pdo/PDO.latest.txt - Pacific Decadal Oscillation
- monthly from Jan 1900 to present
- format: ASCII table (year x month) embedded in text file. 4. http://www.cpc.ncep.noaa.gov/data/indices/soi.txt
- Southern Oscillation Index
- monthly from Jan 1951 to present - format: ASCII table (year x month)
5. ftp://ftp.cpc.ncep.noaa.gov/wd52dg/data/indices/tele_index.nh.txt - northern hemisphere teleconnection indices
- monthly from Jan 1950 - present
- format ASCII table, 10 attributes per time step
6. ftp://ftp.cdc.noaa.gov/Datasets/ncep.reanalysis.derived/surface/air.mon.mean.nc - Mean Air Temperature at sigma level 0.995
- 2.5 degree global grid (units degC) - monthly from Jan 1948 to present - format: NetCDF
7. ftp://ftp.cdc.noaa.gov/Datasets/ncep.reanalysis.derived/surface/slp.mon.mean.nc - Mean Sea Level Pressure
- 2.5 degree global grid (units millibars) - monthly from Jan 1948 to present - format: NetCDF
8. ftp://ftp.cdc.noaa.gov/Datasets/noaa.ersst/sst.mnmean.nc - Mean Sea Surface Temperature
- 2 degree global grid (units degC) - monthly from Jan 1854 to present - format: NetCDF
9. http://www.metoffice.gov.uk/hadobs/hadisst/data/HadISST_ice.nc.gz - Global ice concentration
- 1 degree global grid (units fraction) - monthly from Jan 1870 to present - format: NetCDF
10. ftp://ftp.cdc.noaa.gov/Datasets/ncep.reanalysis.derived/surface/hgt.mon.mean.nc - Mean Geopotential Height at 17 vertical levels
- 2.5 degree global grid (units m) - monthly from Jan 1948 to present - format: NetCDF
11. CIS – Canadian Ice Services ice chart database - ice concentrations for 51 areas
- weekly from Jan 1968 to present - format dbf (Dbase)
12. CDCD MET station time-series for northern stations
- temperature and freezing degree days for approximately 50 stations - daily data (varying periods of record)
2.2 Additional predictor data
When used in the context of operational forecasting, the SIPS system only requires support for the core datasets defined in the previous section. However since the SIPS model will also be used as an experimental model there is a requirement that databases from new sources be easily integrated.
EnSim provides data file standards for all the various data types used to store climatic and environmental information. By providing support for the standard EnSim file types in the SIPS preprocessing modules new databases can be included as additional predictors as they become available without changing the core SIPS system.
3 SYSTEM
ARCHITECTURE
The EnSim library developed by the National Research Council provides a comprehensive suite of tools for preparing, analysing and visualizing numerical modelling data. This library and its associated file types and data structures provides the framework for the SIPS system. The EnSim library is a class library developed in C++. In order to the fully exploit the power of the EnSim library the SIPS model and its various components will be developed in C++.
Although the target environment of EnSim library is the Microsoft Windows family of operating systems, EnSim will run on a LINUX platform within the context the “WINE” compatibility layer. (see: www.winehq.org)
3.2 File Types
Aside from the native source data file formats listed in section 2.1 there are four fundamental file formats used by the system. (See Appendix A in the Green Kenue or Blue Kenue reference manual for full format details: http://www.nrc-cnrc.gc.ca/eng/solutions/advisory/blue_kenue_index.html).
1. Parameter files. These ASCII files are used to supply control and
filename/location information to the various programs. These space delimited files generally adhere to the EnSim parameter file specifications.
a. informational records generally consist of keyword-value pairs. b. keywords start with a colon ‘:’ character.
c. value information containing a space ‘ ‘ character must be surrounded by double quote characters. (eg. “my file.txt”)
d. comments are introduced by a ‘#’ character.
2. Time-series (ts3) files. These ASCII files are the native EnSim time-series file formats. They consist of a header containing meta-data followed by the time-series information arranged in two space delimited columns, (time/date followed by value)
3. Table (tb0) files. These ASCII files are the native EnSim table file formats. They consist of a header containing file meta-data and column meta-data followed by the information arranged in space delimited columns. These files can be exported to a number of different formats including csv and dbf.
4. Rectangular grid (r2s) files. These files are the native EnSim rectangular grid (raster) file formats. They consist of a header containing grid meta-data including grid size, origin, and spacing followed by the values at all node locations starting from the southwest corner with the x index increasing fastest. These files can be exported to a number of common formats including ArcINFO ASCII Grid, Surfer, GRIB and xyz.
3.3 Preprocessing - Source Data Translators
Preprocessing of all source data is performed by translator programs. These programs are controlled by ASCII keyword parameter files. These programs read the source data from the native file formats, perform required processing such as temporal or spatial clipping, temporal aggregation, index computation, etc. and append their output to the master predictor table as additional columns.
The master predictor table is an EnSim tb0 formatted file. This table is the primary data input file to the regression model. The minimum data contents of the master predictor table required for running the regression model are three columns. The first column must contain the data stamp of every record over the training period sorted in ascending order.
The second column contains the predictand corresponding to the date stamp. The third column contains a predictor corresponding to the date stamp.
3.3.1 InitMasterPredictorTable
This module creates and initializes the master predictor table file. InitMasterPredictor parameter file keyword definitions:
Keyword type description
:RootDirectory dirname (optional) directory from which to start searching for filenames (relative paths). Defaults to directory containing this parameter file.
:MasterPredictorTable filename Name of output table
:PredictandFile filename Name of input time series containing the full predictand dataset
:TrainingPeriodStart yyyy-mm-dd Start year of training period. Used to temporally trim the predictand.
:TrainingPeriodEnd yyyy-mm-dd (optional) End year of training period. Used to temporally trim the predictand. Defaults to most recent available data in the predictand file.
3.3.2 GenTSPredictors (source data 1,2,3,4,5,11,12)
This module converts time series input files into predictors as per defined control parameters and appends them to the master predictor table. The supplied time series can be provided in one of six formats. The first five of these formats are rigid and particular to their respective data (RutgersSnowIndex through NOAATeleconnections). The sixth format is the standard EnSim type timeseries file and can contain any data. Any number of input time-series can be defined by using multiple :TimeSeries keywords.
GenTSPredictors parameter file keyword definitions:
Keyword type description
:RootDirectory dirname (optional) directory from which to start searching for filenames (relative paths). Defaults to directory containing this parameter file.
:MasterPredictorTable filename Name of output table
:DetrendFlag true|false Does the program remove long term trends before processing a timeseries.
:IncludeMonthlyAverage true|false Do we generate monthly averages from each time series.
:IncludeAnnualAverage true|false Do we generate annual averages from each time series.
:RollingAveragePeriod 2,3,4… Do we generate multi-month rolling averages from each time series. The value indicates the number of months used to generate the average.
:PredictorEndMonth yyyy-mm-dd Most recent predictor data used.
:LagWindow # Lag time in months. For how many months back
from PredictorEndMonth do we generate predictors.
:RutgersSnowIndex filename Input time series (Rutgers format) :NOAAAtlanticOscillationIndex filename Input time series (NOAA AO format) :JISAOPacificDecadalOscillationIndex filename Input time series (JISAO PDO format) :NOAASouthernOscillationIndex filename Input time series (NOAA SOI format)
:NOAATeleconnections filename Input time series (NOAA teleconnections format) :TimeSeries filename Input time series (EnSim ts3 format)
3.3.3 GenGridPredictors (source data 6,7,8,9,10)
This module generates predictors from temporally varying grided input files as per defined control parameters and appends them to the master predictor table. The supplied grids can be provided in NetCDF format organized as per their respective data. Maps of correlation coefficients generated will be stored as ASCII EnSim formatted r2s files.
GenGridPredictors parameter file keyword definitions:
Keyword type description
:RootDirectory dirname (optional) directory from which to start searching for filenames (relative paths). Defaults to directory containing this parameter file.
:MasterPredictorTable filename Name of output table
:DetrendFlag true|false Does the program remove long term trends before processing a timeseries.
:IncludeMonthlyAverage true|false Do we generate monthly averages from each time series.
:IncludeAnnualAverage true|false Do we generate annual averages from each time series.
:RollingAveragePeriod 2,3,4… Do we generate multi-month rolling averages from each time series. The value indicates the number of months used to generate the average.
:PredictorEndMonth yyyy-mm-dd Most recent predictor data used.
:LagWindow # Lag time in months. For how many months back
from PredictorEndMonth do we generate predictors.
:Polygon filename One or more polygons that define the spatial extent from which to extract time-series for predictor creation.
:RunFSig True|false Do we run a field significance test
:FSigIterations # Number of iterations for the field significance test :FSigPThreshold # P-value threshold for the field significance test :GridPredPThreshold # P-value threshold for generating grid predictors :NOAAMeanAirTemp filename Gridded temporal input (NOAA NetCDFformat) :NOAASeaLevelPressure filename Gridded temporal input (NOAA NetCDFformat) :NOAASeaSurfaceTemp filename Gridded temporal input (NOAA NetCDFformat) :NOAAGeoPotentialHeight filename Gridded temporal input (NOAA NetCDFformat) :HadleyIceConcentration filename Gridded temporal input (Hadley NetCDFformat) :Rect2DScalar filename Input gridded time series (EnSim r2s format)
4 REGRESSION
MODEL
The SIPS regression model (SIPS-RM) will be functionally identical and use the same numerical scheme employed by the current CIS MLR-Model. SIPS-RM will be coded in C++
Regression model input consists of a parameter file and the master predictor table prepared by the preprocessing modules described previously.
4.1 Input
SIPS-RM parameter file keyword definitions:
Keyword Type description
:RootDirectory dirname (optional) directory from which to start searching for filenames (relative paths). Defaults to directory containing this parameter file.
:MasterPredictorTable filename Name of predictor table
:RegressionResults filename Name of regression output table
:GenerateEnsembles true|false Do we generate multiple regression equations
:MaxEnsembles 2,3,4…. Maximum number of regression equations to generate :CoeffDetermEmsembles 0.7, 0.8 Threshold coefficient of determination for retaining
regression equation in the ensemble :SigCorrInclude 0.05, 0.1 P-value threshold for including predictors
:CorrRedundant 0.7, 0.8 Threshold correlation for the elimination of redundant predictors
:FStatIN 2.5, 3.6 Threshold F-statistic for entering forward-stepwise algorithm
:FStatOUT 2.5, 3.6 Threshold F-statistic for exiting forward-stepwise algorithm
:ModelMaxPredictors 2, 3, 4 Maximum number of predictors to retrain in the regression equation
:CrossValWindow 1, 3, 5 Window length for cross-validation
4.2 Output
Primary SIPS-RM output will consist of a single ASCII EnSim tb0 table file.
All information currently stored in the MLR-Model report file will be included in this table file. Regression statistics will be stored as meta-data in the file header.
Time-series information such as predictors, predictand, regression coefficients and errors will be stored as columns in the table.
5 FORECASTING
The SIPS Forecast module (SIPS-FM) uses the regression model results to predict future predictand values over a forcast period. Functionally this module will behave in identical fashion to the existing MLR-Model. SIPS-FM will be coded in C++.
5.1 Input
SIPS-FM parameter file keyword definitions:
Keyword type description
:RootDirectory dirname (optional) directory from which to start searching for filenames (relative paths). Defaults to directory containing this parameter file.
:RegressionResults filename Name of regression output table :MasterPredictorTable filename Name of output table
:ForecastStartYear yyyy-mm-dd Start year of forecast period.
:ForecastPeriod # Number of years to forecast
5.2 Output
Forecast module output consists of a simple text file (similar to the MLR-Model output) containing the predicted value for each forecast year and the associated above-normal-low scores.
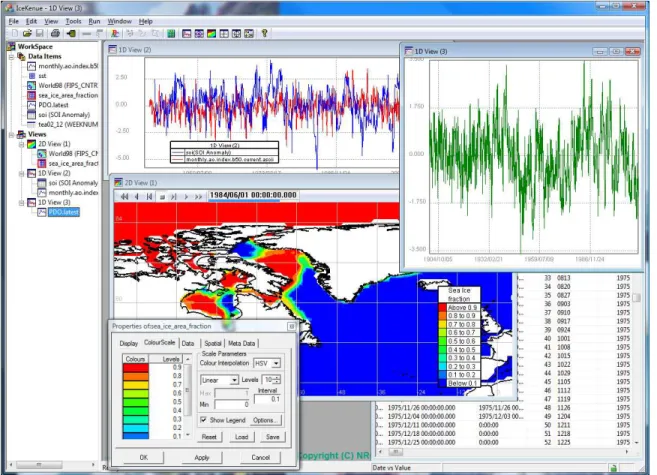
6 VISUALIZATION
To facilitate the interaction of the user with the various data types and files used, a custom EnSim desktop application known as IceKenue forms an integral part of the SIPS system.
As with other EnSim applications, IceKenue provides a standard suite of tools for creating, visualizing, analyzing and integrating, modeling, GIS and environmental data. In addition IceKenue provides support for loading, analyzing and visualizing all data used by SIPS. The command line preprocessing tools itemized in section 3.3 can be invoked within IceKenue interactively.