Publisher’s version / Version de l'éditeur:
Business Process Management Journal, 12, November 6, pp. 770-792, 2006-11-01
READ THESE TERMS AND CONDITIONS CAREFULLY BEFORE USING THIS WEBSITE.
https://nrc-publications.canada.ca/eng/copyright
Vous avez des questions? Nous pouvons vous aider. Pour communiquer directement avec un auteur, consultez la
première page de la revue dans laquelle son article a été publié afin de trouver ses coordonnées. Si vous n’arrivez pas à les repérer, communiquez avec nous à PublicationsArchive-ArchivesPublications@nrc-cnrc.gc.ca.
Questions? Contact the NRC Publications Archive team at
PublicationsArchive-ArchivesPublications@nrc-cnrc.gc.ca. If you wish to email the authors directly, please see the first page of the publication for their contact information.
NRC Publications Archive
Archives des publications du CNRC
This publication could be one of several versions: author’s original, accepted manuscript or the publisher’s version. / La version de cette publication peut être l’une des suivantes : la version prépublication de l’auteur, la version acceptée du manuscrit ou la version de l’éditeur.
For the publisher’s version, please access the DOI link below./ Pour consulter la version de l’éditeur, utilisez le lien DOI ci-dessous.
https://doi.org/10.1108/14637150610710927
Access and use of this website and the material on it are subject to the Terms and Conditions set forth at
An Integrated approach for risk-based life cycle assessment and multi-criteria decision-making - selection, design and evaluation of cleaner and greener processes
Sadiq, R.; Khan, F. I.
https://publications-cnrc.canada.ca/fra/droits
L’accès à ce site Web et l’utilisation de son contenu sont assujettis aux conditions présentées dans le site LISEZ CES CONDITIONS ATTENTIVEMENT AVANT D’UTILISER CE SITE WEB.
NRC Publications Record / Notice d'Archives des publications de CNRC: https://nrc-publications.canada.ca/eng/view/object/?id=31d3a063-f85c-4d27-91e1-ddd40f967c6b https://publications-cnrc.canada.ca/fra/voir/objet/?id=31d3a063-f85c-4d27-91e1-ddd40f967c6b
http://irc.nrc-cnrc.gc.ca
An int e grat e d a pproa ch for risk -ba se d life
cycle a sse ssm e nt a nd m ult i-c rit e ria
de c ision-m a k ing: se le c t ion, de sign a nd
eva luat ion of cle a ne r a nd gre e ne r
proc e sse s
N R C C - 4 8 3 6 0
S a d i q , R . ; K h a n , F . I .
A version of this document is published in / Une version de ce document se trouve dans: Business Process Management Journal, v. 12, no. 6, 2006, pp. 770-792
An integrated approach for risk-based life cycle assessment and multi-criteria
decision-making: selection, design and evaluation of cleaner and greener
processes
Rehan Sadiq1and Faisal I Khan2*
1Institute for Research in Construction, National Research Council, Ottawa, ON, Canada, K1A 0R6
2* Faculty of Engineering and Applied Science, Memorial University of Newfoundland, St. John's,
NL, Canada, A1B 3X5
ABSTRACT
Cleaner and greener technologies for process and product selection and design have gained popularity in recent years. Life cycle assessment (LCA) is a systematic approach that enables selection of cleaner and greener products and processes. Recently, significant progress has been made for the use of LCA for product/process evaluation and selection, however, its use in process design and environmental decision-making has not been fully exploited. There are challenging activities which require trade-offs among conflicting attributes like cost, technical feasibility and environmental impacts. These attributes can be analysed at the early design stage by considering the full life cycle of a process (and/or a product). A cleaner and greener process referred economical, technically feasible and environmental friendly alternative. This paper proposes an integrated methodology for design by combining LCA with multi-criteria making. This methodology is simple and applicable at the early design stage and guide decision-making under uncertainty. Application of the methodology is demonstrated through a case study of urea production.
Key words: LCA, cleaner and greener, fuzzy, risk-based and multi-criteria decision-making.
1. Introduction
Life Cycle Assessment (LCA) is a systematic approach to evaluate the environmental impacts associated with products, processes and/or services. LCA is a process of estimating
environmental burdens for energy and materials used and wastes released into the environment, and identifying opportunities for environmental improvements. The assessment includes the entire life cycle of the product, process or an activity starting from extraction (or excavation), processing, manufacturing, transportation, distribution, use, recycle, and final disposal (Fava et
al., 1991; USEPA, 1995; Tukker, 2000; Widiyanto et al., 2003; Benetto et al., 2004 ). The LCA guides regulatory agencies and other stakeholders for decision-making in design, selection and evaluation of a process. It may be used to evaluate the environmental impacts of a segment within a product or process’s life cycle where the greatest reduction in resource requirements and emissions can be achieved.
Traditionally the LCA is a product-centered approach but recent efforts have been towards process design, where economic, technological and environmental constraints control decision-making. Earlier efforts were mainly economic driven and focused on benefit or cost-effective analyses, which traded-off environmental and economic assets with an objective to maximize differences between socioeconomic benefits of an activity against the financial and environmental liabilities (Bhander et al., 2003).
The LCA overcomes many problems faced in the conventional approaches and establishes links between the environmental impacts, operation, and economics of the process (Kniel et al., 1996; Choong and Sharratt, 2000; Angelini et al., 2003; Suh et al., 2004). According to the ISO 14040, the LCA should assess the potential environmental issues and aspects associated with a product or service by compiling an inventory of relevant inputs and outputs; evaluating the potential environmental impacts; and interpreting the results of the inventory and impact phases in relation to the objectives of the study.
1.1 Literature review
Many attempts have been made by chemical industries to reduce pollution by implementing cleaner technologies (and/or processes). Frequently, it has been observed that the optimization of treatment process reduces the quantity of waste discharge at the end-of-the-pipe, but increases the overall environmental burden and impacts. Therefore, it is important to consider the adverse environmental impacts caused by any change or modification in the process and associated facilities as a whole. It is possible only when there is clarity in understanding relationships among design/operating parameters and associated environmental impacts.
El-Halwagi and Manousiouthakis (1989; 1990) and later Wang and Smith (1994) have
introduced the concept of mass pinch as a tool to derive cost optimal mass exchange networks with minimum emissions. They have proposed an interval based targeting procedure for the waste minimization considering energy and mass inputs. The waste minimization was achieved through recycling of the target stream or replacing with less harmful process. Pistkopoulos et al. (1994) proposed a methodology to estimate various environmental impacts by minimizing a
particular process through a cost function, which describes a relationship between impacts and process model.
Hernandez et al. (1998) proposed a model for pollution abatement. Kniel et al. (1996) presented an LCA case study for nitric acid. Though the article emphasizes the use of LCA in a design stage but lacks in providing details for the steps involved in the methodology. Azapagic and Clift (1999) demonstrated the application of the LCA in various processes and product selection. Azapagic (1999) and Azapagic and Clift (1999) have discussed the LCA application in the evaluation of process performance for various Boron products. Young and Cabezas (1999) have also proposed a methodology for sustainable design by waste reduction. Their methodology focused on minimizing the waste across the process boundary. Bhander et al. (2003) have presented a general discussion on the use of LCA in product design. Xian et al. (2003) have discussed development GPLCD (LCA tool) for electromechanical products green design. Widiyanto et al. (2003) studied life cycle inventory data for electric generation system in Indonesia. Bennetto et al. (2004) used LCA for coal based electric power generation system. Phekar and Ramachandran (2004) presented state-of-the-art review of LCA and MCDM for sustainable energy planning.
Spath et al. (1999) and Mann and Spath (1997) have used LCA for evaluating various options of a power plant. Later, Spath and Mann (2000) have demonstrated application of LCA in
evaluating different stages of natural gas combined cycle power generation system. This report emphasized the strength of an LCA in identifying and screening the environmental burdens at various life stages of the plant, which enables development of targeted remedial goals. In order to streamline the LCA approach, a workgroup (SETAC North America LCA streamline
workgroup) has been formed which discussed various steps of LCA and environmental parameters (Todd and Curran, 1999). Kohler and Lutzkendorf (2002) have presented development of new tool LEGOE based on integrated life-cycle-analysis.
The impact of any corrective or remedial measure may be beneficial for the process viewpoint, but modification required to achieve may cause severe environmental impacts outside the boundary of process. Khan et al. (2001) proposed GreenPro a design methodology for cleaner and greener process, which comprised of four steps. The first two steps deals with design problem formulation and the last two steps involved a design problem solution with multi-objective optimization and MCDM. Application of this methodology was demonstrated through selection of vinyl chloride monomer process. The GreenPro was effective in design, however it application is restricted at early design stage due to extensive computational load and large data requirements. Later, Khan et al. (2002) have tried to overcome earlier limitations and proposed a revised methodology GreenPro-I, which is more efficient, robust (less sensitive to the reliability of the data) and is applicable to early design stage. A detailed description of the GreenPro-I for greener and cleaner process selection and design is discussed here with the help of a case study. 2. GreenPro-I
The GreenPro-I comprises of two major steps - risk-based life cycle assessment (RBLCA) and risk-based multi-criteria decision-making (RBMCDM). These steps further consist of many sub-steps as shown in Figure 1.
2.1. Risk-based life cycle assessment (RBLCA)
The application of risk management tools aid in selection of discreet, technically feasible and scientifically justifiable actions that will protect environment and human health in a cost-effective way. The RBLCA is a process of weighting policy alternatives and selecting the most appropriate action by integrating the environmental risk assessment with social, economic, and political attributes to reach a decision. The RBLCA will choose the alternatives, which cause minimum environmental damages and evaluate the costs and benefits of proposed risk reduction programs. The RBLCA may integrate sociopolitical, legal and engineering factors to manage risks and environmental burdens of a process. The RBLCA considers human health, ecological, safety and economical risks information, which may involve preferences and attitudes of decision-makers.
Process design has two main objectives: 1) evaluating environmental performance of a process using cradle-to-gate approach and 2) selecting the best process design combinations. The
RBLCA identifies the options for the improvement of environmental performance and considers the material and energy supply chains within the system boundary. It includes material and energy flows into the system, outflows from the system and what have been used within the system. It classifies the environmental burden for all activities within the system boundary as material extraction/excavation, refining, transportation, construction and commissioning of the plant, production and decommissioning, and final disposal.
2.1.1 Defining the scope and boundary
The scope of RBLCA must be clearly articulated and system boundaries are defined objectively to ensure that no relevant elements of the system are missed. It requires backtracking from the conventional process system to the natural state of pure raw materials, which are available at no environmental liability. The global system boundary includes inputs and their routes with output emissions which form an aggregated waste vector. Although this definition is consistent with the conventional LCA for products, but it does not include the routes and stages of the product after leaving the process (i.e. cradle-to-gate instead of cradle-to-grave approach).
2.1.2 Life cycle inventory (LCI)
Energy and material inputs, wastes and emissions data must be collected and environmental load should be quantified in order to accomplish the RBLCA goals. The LCI analysis is used for collecting data and quantifying environmental load based on material and energy balances. LCI analysis should be comprehensive to make the final decision, but in instances where rough estimates have to be made, they must be conservative and clearly noted. Data quality will likely vary depending upon its source therefore to ensure that the data used are in the best available form and the sources are contemporary, an extreme care must be taken.
The LCI analysis starts with the identification of environmental hazards expected at various units. These hazards are due to the chemical compounds involved in the process that upon release adversely affect to humans or to the environment. It also includes hazard due to severity
of operating conditions like temperature and pressure. The chemical hazards are not limited to process chemistry, rather they include cleaning solvents, heating and cooling agents, and all other chemicals involved in any part of the process.
2.1.3. Environmental impact and risk assessment (EIRA)
Environmental impact and risk assessment (EIRA) examines the potential and actual
environmental and human health effects from the use of resources (energy and materials) and environmental releases. An EIRA includes classification, characterization, and valuation.
Classification is the process of assigning and aggregating results from the inventory into relatively homogeneous impact categories. This process involves identifying stressors and organizing them with respect to impact on the ecosystem. For example, carbon monoxide, chlorine and methane are all stressors with the potential to impact the environment under the category of global warming. Classification includes the creation of complex stressor/impact chains, because a single pollutant can have multiple impacts, and a primary impact can result in secondary (or greater) impacts through cascading impact chain process. The general categories are: ozone depletion (OD), acid rain potential (AP), photochemical oxidant impact (POI), global warming potential impact (GWPI), controlled toxic water mass (CTWM), solid mass disposal (SMD), safety risk (SR), human health risk (HHR), ecological risk (ER), and natural resource depletion (RD).
Characterization assesses the magnitude of impacts for each of the stressor categories in order to translate LCI into impact descriptors. Characterization methods of few categories are depicted below.
CTWM is a controlled toxic mass flow rate of water pollutant (kg pollutant/h);
SMD is a solid mass disposal rate (kg solids/h);
GWPI is a mass of pollutant (kg/h) × global warming potential (kg CO2 equivalent/h); (Global
warming potential for each pollutant is defined by equivalent of CO2) POI is estimated in terms of equivalent of ethylene (kg ethylene/h);
OD is expressed by their ozone depletion potential in terms of CFC-11 equivalent/h;
AP is based on the contributions from SO2, NOx, HCl, NH3, and HF due to their potential of
acidic deposition i.e. potential to give H+ ions;
HRR is characterized by a concentration of contaminant at specified location exposed to human population (using reference dose RfD);
SR is quantified by individual risk factor at the study area due to any eventuality in the operation and determined by divided a factor of 1.0 × 10⁻⁶; and
ER is characterized as a concentration of contaminant at specified location as exposed to ecological community (using No-observed-effect-concentration, NOEC).
Valuation is assigning relative values or weights to different impacts, economic and performance measures to determine the total impact. An analytic hierarchy process (AHP) is used for this purpose, which involves a structured description of the hierarchical relationships among various decision attributes. Assigning weights is a group exercise, where experts are asked to reach on a consensus. The experts may include cost estimator, process specialist, environmental engineer, and/or ecologist/toxicologist.
2.1.4 Design problem formulations
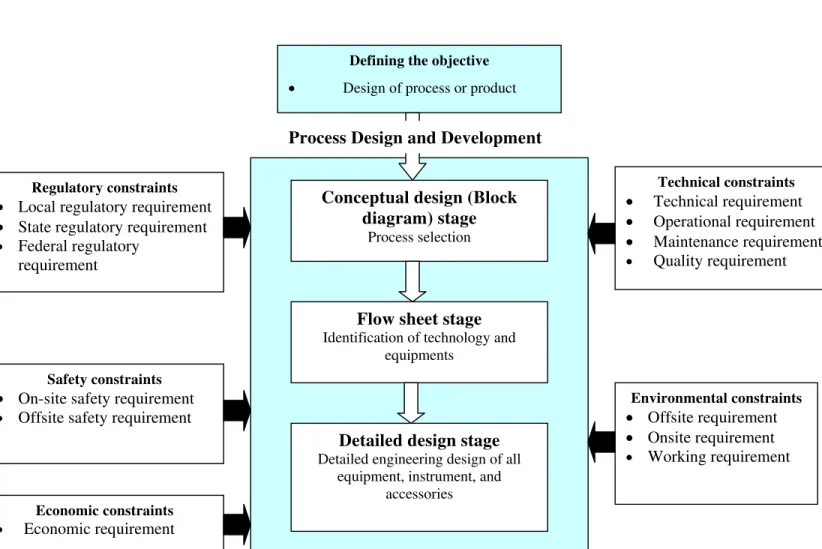
Development and designing of a process involves consideration of number of constraints (see Figure 2), which guide to the decision-making. Many researchers have argued consideration of environmental performance and safety in design, which may lead to cost effective cleaner and greener process. Cabezas et al. (1997, 1999) incorporated environmental impacts into process design model through mass balance equations. It is necessary to relate the environmental impacts to measurable quantities. A generalized linear theory proposed by Mallick et al. (1996) and Cabezas et al. (1999) has been adopted in this study. In order to analyze the relationship between environmental impact and process cost, a mathematical framework has been used. The process is represented by a set of mathematical equations, which describe the properties of the inlet stream, waste stream, and equipment specifications, cost functions and the degree of pollutant removal. The details of the mass and energy balance equations and the derivation of environmental function can be seen in Khan et al. (2001).
2.2 Risk-based multi-criteria decision-making (RBMCDM)
Various MCDM approaches are available in literature which use either fuzzy or crisp numbers. Many research attempts have been made for decision-making under uncertainty using probability theory and fuzzy set theory (Pohekar and Ramachandran, 2004). Fuzzy composite programming (FCP) and AHP are used in proposed RBMCDM. A traditional MCDM problem can be
expressed in a matrix form:
n 2 1 mn 2 m 1 m n 2 22 21 n 1 12 11 m 2 1 X X X X X X X X X X X X A A A L L M L L M ⎥ ⎥ ⎥ ⎥ ⎦ ⎤ ⎢ ⎢ ⎢ ⎢ ⎣ ⎡ (1) where
Ai = 1, 2,..., m are possible actions or alternatives;
Xij = Performance rating of an alternative Aiwith respect to an attribute Xi.
In real life, it is common that Xij may not be assessed precisely due to unquantifiable, incomplete, and non-obtainable information. The unquantifiable information means subjective attributes e.g.,
good, poor, high, low, etc. The examples of incomplete information are about one million, less
than 10 miles per hour. Sometimes crisp data are obtainable but need lot of resources, but approximation can be achieved with less effort and time. Linguistic descriptions are employed due to unavailability of information or lack of resources. The fuzziness is also attributed to ignorance from factual conditions. These limitations make fuzzy-based approach a strong candidate for RBMCDM. The FCP (an approach selected for RBMCDM) involves following two steps:
• The aggregation of the performance scores of all the attributes for each alternative; and • The rank ordering of the alternative according to aggregated scores.
MCDM methods require information about relative importance of attributes or criteria. It is usually established by set of preference weights, which are normalized to a sum of 1. In case of n criteria, a set of weights can be written as
) w ,...., w ,..., w , w ( W 1 2 j n T = and (2) ∑ = = n 1 j j 1 w (for a given i) (3)
Therefore MCDM problem becomes
⎥ ⎥ ⎥ ⎥ ⎦ ⎤ ⎢ ⎢ ⎢ ⎢ ⎣ ⎡ ⎥ ⎥ ⎥ ⎥ ⎦ ⎤ ⎢ ⎢ ⎢ ⎢ ⎣ ⎡ = n mn m m n n w w w X X X X X X X X X D M L M L L 2 1 2 1 2 22 21 1 12 11 (4)
Saaty (1988) proposed analytic hierarchy process to estimate the relative weights of attribute in a group based on a pair-wise comparison. To compare attribute "i" with "j" the decision-maker can assign importance values from Table 1 and determine weights.
2.2.1. Converting qualitative items into fuzzy numbers
In cases where we deal with linguistic terms, a numerical approximation is proposed to convert linguistic terms into corresponding fuzzy numbers. Chen and Hwang (1992) have defined eight scales to convert linguistic terms into fuzzy numbers. One of the most important scales is shown in Figure 3. This scale has 5 levels. The linguistic terms used to describe this scale are very low,
low, medium, high and very high. Same linguistic terms contain different meaning in different scales. The high in this scale means [(0.6, 0), (0.75, 1), (0.9, 0)], i.e. most likely value (i.e. when
membership function μ(x) is 1) is 0.75 and the largest likely interval is in between 0.6 and 0.9 (when membership function, μ(x) is 0).
2.2.2. Grouping of attributes
It is difficult to select an appropriate MCDM strategy when the values of input variables (such as ecological, safety and human health risks, cost, and qualitative terms like technical feasibility) are uncertain or qualitative in nature. The FCP is used to assist decision-makers in solving problems of multiple attributes and conflicting objectives.
The first step in FCP is the normalization of the basic indicators. This is necessary because all basic indicators have non-commensurate units and are difficult to compare in their respective units. At the first level, human health, ecological, and safety risks are grouped into
environmental risk reduction index (RI). Similarly, global warming potential and ozone depletion are grouped to get the warming reduction index (WI). At level 2, the warming reduction,
acidification reduction (AI), pollution reduction (PI) and risk reduction (RI) indices are grouped as sink depletion - improvement index (SDI). The same procedure is repeated for other basic indicators, e.g., technical feasibility index of any alternative is developed from ease of operation (EO), efficiency (EF), status of technology (ST) and control measures requirements (CM). The Level-3 sink depletion (SDI) and resource depletion (RDI) improvement indices are grouped to form the environmental - improvement index (EI). The same procedure is repeated for cost saving index (CI). The grouping for different attributes is performed in steps, until we get the environmental, cost saving and technical feasibility indices to make a trade-off analysis among these conflicting objectives. This trade-off analysis for different alternatives can be made at all hierarchy levels. The system improvement index (SI) value at Level 5 represents the contribution of environment, cost saving and final technical feasibility of operations (see Figure 4).
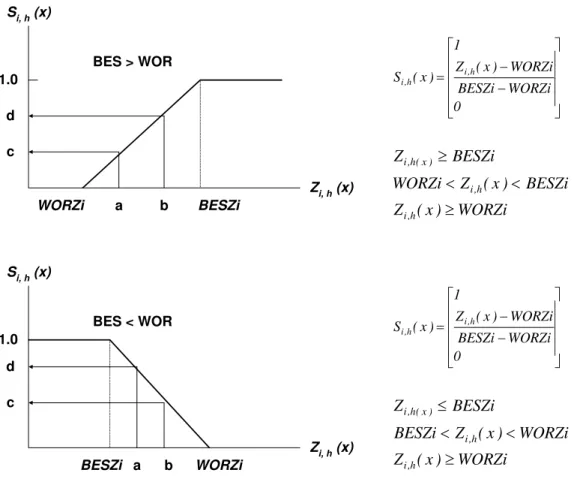
The values of the basic indicators are designated by fuzzy numbers to characterize their uncertainties. By defining Zi (x) as a fuzzy number of the ith basic indicator with a trapezoidal membership function of μ[Zi (x)], various management alternatives under uncertainty can be evaluated. Since units of basic indicators are different, the actual value of each basic indicator should be transformed into an index, Si,h(x), using the best (BES) or the worst (WOR) value of the indicator as shown in Figure 5 (see Lee et al., 1991 for details). Using the normalized index values of basic indicators, the Level 2 index values, Lj,h (x), of composite indicators can be defined by
[
]
(1/pj) nj 1 i pj j , h , i j , i h , j (x) w S (x) L ⎭ ⎬ ⎫ ⎩ ⎨ ⎧∑ = = (5) wherenj = Number of elements in second-level group j;
Si,h,j (x) = Basic value for ith basic indicator in the second level group j of basic indicators with
wi,j= Weight reflecting the importance of each of basic indicator (∑ wi,j = 1); and
pj = The balancing factor for group j.
Further, the index values Lk,h (x), of third level composite indicators can be calculated by the index values for second level composite indicators. This procedure is repeated till the final step, which compares three indices - environment, cost saving and technical feasibility.
2.2.4. Ranking method
When fuzzy data are incorporated into MCDM problem the final ratings are no longer crisp number rather they are fuzzy numbers. The fuzzy numbers are not straightforward to compare. Chen's ranking method (1985) for defuzzification is extensively used for risk-cost trade-off analysis (Sadiq et al., 2003). The alternative, which has the highest ordering value, is selected as the best alternative. Khan et al. (2002) and Sadiq (2001) have described this method in detail. Chen (1985) has generalized the results for trapezoidal fuzzy numbers as following:
⎥ ⎦ ⎤ ⎢ ⎣ ⎡ − + − − − + − − − − = ) ( ) ( ) ( 1 ) ( ) ( ) ( 2 1 ) ( min max max min max min i i i i i i T c a L L c L d b L L L d x U (6)
3. Selection of Urea Production Processes
Being the cheapest source of nitrogen, urea is the most common fertilizer. India has 41 urea plants of total capacity 20.1 metric ton, 19 out of them are based on natural gas (alternative 1), 14 on naptha (alternative 2), 6 on fuel oil (alternative 3) and 2 on coal, as feedstock (alternative 4) (Roy, 2001). Percentage contributions of each feedstock to the total installed capacity are: natural gas 54.2%, naptha 26.1%, fuel oil 18.2%, and coal 1.5%. The cost of urea production is more than $ 168/ton in India while the cost of importing urea from US is about $116 per ton. The higher cost of production is due to costlier inputs in the form of feedstock of petroleum origin (Roy, 2001).
3.1 Urea production process
Ammonia, the raw material for the urea is synthesized from hydrocarbon feedstock. Urea is produced from a chemical reaction involving ammonia and CO2. Production of ammonia
accounts for more than 80% of the total energy consumed in urea production. Ammonia production involves feed treatment, steam and air reforming of hydrocarbons, gas purification, and synthesis. The major reactions involve in the production of urea are:
CH4 + H2O → CO + 3H2
CH4 + air → CO + 2H2 + N2 (7)
N2 + 3H2 → 2NH3 (8)
Ammonia is then further converted into urea
CO2 + 2 NH3 → NH4CO2NH2 → NH2CONH2 + H2O (9)
In the above process, hydrogen is chemically separated from the hydrocarbon feedstock and combined with nitrogen to produce NH3. A chemical solution (scrubber) is added which absorbs
some of the CO2 produced in this reaction. The remaining CO2 is converted into methane in a
methanator because methane is more inert as compare to CO2. The CO2 percentage on dry mole
basis in synthesis gas varies from 28.6% (Lurgi process) to 6.2% (Koppers-Totzec process) but in Winkler process it is 20.5% .The sulfur and CO2 are removed from the synthesis gas before it
is methanated. The scrubbing solution is then passed through a process of re-generation. This process releases the absorbed CO2 into the atmosphere. Emissions of CO2 depend upon the type
of hydrocarbon used for the production of ammonia. SO2, NOX, CO and non-methane volatile
organic compound may also be emitted in addition to CO2. In the urea production there is not
significant gas emissions because 99 % of CO2 and NH3 are converted into urea (Holmstrom and
Comer, 1999). Details of different process can be seen in Mavrovic et al. (1998).
3.2 Application of RBLCA
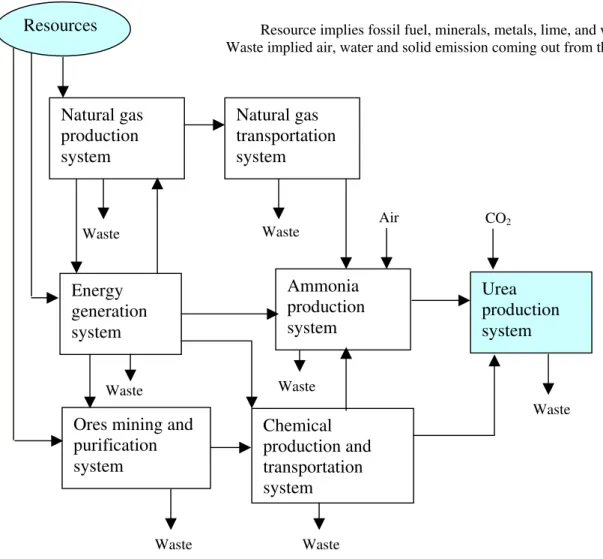
Boundaries and scope of the problem have been defined in Figure 6. Nine environmental indicators for six main processes are considered. Among various environmental indicators RD,
GWPI and environmental risks are of major concern. It must be noticed that CO2 is used as one
of the basic raw material in urea production thus causing a positive impact on environment. This effect is duly accounted in GWPI ad SDI computation for urea plant.
Resource consumption is large in case of coal-based process, which is then followed by fuel oil and naptha. Though RD for natural gas option is also high but this value is comparatively lower than the other three alternatives. Detailed results of environmental impacts for various activities are given in Table 2. Natural gas production and transport, ore mining and processing and energy production are three major activities contributing to the RD. Ammonia production and energy production are the two major processes contributing to GWPI. Energy production is contributing about 30% while ammonia production about 25% of the total GWPI. Among various sources, CO2 is a major pollutant contributing about 78%, followed by methane 12%, and oxides of
nitrogen and others about 4% of the total GWPI. The POI and OD are the other indicators of concerns. They occur due to light hydrocarbons release in various processes. For OD, natural gas production, transportation and ammonia production approximately 45%, 25% and 15%
contribute energy production, respectively. In case of POI natural gas production and transport, energy production, and ammonia production are contributing with the same order of magnitude. For three risk factors - HHR, SR, and ER - ammonia and urea process operations are major contributors to these risks. These processes contribute about 38% (average) of the total risk, followed by natural gas production, transport and energy production. Mining process is the next most significant contributor (20%). The results are shown in Table 2.
Ammonia and urea productions are the major contributors to the total environmental burden therefore these processes are studied in-depth. The results of this analysis are presented in Table 3. The reforming unit is the main contributor (about 35%) to the total GWPI due to
ammonia and urea plant which is then followed by Hydro-desulfurrization and ammonia reactor. In case of OD and POI, reforming unit is the main contributor. The CO converter unit and urea reactor are major contributors to SMD and CTWM. Ammonia reactor is of concern to human health, safety and ecological risk, contributing 25%, 30% and 30%, respectively. A meticulous study of safety risk reveals that ammonia reaction unit is the most vulnerable (contributes 30% of the total risk). It is followed by hydro desulfurizing (15%), reforming unit (15%) and urea
reactor (15%) (Table 4). For safety risk the hazards including fire, explosion, and toxic release are rated equally important. The HHR analysis shows that the fuel oil based process poses a maximum HHR followed by naptha, coal and natural gas based process. Among various
exposure routes, air exposure route is of major concern, which contributes about 55% to the total
HHR followed. It is followed by exposures through water (35%) and soil (10%). The chemicals of concern and their respective contributions through different exposure routes are presented in Table 5. It is evident that ammonia and VOC in air, urea, heavy metals and acids in water and soil are of major concern.
It is noted that the ammonia reactor, reforming and hydro-desulfurization units are of utmost importance and improvement in the operational performance of these units would significantly improve the environmental quality of the overall production process.
3.3 Application of RBMCDM
Selecting a management alternative which requires minimum cost, causes minimum
environmental damage and is technically sound is a challenging task due to conflicting nature of the objectives. These conflicting objectives are achieved by employing FCP and AHP, where the best alternatives will be the one, which has the highest value of system improvement index (SI). The attributes considered in this study are a long list of basic indicators, which include technical feasibility and cost other than environmental parameters discussed before. These basic indicators are expressed in non-commensurate units. Some basic indicators are expressed qualitatively. The technical feasibility and cost saving indicators are defined based on a scale given in Figure 3. The values obtained from this scale are unitless. To convert other basic indicators into unitless terms, normalisation is required as explained earlier in this paper. Basic indicators are
normalized based on their reported BES and WOR values (as explained in Figure 5)
Table 6 presents all basic indicators into their normalized form. The normalized values of the environmental basic indicators show that higher the value more will be the environmental protection. The advantage of converting all basic indicators into their normalized forms is that they are commensurate with each other and can be aggregated to form a general group.
The next step is to decide the weights of attributes based on their relative importance. Table 7 presents the relative importance matrix used in this study. The human health, ecological and safety risk indices are grouped to develop a risk reduction index (RI). The higher value of risk reduction index shows lower risk. It is now consistent with all other environmental basic
indicators whose higher values depict improvement in the system. The grouping is performed at four levels. At first level all basic indicators are grouped. The weights are estimated based on their relative importance. The eigen value method is used to estimate the w for each attribute. Triangular fuzzy numbers are used to define basic indicators therefore the estimated indices (at higher levels) will also be fuzzy numbers. The risk reduction index is developed from human health, ecological damage and safety risks due to fire, spills and accidents is shown in Figure 7. The alternative 2 is the best management alternative in comparison to other options for risk reduction index. MLV of option is nearest to 1.0 representing lower risk, and the base of the alternative 2 fuzzy number is the smallest showing lower uncertainty. Alternative 2 is followed by options 1, 3 and 4. Similar plots can be developed for indices at various hierarchical levels. The final system improvement indices are shown in Figure 8. The system improvement index shows that alternative 2 is the best management option, which is followed 1, 3 and 4. The alternative 1 is close to alternative 2. The alternative 4 is the least desirable design alternative (coal as feed stock based process). The uncertainty in estimates of alternatives 1, 2 and 3 are approximately same which can be observed from base of fuzzy numbers.
To make a trade-off among conflicting objectives environmental improvement and cost saving, 2-D fuzzy numbers are shown in Figure 9. The x-axis represents the cost saving index (CI) whereas the y-axis represents the environmental improvement index (EI). The base of the fuzzy numbers are plotted in 2-D, where a line of rectangle parallel to x-axis represents the cost saving index range and line parallel to y-axis represents the environmental improvement index range. The most likely values are plotted as points. It can be noticed that alternative 2 rectangle is smaller in size and close to the ideal conditions (1.0, 1.0). Therefore, from cost saving and environmental improvement viewpoints, alternative 2 promises better results than the other options. Table 8 summarises the utility index values, and ranking orders of alternatives. The Chen (1985) ranking method is used here. From utility values, it can be concluded that alternative 1 and 2 are very close to each other.
The last step of FCP is to conduct a sensitivity analysis. The assignment of relative importance and balancing factors (p) depends on human judgement. To avoid the human bias, different weighting schemes are used for this purpose and analysis is repeated. Table 9 shows the alternate weighting schemes to re-evaluate the system improvement indices. In trial 1 the environment was given higher priority. The trial 2 represents the case when cost saving is given more
importance than environmental improvement. The trial 3 represents the case when environment and cost saving are given equal importance. The final utility values for all three trials are plotted in Figure 10. The result shown in Figure 10 proves that alternative 2 is the best management alternative, which is followed by alternatives 1, 3 and 4.
4. Summary and Conclusions
The GreenPro-I is a systematic approach to estimate environmental risks/impacts associated with life cycle of products, processes and services. It evaluates environmental burdens by quantifying energy and materials used and waste released into the environment. It identifies and
evaluates opportunities, which affect environmental improvements. The assessment may include the extraction/excavation and processing of raw materials, manufacturing, transportation and distribution, use, recycle, and final disposal. The GreenPro-I is proposed as a comprehensive decision-making tool for designers, regulatory agencies, business organizations and other stakeholders.
The GreenPro-I overcomes many of the problems faced in the conventional approaches and establishes a link between the environmental risks/impacts, cost, and technical feasibility of processes. It offers an extended environmental perspective, considering risks/impacts from resource extraction to the end product use and disposal. The GreenPro-I relates these effects to the mass and energy flows into, out of, and within the process. The present work has focused on the development of process selection and design methodology considering assessment and minimization of risks/impacts by embedding the conventional LCA principles in decision-making framework. It has implications to process synthesis as it includes environmental
objectives with technical feasibility and economics at the design stage to determine cost effective solutions. Authors believe that employing the GreenPro-I for process design and
decision-making would yield a best management alternative among options available.
5. Acknowledgements
Authors thankfully acknowledge the financial support of Natural Science and Engineering Research Council (NSERC) under Discovery grant.
6. References
Angelini, E.., De Benedetti, B., Grassini, and S. Marino, M. (2003). Life cycle assessment of coating treatments for automotive magnesium parts, Materials Science Forum, 426-432(1), 195-200.
Azapagic, A., and Clift, R. (1999). The Application of Life Cycle Assessment to Process Optimization, Computers and Chemical Engineering, 23, 1509-1526.
Azapazic, A. (1999). Life Cycle Assessment and its Application to Process Selection Design and Optimization, Chemical Engineering Journal, 73, 1-21.
Benetto, E., Rousseaux, P., and Blondin, J. (2004). Life Cycle Assessment of Coal By-products based Electric Power Production Scenarios, Fuel, 83(7-8), 957-970.
Bhander, G. S., Hauschild, M., and McAloone, T. (2003). Implementing Life Cycle Assessment in Product Development Environmental Progress, 22(4), 255-267.
Cabezas, H., Bare, C.J., and Mallick, S.K. (1997). Pollution Prevention with Chemical Process Simulators: The Generalized Waste Reduction (WAR) Algorithm, Computers in Chemical
Engineering, 21, s305-s310.
Cabezas, H., Bare, C.J., and Mallick, S.K. (1999). Pollution Prevention with Chemical Process Simulators: The Generalized Waste (WAR) Algorithm-Full Version, Computers in Chemical
Engineering, 23, 625.
Chen, S.H., (1985), Ranking Fuzzy Numbers with Maximizing Set and Minimizing Set, Fuzzy
Chen, S.J., and Hwang, C.L. (1992). Fuzzy Multiple Attribute Decision-Making, Springer-Vaerlag, NY.
Choong, P.M., and Sharratt, P.N. (2000). A Holistic Approach to Environmental Issues in Process Development and Design, Inst. Chemical Engineers Symposium Series, 147, 41-54. EI-Halwagi, M.M. and Manousiouthakis, V. (1989). Design and Analysis of Mass-exchange
Networks with Multi Component Targets, American Institute of Chemical Engineering Annual meeting, San Francisco.
EI-Halwagi, M.M. and Manousiouthakis, V. (1990). Simultaneous Synthesis of Mass-exchange and Regeneration Networks, American Institute of Chemical Engineering Journal, 36(8), 1209-1219.
Fava, J., Denison, R., Jones, B., Curran, M.A., Vigon, B., Selke, B., Barnum, J., (1991). A
Technical Framework for Life Cycle Assessment, SETAC North America Office, 1010 North 12th Avenue, Pensacola, FL.
Hernandez, O.R., Pistikopoulos, and Livingston, A.G. (1998). Waste Treatment and Optimal Degree of Pollution Abatement, Environmental Progress, 17(4), 270-276.
Holmstrom, K., and Comer, P. (1999). Risk-based Verification of Green House Gas Emissions
for Emission Reduction and Trading, Det Norske Veritas, Houston, TX.
Khan, F.I., Natrajan, B.R., Revathi, P., (2001). GreenPro: A New Methodology for Cleaner and Greener Process Design, J. of Loss Prevention in the Process Industries, 14, 307-328.
Khan, F.I., Sadiq, R., and Husain, T. (2002). GreenPro-I: A Risk-based Life Cycle Assessment and Decision-making Methodology for Process Plant Design, Environmental Modelling and
Software, 17, 669-692.
Kniel, G.E., Delmarco, K., and Petrie, J.G. (1996). Life Cycle Assessment Applied to Process Design: Environmental and Economic Analysis and Optimization of a Nitric Acid Plant,
Environmental Progress, 15(4), 221-228.
Kohler, N., and Lutzkendorf, T. (2002). Integrated life-cycle analysis, Building Research and
Information, 30(5), 338-348.
Lee, Y. W., Bogardi, I. and Stansbury, J. (1991). Fuzzy Decision-Making in Dredged Material Management, ASCE Journal of Environmental Engineering, 117(5), 614-630.
Mallick, S.K., Cabezas, H., Bare, J.C., and Skidar, S.K. (1996). A Pollution Reduction Methodology for Chemical Process Simulators, Industrial Engineering and Chemical
Research, 35, 4128.
Mann, M.K., and Spath, P.L. (1997). Life Cycle Assessment of a Biomass Gasification
Combined-Cycle System, Report# NREL/TP-430-23076, National Renewable Energy Laboratory, Golden, CO.
Mavrovic, I., Shirley, Jr. A.R., and Coleman (Buck), G.R. (1998). Urea, Kirk-Othmer
Encyclopedia of Chemical Technology, John Wiley & Sons, NY.
Pistkopoulos, E.N., Stefenis, S.K., and Livinhston, A.G., (1994). Pollution Prevention vis Process and Product Modifications, AIChE Symposium Series 303, 140-149.
Pohekar, S.D. and Ramachandran, M. (2004). Application of multi-criteria decision making to sustainable energy planning - A review, Renewable and Sustainable Energy Reviews, 8(4), 365-381.
Roy, A.K., (2001). Why not Coal-based Fertilizer Plants?, EPW Commentary,
http://www.epw.org.in/36-21/comm4.htm (last verified on September 14, 2002).
Saaty, T. L. (1988). Multicriteria Decision-Making: The Analytic Hierarchy Process, University of Pittsburgh, Pittsburgh, PA.
Sadiq R. (2001). Drilling Waste Discharges in the Marine Environment: A Risk-based Decision Methodology, Ph.D. Thesis, St. John's, Memorial University of Newfoundland, Canada. Sadiq R., Husain, T., Veitch, B. and Bose, N., (2003). Risk Management of Drilling Waste
Disposal in the Marine Environment - A Holistic Approach, Oceanic Engineering
International, 7(1), 1-22.
Spath, P.L. and Mann, M.K., (2000). Life Cycle Assessment of a Natural Gas Combined-Cycle
Power Generation System, Report# NREL/TP-570-27715, National Renewable Energy Laboratory, Golden, CO.
Spath, P.L., Mann, M.K., and Kerr, D.R. (1999). Life Cycle Assessment of Coal-Fired Power
Production, Report# NREL/TP-570-25119, National Renewable Energy Laboratory, Golden, CO.
Suh, S., Lenzen, M., Treloar, G. J., Hondo, H., Horvath, A., Huppes, G., Jolliet, O., Klann, U., Krewitt, W., Moriguchi, Y., Munksgaard, J., and Norris, G. (2004). System Boundary
Selection in Life-Cycle Inventories Using Hybrid Approaches, Environmental Science and
Technology, 38(3), 657-664.
Todd, J. A., Curran, M.A. (1999). Streamlined Life Cycle Assessment: A Final Report from the
SETAC North America Streamlined LCA Workgroup, SETAC North America Office, 1010 North 12th Avenue, Pensacola, FL.
Tukker, A. (2000). Life Cycle Assessment as a Tool in Environmental Impact Assessment,
Environmental Impact Assessment Review, 20, 435-456.
USEPA (1995). Life Cycle Assessment: A Conceptual Framework, Key Issues, and Summary of
Existing Methods, EPA/530/R-95/011, Research Triangle park, NC.
Wang, Y., and Smith, R. (1994). Wastewater Minimization, Chemical Engineering Science, 49(7), 981-1006.
Widiyanto, A., Kato, S., and Maruyama, N. (2003). Environmental impact analysis of Indonesian electric generation systems, JSME International Journal, Series B: Fluids and Thermal
Engineering, 46(4), 650-659.
Xiang, D., Liu, X. Wu, Yi. Wang, J., and Duan, G. (2003). Life cycle assessment tool for electromechanical products green design, IEEE International Symposium on Electronics and
the Environment, 120-124.
Young, D.M., and Cabezas, H. (1999). Designing Sustainable Processes with Simulation: The Waste Reduction (WAR) Algorithm. Computer and Chemical Engineering, 23, 1477-1491.
Fuzzy Composite Programming (FCP)
Yes
Selection of a particular process and collection of relevant information
Final design • Weighting of basic attributes • Fuzzification of quantitative or
qualitative indicators
Sensitivity analysis using various weighting schemes Fuzzy Multi-c r iteria Decision-m aking Decision premise Grouping of basic indicators
Fuzzy ranking and decision-making Defining the scope and boundary of the study
Inventory analysis
Risk/impact assessment
• Environmental impacts and burdens • Human health risk
• Ecological risk • Safety related risk
Formulation of design problem
considering risk across the entire boundary of study Risk-base d Li fe Cycle Asses sment Design premise Constraints (e.g.) • Technical • Economic • Regulatory Modify the process or choose another process Identification of alternatives No Is the design acceptable?
Conceptual design (Block diagram) stage
Process selection
Flow sheet stage
Identification of technology and equipments
Detailed design stage
Detailed engineering design of all equipment, instrument, and
accessories Technical constraints • Technical requirement • Operational requirement • Maintenance requirement • Quality requirement Environmental constraints • Offsite requirement • Onsite requirement • Working requirement Regulatory constraints
• Local regulatory requirement
Process Design and Development
• State regulatory requirement • Federal regulatory
requirement
Safety constraints
• On-site safety requirement • Offsite safety requirement
Economic constraints • Economic requirement
• Design of process or product
Defining the objective
0 0.2 0.4 0.6 0.8 1 0 0.2 0.4 0.6 0.8 1 x μ (x) Low
Very Low Medium High Very High
RD SDI EI SI GWPI OD WI AP POI AI HHR ER SR RI CTWM SMD PI EO EF ST CM TFI WC OM CC CI
Level 1 Level 2 Level 3 Level 4 Level 5
WORZi BESZi Si, h (x) a b c d 1.0 Zi, h (x) BES > WOR ⎥ ⎥ ⎥ ⎥ ⎦ ⎤ ⎢ ⎢ ⎢ ⎢ ⎣ ⎡ − − = 0 WORZi BESZi WORZi ) x ( Z 1 ) x ( Si,h i,h WORZi ) x ( Z BESZi ) x ( Z WORZi BESZi Z h , i h , i ) x ( h , i ≥ < < ≥ WORZi BESZi Si, h (x) a b c d 1.0 Zi, h (x) BES < WOR ⎥ ⎥ ⎥ ⎥ ⎦ ⎤ ⎢ ⎢ ⎢ ⎢ ⎣ ⎡ − − = 0 WORZi BESZi WORZi ) x ( Z 1 ) x ( Si,h i,h WORZi ) x ( Z WORZi ) x ( Z BESZi BESZi Z h , i h , i ) x ( h , i ≥ < < ≤
Resource implies fossil fuel, minerals, metals, lime, and water Waste implied air, water and solid emission coming out from the industry
Waste Natural gas production system Natural gas transportation system Energy generation system Waste
Ores mining and purification system Chemical production and transportation system Waste Ammonia production system Air Waste Urea production system Resources CO2 Waste Waste Waste
0.0 0.2 0.4 0.6 0.8 1.0 0.0 0.2 0.4 0.6 0.8 1.0
Risk Reduction Index
Membership function ( μY ) Alt. 1 Alt. 2 Alt. 3 Alt. 4 Ideal point (1.0, 1.0)
0.0 0.2 0.4 0.6 0.8 1.0 0.0 0.2 0.4 0.6 0.8 1.0
System Improvement Index
Membership function ( μY ) Alt. 1 Alt. 2 Alt. 3 Alt. 4 Ideal point (1.0, 1.0)
0.0 0.2 0.4 0.6 0.8 1.0 0.0 0.2 0.4 0.6 0.8 1.0
Cost Saving Index
Environm ental Index (1.0,1.0) Alt. 1 Alt. 2 Alt. 3 Alt. 4 (0.22, 0.41) (0.43, 0.71) (0.53, 0.67) (0.60, 0.71) Alt 4 Alt. 1 Alt. 2 Alt. 3
0.668 0.667 0.668 0.711 0.719 0.714 0.599 0.549 0.575 0.227 0.205 0.217 0.200 0.400 0.600 0.800
Alt. 1 Alt. 2 Alt. 3 Alt. 4
Ut(x)1 Ut(x)2
Ut(x)3
Table 1. Fundamental scale used in AHP (Saaty, 1988)
Intensity of
importance Definition Explanation
1 Equal importance Two activities contribute equally to the objective
2 Weak -
3 Moderate importance Experience and judgement slightly favour one activity over other
4 Moderate plus
-5 Strong importance Experience and judgement strongly favour one activity over other
6 Strong plus
-7 Very strong or demonstrated importance
An activity is favoured very strongly over another; its dominance demonstrated in practice
8 Very, very strong
-9 Extreme importance The evidence favouring one activity over another is of highest possible order of affirmation
Table 2. Percent ccontribution to environmental impacts by urea production life cycle Items Ammonia production Urea production Energy production Natural gas production & trasnport Mining of ores Refining of ores, chemical production & transport RD 35 55 10 GWPI 25 10 30 10 15 10 OD 15 5 45 25 5 5 AP 20 10 20 30 15 5 SMD 15 15 20 30 20 10 CTWM 10 20 20 25 15 10 POI 20 10 30 25 10 5 HHR 25 15 20 20 10 10 SR 30 10 20 25 10 15 ER 15 25 10 20 20 10
Table 3. Percent ccontribution to environmental burden by urea and ammonia plant
Items Hydro-desulfurizing unit Reforming unit CO converter NH 3 reactor Compressor Urea re actor Decomposer NH 3 and CO 2 absorber GWPI 15 35 5 15 10 5 10 5 OD 10 25 10 5 25 10 5 10 AP 25 10 10 15 5 10 10 15 SMD 10 30 20 30 10 CTWM 10 20 25 20 10 15 POI 5 25 5 20 5 10 10 20 HHR 20 10 15 25 5 10 15 SR 10 20 5 30 10 15 5 5 ER 10 5 20 30 5 5 5 20
Table 4. Percent contribution to safety risk (SR) during ammonia and urea production
Items
Hydro-desulfurizing unit Reforming un
it CO converter NH 3 reactor Compressor Urea re actor Decomposer NH 3 & CO 2 absorber
Total safety risk 15 15 5 30 10 15 5 5
Fire risk 60 40 50 30 30 30 30 20
Explosion risk 20 40 30 30 40 20 30 20
Toxic risk 20 20 20 40 30 50 40 60
Table 5. HHR through various exposure routes caused by different chemicals
Natural gas process Naptha process Fuel oil process Coal process Chemicals
Air Water Soil Air Water Soil Air Water Soil Air Water Soil
NH3 35 5 30 5 30 5 25 5 SOx 5 5 5 20 5 5 25 5 5 25 10 5 NOx 5 5 20 5 15 5 20 10 Urea dust 10 30 20 10 25 25 10 25 20 5 20 15 VOCs 20 5 5 5 10 Heavy metal 10 20 40 5 30 45 5 30 50 5 30 40 PM10 10 5 5 5 5 5 5 10 5 5 5 10 Acids 5 25 30 5 25 20 5 20 20 5 20 30
Table 6. The normalised values of the basic indicators for various management alternatives
Alternative 1 Alternative 2 Alternative 3 Alternative 4 Normalised values of basic indicators
Min. MLV Max. Min. MLV Max. Min. MLV Max. Min. MLV Max.
Resource depletion (RD) 0.265 0.642 1.000 0.224 0.606 0.982 0.158 0.552 0.946 0.000 0.427 0.851
Global warming potential (GWPI) 0.490 0.686 0.882 0.294 0.529 0.765 0.686 0.843 1.000 0.000 0.294 0.588
Ozone depletion (OD) 0.698 0.849 1.000 0.698 0.849 1.000 0.698 0.849 1.000 0.000 0.291 0.581
Acidification potential (AP) 0.705 0.853 1.000 0.556 0.734 0.911 0.556 0.734 0.911 0.000 0.290 0.577
Photochemical oxidation (POI) 0.000 0.286 0.571 0.714 0.857 1.000 0.714 0.857 1.000 0.429 0.571 0.714
Human health risk (HHR) 0.500 0.750 1.000 0.500 0.750 1.000 0.333 0.583 0.833 0.000 0.417 0.833
Ecological risk (ER) 0.364 0.682 1.000 0.364 0.682 1.000 0.364 0.682 1.000 0.000 0.409 0.818
Safety risk (SR) 0.000 0.357 0.929 0.179 0.500 0.964 0.286 0.571 0.964 0.357 0.643 1.000
Solid mass disposal (SMD) 0.820 0.910 1.000 0.820 0.910 1.000 0.613 0.747 0.879 0.000 0.256 0.511
Controlled toxic water mass (CTWM) 0.556 0.778 1.000 0.556 0.778 1.000 0.556 0.778 1.000 0.000 0.334 0.666
Ease of operation (EO) 0.600 0.750 0.900 0.300 0.500 0.700 0.100 0.250 0.400 0.100 0.250 0.400
Efficiency (Eff.) 0.600 0.750 0.900 0.600 0.750 0.900 0.300 0.500 0.700 0.000 0.100 0.200
Status of technology (ST) 0.600 0.750 0.900 0.600 0.750 0.900 0.300 0.500 0.700 0.000 0.100 0.200
Control measures (CM) 0.300 0.500 0.700 0.300 0.500 0.700 0.100 0.250 0.400 0.000 0.100 0.200
Working capital (WC) 0.100 0.250 0.400 0.300 0.500 0.700 0.300 0.500 0.700 0.300 0.500 0.700
Operation and maintenance (OM) 0.300 0.500 0.700 0.300 0.500 0.700 0.100 0.250 0.400 0.000 0.100 0.200
Capital investment (CI) 0.300 0.500 0.700 0.100 0.250 0.400 0.300 0.500 0.700 0.100 0.250 0.400
Table 7. Weighting schemes for fuzzy composite programming (FCP) Basic Indicators Level Relative importance w p Groups GWPI 1 1 0.5 OD 1 1 0.5
1 Warming - improvement index (WI)
AP 1 1 0.3
POI 1 2 0.7
1 Acidification - improvement index (AI)
HHR 1 1 0.3
ER 1 4/3 0.4
SR 1 1 0.3
2 Risk reduction index (RI)
SMD 1 1 0.5
CTWM 1 1 0.5
1 Pollution reduction index (PI)
EO 1 1 0.2
Eff. 1 2 0.4
ST 1 1 0.2
CM 1 1 0.2
2 Technical feasibility index (TFI)
WC 1 1 0.3
OM 1 1 0.3
CI 1 4/3 0.4
1 Cost saving index (CI)
WI 2 3/2 0.3
AI 2 1 0.2
RI 2 3/2 0.3
PI 2 1 0.2
1 Sink depletion - improvement index (SDI)
SDI 3 1 0.8
RDI 3 1/4 0.2
1 Environmental - improvement index (EI)
EI 4 1 0.5
TFI 4 2/5 0.2
CI 4 3/5 0.3
Table 8. Ranking of alternatives for trial 1
Alternatives Source Ut(x)1 Rank
1 Natural gas 0.668 2
2 Naptha 0.711 1
3 Fuel oil 0.599 3
4 Coal 0.227 4
Table 9. Weighting scheme for sensitivity analysis
Trials Groups Relative
importance w EI 1 0.5 CI 3/5 0.3 Ut(x)1 (pro-environment) TFI 2/5 0.2 EI 3/5 0.3 CI 1 0.5 Ut(x)2 (pro-cost saving) TFI 2/5 0.2 EI 1 0.4 CI 1 0.4 Ut(x)3 (equal importance to cost saving and environment)