Publisher’s version / Version de l'éditeur:
Proceedings. The 10th Photonics North Conference 2008, 2008
READ THESE TERMS AND CONDITIONS CAREFULLY BEFORE USING THIS WEBSITE.
https://nrc-publications.canada.ca/eng/copyright
Vous avez des questions? Nous pouvons vous aider. Pour communiquer directement avec un auteur, consultez la
première page de la revue dans laquelle son article a été publié afin de trouver ses coordonnées. Si vous n’arrivez pas à les repérer, communiquez avec nous à PublicationsArchive-ArchivesPublications@nrc-cnrc.gc.ca.
Questions? Contact the NRC Publications Archive team at
PublicationsArchive-ArchivesPublications@nrc-cnrc.gc.ca. If you wish to email the authors directly, please see the first page of the publication for their contact information.
NRC Publications Archive
Archives des publications du CNRC
This publication could be one of several versions: author’s original, accepted manuscript or the publisher’s version. / La version de cette publication peut être l’une des suivantes : la version prépublication de l’auteur, la version acceptée du manuscrit ou la version de l’éditeur.
Access and use of this website and the material on it are subject to the Terms and Conditions set forth at
Optical and mechanical challenges in the design of catheterized probes
for intravascular Optical Coherence Tomography Imaging
Dufour, Marc L.; Lamouche, Guy; Hewko, Mark; Vergnole, Sébastien;
Gauthier, Bruno; Padioleau, Christian; De Granpré, Christian; Bisaillon,
Charles-Etienne; Lanthier, Marie Michèle
https://publications-cnrc.canada.ca/fra/droits
L’accès à ce site Web et l’utilisation de son contenu sont assujettis aux conditions présentées dans le site LISEZ CES CONDITIONS ATTENTIVEMENT AVANT D’UTILISER CE SITE WEB.
NRC Publications Record / Notice d'Archives des publications de CNRC:
https://nrc-publications.canada.ca/eng/view/object/?id=ba3ba6a2-db3e-4bd0-884b-b57c36cd3765 https://publications-cnrc.canada.ca/fra/voir/objet/?id=ba3ba6a2-db3e-4bd0-884b-b57c36cd3765
Optical and mechanical challenges in the design of catheterized probes
for intravascular Optical Coherence Tomography Imaging
Marc L. Dufour*
a, Guy Lamouche
a, Mark Hewko
b, Sebastien Vergnole
a, Bruno Gauthier
a,
Christian Padioleau
a, Christian De Grandpré
a, Charles-Etienne Bisaillon
a, Marie Michèle Lanthier
aa
Industrial Material Institute (IMI), National Research Council Canada (NRCC), 75 de Mortagne,
Boucherville, Canada, J4B-6Y4;
bInstitute for Biodiagnostic(IBD), NRCC,
*marc.dufour@cnrc-nrc.gc.ca
ABSTRACT
The Industrial Material Institute (IMI) together with the Institute for Biodiagnostic (IBD) have developed their own optical catheter for cardiovascular imaging applications, such as the monitoring of stent deployment. The design constraints and choices that lead to that result are presented here.
The access to the coronary arteries passes by several curved paths such as the aorta and the tight passage from the aorta to the coronary artery. Inevitably, friction occurs along the catheter. The cumulated torsion force balanced by the varying friction force induces non uniform rotation distortion (NURD) already known from experience with intra-vascular ultrasound (IVUS) catheters.
A two dimensional (2D) coronary artery test bench that simulates the path that gives access to the coronary arteries has been developed. NURD is observed in the test bench using IMI’s cardiovascular Optical Coherence Tomography (OCT) imaging system. A model is presented to help understanding the mechanical constraint that leads to NURD.
Pullback force is measured using an Instron Micro Tester. Results suggest that the pullback force might be used to anticipate NURD observed in the 2D test bench. Thereby, dummy probes with new geometries might be tested for NURD susceptibility without having to fully integrate the optical components.
Keywords: OCT, catheterized probes, NURD, pullback force, coronary artery
1. INTRODUCTION
The first demonstration of OCT as a tool for intravascular imaging was performed in a rabbit aorta and reported in an article published in 1999 [1]. Since then, OCT technology has evolved tremendously in speed and image quality especially with the introduction of fourier domain optical coherence tomography [2]. However, the optical catheters in use today are still more-or-less based on the same basic optical design which includes a grin lens followed by a right angle prism at the distal end of a single-mode optical fiber. Continuous rotation and a pullback are used for cylindrical mapping of the internal structure of an artery.
The optical catheter, nearly one meter and a half in length, rotates within a guiding catheter typically introduced into the vasculature from the femoral artery. The access to the coronary arteries passes by several curved paths such as the aorta and the tight passage from the aorta to the coronary artery. The coronary arteries may also be tortuous. Inevitably, friction occurs along the catheter. The cumulated torsion force balanced by the varying friction force induces non uniform rotation distortion (NURD) already known from experience with intra-vascular ultrasound (IVUS) catheters [3] [4]. NURD is probably inevitable but keeping it within acceptable limits is possible and is a real design challenge.
The optical catheter focusing optics may be designed to have the same diameter as the single-mode optical fiber with its basic protective coating of less than 250 µm.
IMI together with IBD has developed its own optical catheter for cardiovascular applications, such as the monitoring of stent deployment. The design constraints and choices that lead to that result are presented here.
2. OPTICAL DESIGN
2.1 Imaging strategy
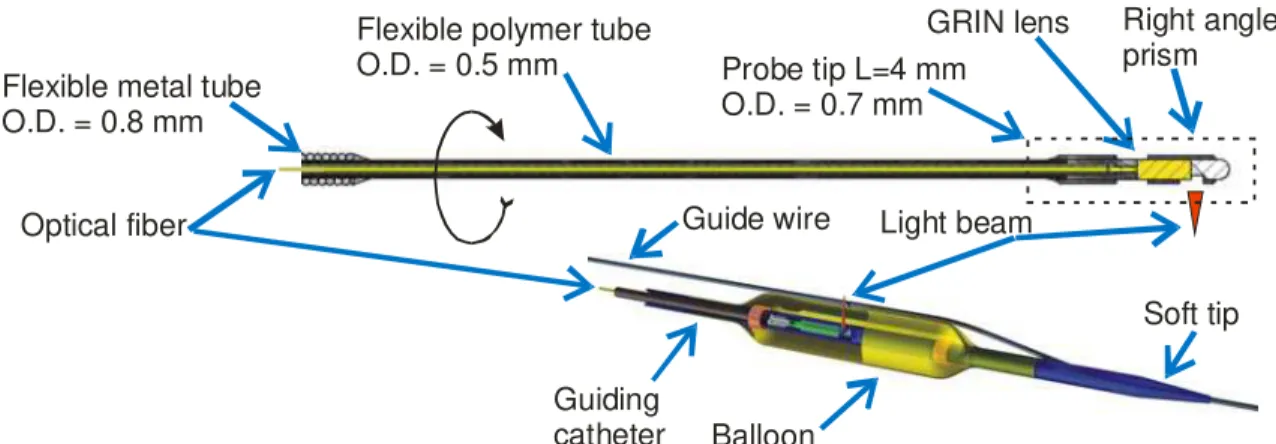
The optical imaging approach used for OCT intravascular imaging is very similar to the one already in use for Intra-Vascular Ultra-Sound (IVUS). An optical probe at the end of an optical fiber, called the optical catheter, is put in rotation inside a static transparent guiding catheter. The probe beam is projected in a perpendicular direction to the rotation axis with the help of a right angle prism, towards the inside surface of the artery. A complete section of the artery is obtained by pulling back the catheter over the desired length and provides a cylindrical mapping of the surface. The optical catheter, the guiding catheter and the compliant balloon developed and made at IMI for OCT imaging of coronary arteries is illustrated in Fig. 1. The outside diameter (O.D.) of the optical catheter is 0.7 mm and the inside diameter (I.D.) of the guiding catheter is 1.0 mm. The system has been used in porcine heart ex-vivo as illustrated in Fig. 2. Optical fiber Balloon Guiding catheter Guide wire Right angle prism GRIN lens
Flexible metal tube O.D. = 0.8 mm
Flexible polymer tube
O.D. = 0.5 mm Probe tip L=4 mm
O.D. = 0.7 mm
Soft tip Light beam
Fig. 1. : Optical catheter (top). Optical catheter inside the guiding catheter (bottom). The optical catheter rotates inside the guiding catheter. Guide-wire Intima Media Adventia Guiding catheter I.D. O.D.
Balloon I.D. O.D.
Fig. 2. Introduction of the guiding catheter inside a coronary artery of a porcine heart obtained from a slaughterhouse (left) and OCT image obtained of a porcine coronary artery using IMI’s intravascular imaging system (right). I.D. stands for inside diameter and O.D. stands for outside diameter.
It has also been used for imaging coronary arteries in an isolated porcine beating heart. The laboratory setup for the isolated porcine beating heart was similar to the one previously used for understanding cardiac tissue oxygenation as a function of blood flow using near-infrared spectroscopy [5].
2.2 Imaging requirements
The coronary arteries have a tapered shape with an internal diameter of 3 to 4 mm in diameter, proximal to aorta. Their length is in the range of 10 cm. The external diameter of the guiding catheter will eventually limit the distance along the
coronary that the OCT imaging probe will be able to reach. The ability of the optical catheter to rotate smoothly while being pulled back into short radius bended path will eventually limit the usability of the OCT imaging system into side-branches. Therefore, the external diameter of the guiding catheter should be smaller than 1.5 mm. The optical catheter should be able to move freely inside the guiding catheter. Its external diameter should then have an external diameter lower than about 0.8 mm.
Blood is opaque to light and must be temporarily displaced. A first option is to use a compliant balloon. Practical lengths for a balloon are in the range of 5 mm to 40 mm. Occlusion time can be up to around 30-40 s [6] [7] but it would be better to target a shorter time. The balloon on top of a guiding catheter makes the assembly less flexible than the guiding catheter alone and more difficult to move into position.
Another option consists in flushing the artery with a transparent saline solution, without occlusion. Practical time limit is of around 4-5 s because of the volume of saline solution that must be injected. For the same reason, the number of repetition must also be controlled during a given period of time. That flushing technique typically requires faster optical scan rate and pullback speed. Yet another option is called flush with occlusion [8] which is an alternative that requires a smaller amount of saline solution for flushing.
2.3 Optical constraints
Penetration of OCT in biological tissues doesn’t go deeper than 2 mm. Fortunately, important features in coronary arteries are found in the first 1mm. Therefore, the probe should be designed to focus 0.5 mm under the surface.
The radius of targeted coronary artery is in the range of 2-3 mm. The probe is often not centered because the balloon inflation is not symmetrical or because the artery curvature pushes the guiding catheter on one side. The distance to the artery inside surface may increase or decrease by up to 1 mm. Therefore, the depth of focus should be over 2mm (for a fixed focal distance). The refractive index of water is 1.3 meaning the optical radius becomes 2.6 mm. Thereby, the focusing range should include geometric distances between 0.75 mm up 2.5 mm in water.
Spot size as small as possible but limited by physical fundamental: trade-off with depth of focus for a given wavelength. 2.4 Evaluation of optical performances
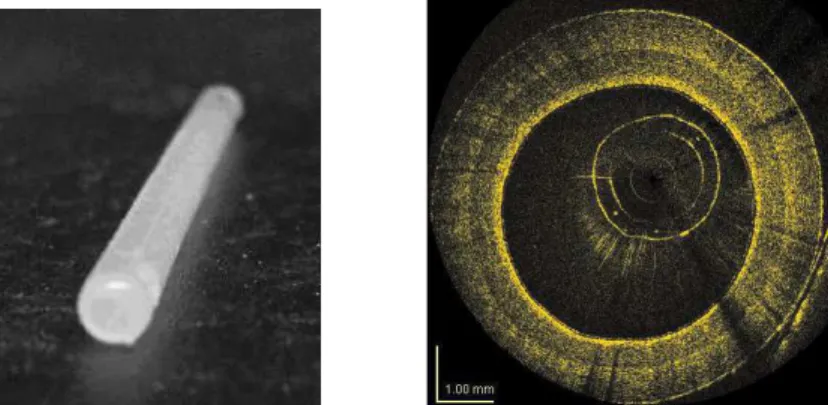
A phantom that mimics the geometry and the optical properties of a coronary artery has been developed[9] [10]. It is made by superposing three layers of silicon charged with different densities of alumina microspheres on a cylindrical mold. The layers are meant to simulate the three layers from the lumen, outward: the intima, the media and the adventia. A typical cylindrical phantom built at IMI and its OCT image are illustrated in Fig. 3.
Fig. 3. Cylindrical shaped multilayer phantom, 3 mm of internal diameter, that mimics the geometry and the optical properties of a coronary artery (left) and the corresponding OCT image obtained with IMI’s OCT intravascular imaging system (right).
The phantoms are used as reference samples for the systematic comparison of the optical performance of new optical catheters that are being developed. Optical catheters that are assembled to be used in a clinical environment can also be tested easily without having to go to the bio-lab.
3. NON UNIFORM ROTATION DISTORTION (NURD)
3.1 NURD in coronary arteries
The mechanical drive provides a very stable rotation speed. After the first second, the probe tip rotates at the same averaged rotation speed but with some instability. The balance between the optical catheter shaft torsion stiffness against the cumulated friction against the guiding catheter is responsible for that instability. This behavior is well documented[3] from past experience with rotating IVUS catheters that have a similar geometry. Friction must be balanced by an equivalent torque from the motor drive. The limited shaft torsion stiffness induced a cumulated torsion delay between the drive and the tip. Any friction variation implies an equivalent motor torque adjustment and implies a proportional cumulated torsion angular delay variation.
The model in Fig. 4 (right) simulates the catheter behavior observed in Fig.4 (left). The model is use to remap the A-scans obtained in cylindrical coordinates from the catheter probe into a Cartesian coordinates image. The model replaces the uniform rotation speed assumption by a map of varying rotation speed while keeping the average speed constant over one full rotation. In this example, the catheter rotates at the same constant speed (relative speed 1x) most of the time. When the friction increases, the speed is reduced to 25% of the normal speed (relative speed 0.25x), thereby increasing the cumulated torsion in the catheter shaft. When the friction comes back to its normal value, the higher torque in the shaft (higher cumulated torsion) induces a speed increase (relative speed 3x) until the normal torque-friction equilibrium is reached. 1x 3x 0.25x Catheter Relative Speed 1x 3x 0.25x Catheter Average speed = 1x
Fig. 4. NURD observed while imaging a coronary artery (left) within a beating heart (middle) and image created using a mathematical model that simulates rotation speed variations (right).
3.2 Probe geometrical considerations
Friction at the probe tip results from the contact of the probe with the guiding catheter in tortuous paths. As illustrated in the model illustrated in Fig. 5. The tip from the optical catheter comes in contact with the guiding catheter on 3 points: the corner at each end Ca, Cb and and the center Cc.
R L Ca Cb Cc d -dt p dt dp
(
)
(
t p)
p td
d
L
d
d
R
−
+
−
=
8
2
2 (1)The bending radius of the guiding catheter at which the 3 points make contact is determined by the rigid length of the probe tip and the difference between the inside diameter of the guiding catheter, dt, and the diameter of the probe, dp. R
is the radius of curvature measured at the center of the guiding catheter. Friction between the probe and the guiding catheter may be tolerated as long as it is constant over a full turn. The probe circular symmetry at those contact points is thus very important.
4. NURD 2D TEST BENCH
4.1 Nurd test bench
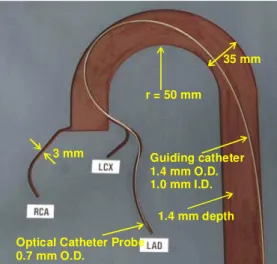
Low-resolution images (http://www.bmb.leeds.ac.uk/illingworth/visible/vismale.htm#current ) from the Visible Human Dataset (http://www.nlm.nih.gov/research/visible/visible_human.html ) supplied by the US National Library of Medicine were used to retrace the three dimensional path that must be followed to access the coronary arteries of a human body through the aorta. With the help of image segmentation algorithm the 3D map of subset of the coronary arteries was obtained. The 3D map was converted to a 2D map by tilting the paths while preserving the radius of curvature of the paths. For the purpose of NURD testing, the 3D curvature may be projected in a single plane as long as the radius of curvature is preserved. The 2D map was then used to groove channels, 1.4 mm deep in a polymer material plate as illustrated in Fig. 6.
1.4 mm depth Guiding catheter 1.4 mm O.D. 1.0 mm I.D.
Optical Catheter Probe 0.7 mm O.D.
35 mm r = 50 mm
3 mm
Fig. 6. Coronary artery 2D model developed at IMI for NURD testing. The aorta, the right coronary artery (RCA), the left anterior descending artery (LAD) and the left circumflex artery (LCx) are grooved in the plate.
4.2 Observation of NURD in the test bench using OCT cardiovascular imaging system
The guiding catheter was manually installed along the grooved paths of the test bench. As it is illustrated in Fig. 6, the distal extremity of the guiding catheter was placed at the end of the LAD branch. The guiding catheter was held in place with the help of acrylic polymer sheets (not shown) simply deposited on the top surface of the test bench. The optical catheter was then inserted inside the guiding catheter up to the distal extremity of the guiding catheter.
The optical catheter was rotated at the rate of 4 turns/s, thereby providing cross-sectional images of the rectangular channels grooved in the test bench. OCT images were then continuously recorded while pulling back the optical catheter at the rate of 2 mm/s for 11 cm. Selected images recorded during the pullback are illustrated in Fig. 7.
Mild NURD may be observed in the first image at 0 mm while the optical catheter is at the distal extremity of the LAD branch. NURD is practically inexistent when the optical catheter moves out of the LAD branch as seen of the last OCT image at 105 mm. However, when the probe tip of the optical catheter passes through the smaller radius curve around 75mm, strong NURD is observed.
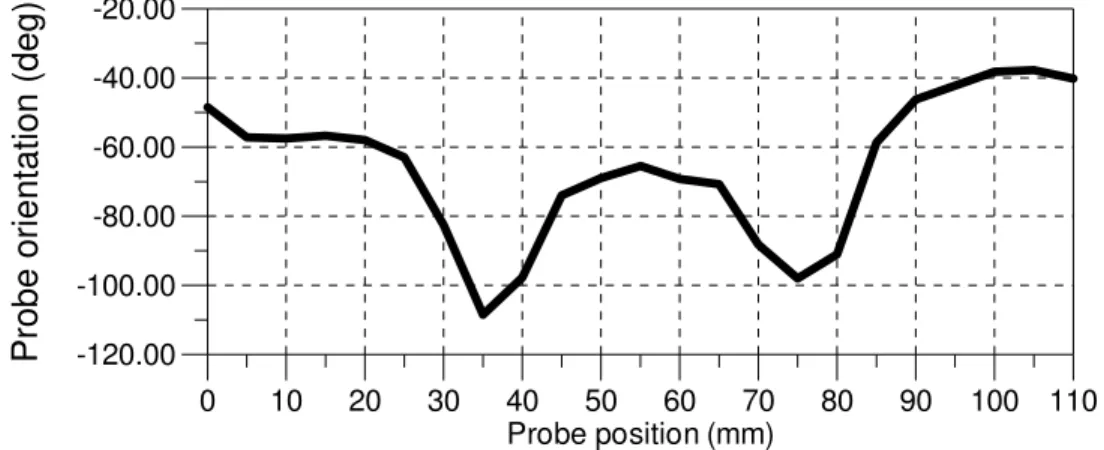
An attempt to evaluate the torque induced by friction may start by measuring the variation of the cumulated torsion of the optical catheter at the probe tip. The angular position of each of the four corner of the rectangular shape of the simulated artery branch may be identified on the OCT images during the pullback. By computing the average of those
values, the graphic in Fig. 8 was obtained. An angular variation peak is observed at a distance of 75 mm which corresponds to the passage of the probe tip in the smallest radius curve.
A torsion peak is also observed when the link with the flexible metal tube, located 40 mm before the probe tip, passes through the same curve. The probe tip is located at 35 mm from the beginning when that occurs. The link is rigid over several millimeters because of the glue and induces more friction in small radius curves.
0 mm 40 mm 20 mm 60 mm 35 mm 75 mm 45 mm 85 mm 75 mm 115 mm 90 mm 130 mm 105 mm 145 mm Probe tip 40 mm Flexible metal tube
Probe Tube
Fig. 7. NURD observed using the OCT intravascular imaging catheter inside the 2D coronary artery model, both developed by IMI and IBD. The optical catheter (top) was rotating at the rate of 4 turns/s inside the guiding catheter and pulled back from the extremity of the LAD branch (middle) along 11 cm at a speed of 2 mm/s OCT images at several locations during the pullback are illustrated (bottom).
-120.00 -100.00 -80.00 -60.00 -40.00 -20.00
P
ro
b
e
o
ri
e
n
ta
ti
o
n
(
d
e
g
)
0 10 20 30 40 50 60 70 80 90 100 110 Probe position (mm)4.3 Pullback force measurement
The force required for inserting or removing an optical catheter inside or from a guiding catheter may be measured using a setup such as the one illustrated in Fig. 9. The measurement was made with an Instron Micro Tester 5548.
In this experiment, the hypothesis to be verified was that the pullback force measurement may be used as a mean to anticipate the rotational friction and resulting NURD amplitude along the artery during a pullback.
Guiding catheter attached to the static arm Optical catheter proximal tip attached to the pulling arm
Catheter entrance into the NURD test bench
NURD test bench
Fig. 9. Setup for measuring the force required for pulling back the optical catheter located inside a guiding catheter from a distal location to a proximal location.
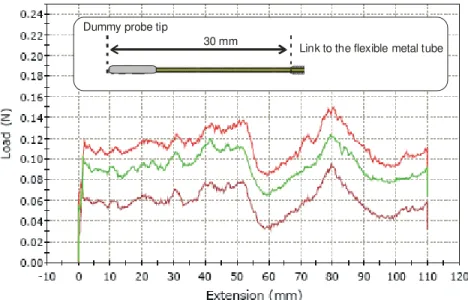
A dummy probe having a similar geometrical shape as the imaging probe previously described was used. The length of the optical catheter, between the probe tip and the metallic tube, was shorter: 30 mm instead of 40 mm.
Dummy probe tip
Link to the flexible metal tube 30 mm
Fig. 10. Force measured while pulling back the dummy optical catheter located inside the LAD branch of the 2D coronary artery model. The three curves in the graph are the signature of three pullback made under the same conditions. The force offset at the origin is induced by static friction.
The pullback force signature is similar to the torsion variation observed by the optical probe measured from OCT images. Two peaks are observed one at 80 mm when the probe tip passes through the small radius curve and the other peak is visible at 50 mm when the link to the flexible metal tube passes to through the same curve. There is a small
location difference for the peak that corresponds to the passage of the link because it was closer to the tip in this particular experiment.
5. CONCLUSIONS
In this paper we have demonstrated that the geometrical context of the heart that is responsible for NURD can be simulated using a simple 2D test bench. Moderate NURD can be simulated with a simple mathematical model. The signature of pullback force measurements may be used to anticipate NURD for a given probe geometry even if the optical elements are not fully integrated.
REFERENCES
1. Fujimoto, J.G., et al., High resolution in vivo intra-arterial imaging with optical coherence tomography. Heart British Cardiac Society, 1999. 82(2): p. 128-33.
2. Tearney, G.J., I.-K. Jang, and B.E. Bouma, Optical coherence tomography for imaging the vulnerable plaque. Journal of Biomedical Optics, 2006. 11(2): p. 021002-10.
3. Kawase, Y., et al., Comparison of nonuniform rotational distortion between mechanical IVUS and OCT using a
phantom model. Ultrasound in Medicine and Biology, 2007. 33(1): p. 67-73.
4. Vogt M, et al., Estimation of 2D displacement and strain field in high frequency ultrasound based
elastography. 2004 IEEE Ultrasonics Symposium IEEE Cat. No.04CH37553. 2004: 376 9 Vol.1, 2005.
5. Nighswander-Rempel, S.P., V.V. Kupriyanov, and R.A. Shaw, Regional cardiac tissue oxygenation as a
function of blood flow and pO2: a near-infrared spectroscopic imaging study. Journal of Biomedical Optics, 2006.
11(5): p. 054004-1 054004-10.
6. Kawase, Y., et al., In vivo volumetric analysis of coronary stent using optical coherence tomography with a
novel balloon occlusion-flushing catheter: A comparison with intravascular ultrasound. Ultrasound in Medicine and
Biology, 2005. 31(10): p. 1343-1349.
7. Yamaguchi, T., et al., Safety and Feasibility of an Intravascular Optical Coherence Tomography Image Wire
System in the Clinical Setting. The American Journal of Cardiology, 2008. 101(5): p. 562-567.
8. Asawa, K., et al., Method analysis for optimal continuous imaging using intravascular optical coherence
tomography. J Cardiol, 2006. 47(3): p. 133-41.
9. Bisaillon, C.-E., et al. Deformable and durable optical phantoms with controlled number of scatterers. in
Design and Performance Validation of Phantoms Used in Conjunction with Optical Measurements of Tissue. 2008. San
Jose, CA: SPIE.
10. Bisaillon, C.E., et al., Deformable and durable phantoms with controlled density of scatterers. Phys. Med. Biol., 2008. To be published.