Publisher’s version / Version de l'éditeur:
Vous avez des questions? Nous pouvons vous aider. Pour communiquer directement avec un auteur, consultez la première page de la revue dans laquelle son article a été publié afin de trouver ses coordonnées. Si vous n’arrivez pas à les repérer, communiquez avec nous à [email protected].
Questions? Contact the NRC Publications Archive team at
[email protected]. If you wish to email the authors directly, please see the first page of the publication for their contact information.
https://publications-cnrc.canada.ca/fra/droits
L’accès à ce site Web et l’utilisation de son contenu sont assujettis aux conditions présentées dans le site
LISEZ CES CONDITIONS ATTENTIVEMENT AVANT D’UTILISER CE SITE WEB.
Research Report (National Research Council of Canada. Institute for Research in
Construction), 2011-09-29
READ THESE TERMS AND CONDITIONS CAREFULLY BEFORE USING THIS WEBSITE.
https://nrc-publications.canada.ca/eng/copyright
NRC Publications Archive Record / Notice des Archives des publications du CNRC :
https://nrc-publications.canada.ca/eng/view/object/?id=6f0730b3-0c57-4f05-95cc-412483c176eb
https://publications-cnrc.canada.ca/fra/voir/objet/?id=6f0730b3-0c57-4f05-95cc-412483c176eb
Archives des publications du CNRC
For the publisher’s version, please access the DOI link below./ Pour consulter la version de l’éditeur, utilisez le lien DOI ci-dessous.
https://doi.org/10.4224/20386697
Access and use of this website and the material on it are subject to the Terms and Conditions set forth at
Evaluating wall-window interface details for risk of condensation on
box and flanged windows
Armstrong, M. M.; Maref, W.; Lacasse, M. A.; Elmahdy, A. H.; Glazer, R.;
Nicholls, M.; Van Den Bossche, N.
Eva lua t ing W a ll- W indow I nt e r f a ce Det a ils
f or Risk of Condensa t ion on Box a nd
Fla nge d W indow s
IRC- RR-319
Armstrong, M.M.; Maref, W.; Lacasse, M.A.; Elmahdy, H.;
Glazer, R.; Nicholls, M.; Van Den Bossche, N.
September 29, 2011
The material in this document is covered by the provisions of the Copyright Act, by Canadian laws, policies, regulations and international agreements. Such provisions serve to identify the information source and, in specific instances, to prohibit reproduction of materials without written permission. For more information visit http://laws.justice.gc.ca/en/showtdm/cs/C-42 Les renseignements dans ce document sont protégés par la Loi sur le droit d'auteur, par les lois, les politiques et les règlements du Canada et des accords internationaux. Ces dispositions permettent d'identifier la source de l'information et, dans certains cas, d'interdire la copie de documents sans permission écrite. Pour obtenir de plus amples renseignements :
Disclaimer
This Project was partially funded by Canada Mortgage and Housing Corporation (CMHC), however the views expressed in this report are those exclusively offered by the National Research Council Canada, Institute for Research in Construction. CMHC assumes no responsibility of any kind in connection to the information provided.
ii
Table of Contents
T
ABLE OFC
ONTENTS………..ii
L
IST OFF
IGURES……….……….vi
L
IST OFT
ABLES……….….xii
A
CKNOWLEDGEMENTS……….……….xiv
E
XECUTIVES
UMMARY……….….………xvi
S
OMMAIRE……….………...xviii
INTRODUCTION ... 1
O
VERVIEW... 1
O
VERVIEW OF STANDARDS... 1
S
IMULATION TOOLS... 3
M
ETHOD FOR DETERMINING CONDENSATION POTENTIAL... 3
APPROACH ... 4
EXPERIMENTAL SET-UP AND PROCEDURES ... 7
C
ONFIGURATION OF TEST SPECIMEN AND MOUNTING SPECIMEN IN TEST ASSEMBLY... 7
I
NSTRUMENTATION ANDD
ATAA
CQUISITION... 12
E
XPERIMENTALP
ROCEDURES... 13
NUMERICAL SIMULATION ... 14
RESULTS AND DISCUSSION ... 15
PART 1 – RESULTS FROM THE BOX WINDOW INSTALLATION... 15
THERMAL SIMULATION OF A BOX WINDOW INSTALLATION ... 15
THERMAL TESTING OF A BOX WINDOW INSTALLATION ... 15
T
EST SET1
(N
O INSULATION) ... 17
No deficiencies – no pressure difference ... 17
Effect of pressure differences ... 19
Effect of deficiencies ... 20
Effect of deficiencies and pressure differences ... 20
T
EST SET2
(G
LASS FIBRE INSULATION) ... 22
Effect of pressure differences ... 22
Effect of deficiencies ... 22
Effect of deficiencies and pressure differences ... 22
T
EST SET3
(S
PRAY-P
OLYURETHANE-F
OAM:
SPF) ... 25
Effect of deficiencies and pressure differences ... 25
DISCUSSION OF RESULTS FROM TESTING THE BOX WINDOW INSTALLATION ... 27
T
EST SET1
–
NO DEFICIENCIES,
NO PRESSURE DIFFERENCE... 27
T
EST SET1
–
NO DEFICIENCIES,
PRESSURE DIFFERENCE... 28
T
EST SET1
–
DEFICIENCIES AND PRESSURE DIFFERENCE... 29
T
EST SET2
(G
LASS FIBER INSULATION)
–
NO DEFICIENCIES,
NO PRESSURE DIFFERENCE... 29
T
EST SET2
(G
LASS FIBER INSULATION)
–
DEFICIENCIES,
PRESSURE DIFFERENCE... 31
C
ONDENSATION RISK ASSESSMENT... 31
C
ONCLUSIONS IN RESPECT TO TESTING A BOX WINDOW INSTALLATION... 32
THERMAL SIMULATION OF A FLANGED WINDOW INSTALLATION ... 33
THERMAL TESTING OF A FLANGED WINDOW INSTALLATION ... 33
T
EST SET4
(N
O INSULATION) ... 33
No deficiencies – no pressure difference ... 33
Effect of pressure differences (No deficiencies) ... 36
Effect of deficiencies ... 36
Effect of deficiencies and pressure differences ... 36
T
EST SET5
(G
LASS FIBRE INSULATION) ... 38
No deficiencies – no pressure difference ... 38
Effect of pressure differences ... 38
Effect of deficiencies ... 40
Effect of deficiencies and pressure differences ... 40
T
EST SET6
(S
PRAY-P
OLYURETHANE-F
OAM:
SPF) ... 42
Effect of deficiencies and pressure differences ... 42
D
ISCUSSION OF RESULTS FROM TESTING THE FLANGED WINDOW INSTALLATION ... 42Discussion Test set 5 (no deficiencies – pressure difference) ... 42
Discussion Test set 5 (no deficiencies – pressure difference) ... 44
C
ONCLUSIONS IN RESPECT TO THERMAL TESTS OF A FLANGED WINDOW INSTALLATION... 44
OVERALL ANALYSIS OF THERMAL TESTS ON BOX AND FLANGED WINDOWS ... 45
W
ITHOUT PRESSURE DIFFERENCE... 46
W
ITH PRESSURE DIFFERENCE... 48
RELATIVE HUMIDITY THRESHOLD FOR CONDENSATION ... 55
CONCLUDING REMARKS ... 63
REFERENCES ... 65
APPENDICES
APPENDIX A:
...
DESCRIPTION OF THE CONSTRUCTION OF WINDOW CONDENSATION POTENTIAL SPECIMEN WALL 1 ... A-1S
UMMARY... A-2
C
ONSTRUCTION DETAILS... A-6
C
ONFIGURATIONS... A-34
Test series 1 – No insulation in the wall-window interface cavity ... A-34 Test series 2 – Glass fibre insulation in the wall-window interface cavity ... A-36 Test series 3 – Polyurethane spray-in-place foam (SPF) insulation in the wall-window interface cavity ... A-38
I
NSTRUMENTATION... A-40
Thermocouples ... A-40 Pressure taps ... A-46 Leakage openings ... A-48
APPENDIX B:
...
DESCRIPTION OF THE CONSTRUCTION OF WINDOW CONDENSATION POTENTIAL SPECIMEN WALL 2 ... B-1S
UMMARY... B-2
C
ONSTRUCTION DETAILS... B-6
C
ONFIGURATIONS... B-20
Test series 1 – No insulation in the wall-window interface cavity ... B-20 Test series 2 – Glass fibre insulation in the wall-window interface cavity ... B-22
iv
Test series 3 – Polyurethane spray-in-place foam (SPF) insulation in the wall-window interface cavity ... B-24
I
NSTRUMENTATION... B-26
Thermocouples ... B-26 Pressure Taps ... B-31 Leakage openings ... B-33
APPENDIX C:EXPERIMENTAL DATA – BOX WINDOWS ... C-1
E
XPERIMENTAL DATA—
B
OX WINDOWS... C-2
APPENDIX D: EXPERIMENTAL DATA – FLANGE WINDOWS...D-1
vi
List of Figures
Figure 1 – Schematic of (a) box and (b) flanged window installation in window opening showing the respective planes of thermal resistance of window in relation to that of nominal wall assembly
... 6
Figure 2 – Nominal test specimen set-up showing size and location of non-operable vinyl window in wood frame assembly ... 8
Figure 3 – Sectional view of (a) box window and (b) flanged window showing location of plane of thermal resistance of window as compared to that of wall ... 9
Figure 4 – Vertical Section of W1 showing installation details for non-operable Fixed – flanged window– vertical line through section indicates plane of thermal resistance of wall ... 10
Figure 5 – Vertical Section of W2 showing installation details for non-operable boxed window – vertical line through section indicates plane of thermal resistance of wall ... 10
Figure 6 – Sectional view of specimen; shows location of deficiency at lower corner of window and alternate leakage path at top of window ... 12
Figure 7 – Nominal location of thermocouples on exterior and interior face of test specimen ... 13
Figure 8– Simulation section box window installation: isothermal lines ... 16
Figure 9 – Simulation section box window installation: heat flux intensity ... 16
Figure 10 – Validation of steady-state simulation of a box window installation ... 16
Figure 11 – Test set 1 (no insulation) Temperatures on the frame, glazing and inside the cavity for different pressure differences and no deficiencies. ... 18
Figure 12 – Test set 1 (no insulation) Values for temperature index on frame, glazing and inside cavity for different pressure differences and no deficiencies ... 18
Figure 13 – IR-scan of test setup Figure 14 – Photograph inside view test setup ... 19
Figure 15 – Test set 1 (no insulation) Surface temperatures when deficiencies are present for different pressure differences acting across specimen ... 21
Figure 16 – Test set 1 (no insulation) Temperature indexes when deficiencies are present for different pressure differences acting across specimen ... 21
Figure 17 – Test set 2 (Glass fibre insulation) Surface temperatures when no deficiencies are present for different pressure differences acting across specimen ... 23
Figure 18 – Test set 2 (Glass fibre insulation) Temperature indexes when no deficiencies are present for different pressure differences acting across specimen ... 23
Figure 19 - Test set 2 (Glass fibre insulation) Surface temperatures with deficiencies present for different pressure differences acting across specimen ... 24
Figure 20 - Test set 2 (Glass fibre insulation) Temperature indexes with deficiencies present for different pressure differences acting across specimen ... 24
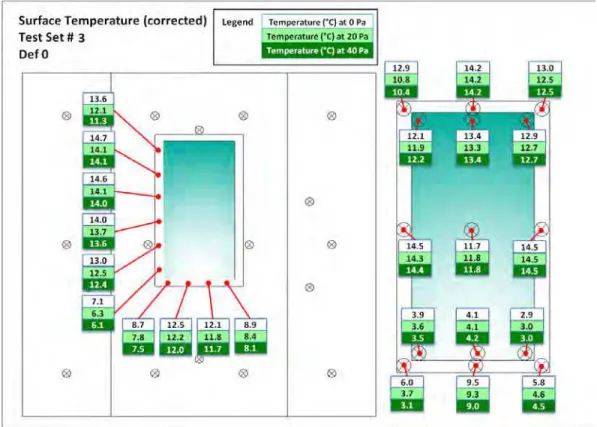
Figure 21 – Test set 3 (SPF) Surface temperatures with no deficiencies present for different pressure differences acting across specimen ... 26
Figure 22 – Test set 3 (SPF) Surface temperatures with deficiencies present for different pressure differences acting across specimen ... 26
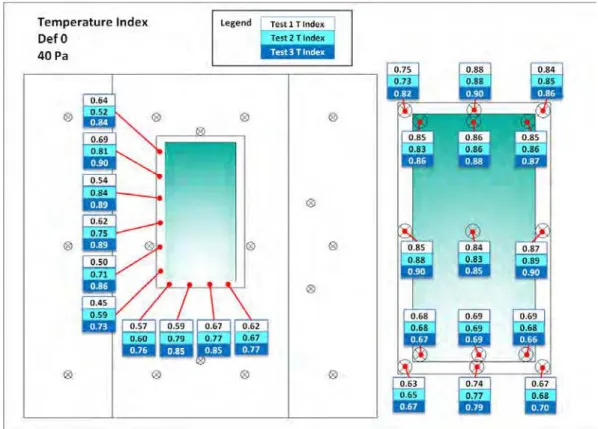
Figure 23 – Temperature indexes at 40Pa without deficiencies for different test sets ... 30
Figure 24 – Temperature indexes at 40Pa with deficiencies for different test sets... 30
Figure 25 – Simulation section flanged window installation: isothermal lines ... 34
Figure 26 – Simulation flanged window installation: heat flux intensity ... 34
Figure 28 – Test set 4 (No insulation) Temperatures on frame and inside cavity without
deficiencies and for different pressure differences ... 35
Figure 29 – Test set 4 (No insulation) Values of temperature index on frame and inside cavity without deficiencies and for different pressure differences ... 35
Figure 30 – Test set 4 (No insulation) Temperatures when deficiencies are present ... 37
Figure 31 – Test set 4 (No insulation) Temperature indexes when deficiencies are present ... 37
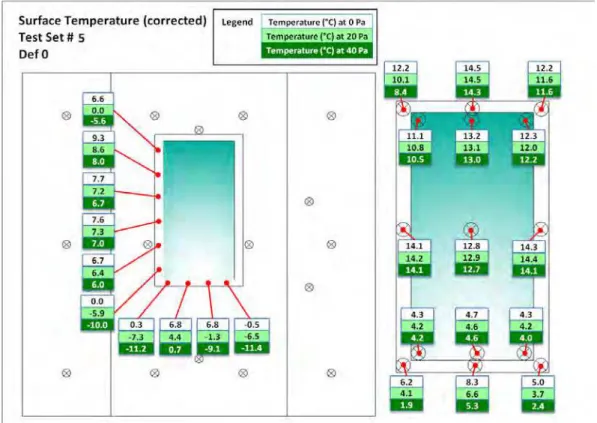
Figure 32 - Test set 5 (Glass fibre insulation) Temperatures on the frame, glazing and inside cavity for different pressure differences and no deficiencies. ... 39
Figure 33 - Test set 5 (Glass fibre insulation) Values of Temperature Index on the frame, glazing, inside cavity for different pressure differences and no deficiencies ... 39
Figure 34 - Test set 5 (Glass fibre insulation) flanged window with deficiencies; Temperatures on frame, glazing and inside cavity for different pressure differences ... 41
Figure 35 - Test set 5 (Glass fibre insulation) flanged window with deficiencies; Temperature Index on frame, glazing, inside cavity for pressure differences ... 41
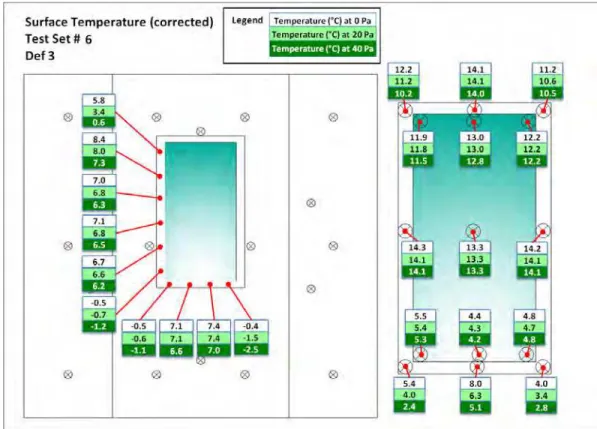
Figure 36 - Test set 6 (SPF) flanged window with deficiencies; Temperatures on frame, glazing and inside cavity for different pressure differences ... 43
Figure 37 - Test set 6 (SPF) flanged window with deficiencies; Temperature Index on frame, glazing, inside cavity for pressure differences ... 43
Figure 38 – Temperature indexes at 40Pa with deficiencies for different test sets; Test 4 is without insulation, Test 5 in with glass fiber insulation and Test 6 is with SPF. ... 44
Figure 39 – Effect of pressure difference when no insulation is installed – mean values... 53
Figure 40 – Effect of pressure difference when glass fiber insulation is installed – mean values .. 53
Figure 41 – Effect of pressure difference when SPF is installed – mean values ... 53
Figure 42 – Effect of pressure difference when no insulation is installed – critical values ... 54
Figure 43 – Effect of pressure difference when fibre insulation is installed – critical values... 54
Figure 44 – Effect of pressure difference when SPF is installed – critical values ... 54
Figure 45 - Relationship between RH threshold for condensation and temperature index ... 55
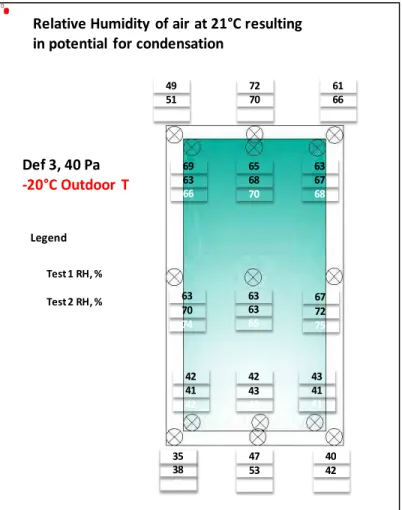
Figure 46 – Relative humidity threshold for condensation, box window, 40 Pa differential pressure, with deficiency, -20°C outdoor temperature, 21°C indoor temperature. ... 56
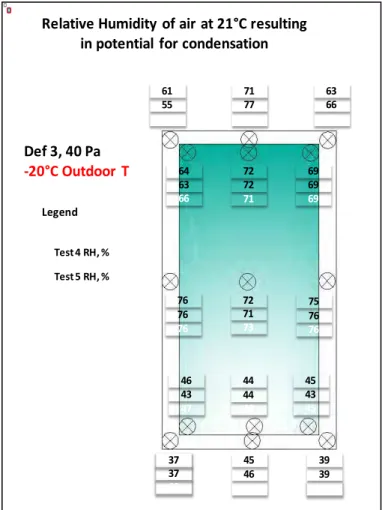
Figure 47 – Relative humidity threshold for condensation, flange window, 40 Pa differential pressure, with deficiency, -20°C outdoor temperature, and 21°C indoor temperature. ... 57
Figure 48 – Comparison of window frame RH threshold for condensation for the box window in neutral position, at 21°C indoor temperature, and -20°C outdoor temperature ... 58
Figure 49 – Comparison of window frame RH threshold for condensation for the flange window, at 21°C indoor temperature, and -20°C outdoor temperature ... 58
Figure 50 – Comparison of window glazing RH threshold for condensation for the box window in neutral position, at 21°C indoor temperature, and -20°C outdoor temperature ... 59
Figure 51 – Comparison of window glazing RH threshold for condensation for the flange window, at 21°C indoor temperature, and -20°C outdoor temperature ... 59
Figure A-1. Vertical Cross Section of Window Condensation Potential Wall 1 (WCP W1) ... A-4 Figure A-2. Horizontal Cross Section at Jamb of Window Condensation Potential Wall 1 (WCP W1) ... A-5 Figure A-3. WCP W1 – 2x6 (38 x 140 mm) framing with 7/16 in. (11 mm) OSB installed. ... A-6 Figure A-4. WCP W1 – Header of rough opening wrapped with Tyvek membrane. ... A-7
viii
Figure A-5. WCP W1 – Rough sill with 6% slope and ½ in. (13 mm) back dam. ... A-7 Figure A-6. WCP W1 – Tyvek WRB installed using I-cut procedure. ... A-8 Figure A-7. WCP W1 – Self-adhered flashing membrane installed over the rough sill, wrapping onto the exterior wall and 6 in. (150 mm) up the jambs. ... A-9 Figure A-8. WCP W1 – WRB wrapped around the jambs, over the sill flashing membrane... A-9 Figure A-9. WCP W1 – View from the interior side, WRB wrapped around the jambs. Stud cavities filled with glass fibre batt insulation. ... A-10 Figure A-10. WCP W1 – Acoustical caulking applied to the WRB in the rough opening at the head and jambs, in preparation for the installation of the poly air/vapour barrier. ... A-11 Figure A-11. WCP W1 – A strip of poly air/vapour barrier sealed to the WRB at the jambs and head of the rough opening. ... A-11 Figure A-12. WCP W1 – Detail of the poly air/vapour barrier strip at the top corner of the rough opening: the poly was pleated in the corners to allow the poly strip to lie flat when folded onto the interior surface of the wall. ... A-12 Figure A-13. WCP W1 - The strip of poly sealed to the WRB in the rough opening using tape. .. A-12 Figure A-14. WCP W1 - The completed rough opening prior to setting the window. ... A-13 Figure A-15. WCP W1 – Window mounted in the rough opening and held in place by mounting clips. ... A-14 Figure A-16. WCP W1 – Window flange nailed in place at the head and jambs. ... A-15 Figure A-17. WCP W1 – Detail of the window flange at the head of the window. The WRB is cut at the head of the window, to allow proper lapping over the flashing layers. ... A-16 Figure A-18. WCP W1 – 4 in. (100 mm) wide self-adhered flashing membrane installed over the window flange at the jambs. ... A-17 Figure A-19. WCP W1 - Detail of the flashing membrane installation at the corner of the sill. .. A-18 Figure A-20. WCP W1 – Aluminium drip cap head flashing. ... A-18 Figure A-21. WCP W1 – End dam detail of the aluminium drip cap head flashing. ... A-19 Figure A-22. WCP W1 – WRB lapped over the drip cap head flashing and taped in place. ... A-19 Figure A-23. WCP W1 - Completed exterior of the wall prior to the installation of the siding.... A-20 Figure A-24. Completed exterior of WCP W1, pictured after testing. Note: the grey modeling clay at the J-trim was added during testing to plug initial attempts at introducing deficiencies. ... A-21 Figure A-25. WCP W1 - Caulking between the J-trim and the window frame. ... A-22 Figure A-26. WCP W1 - Installation of the poly air/vapour barrier on the interior side of the wall assembly. ... A-23 Figure A-27. WCP W1 - Installation of the poly air/vapour barrier on the interior side of the wall assembly. ... A-24 Figure A-28. WCP W1 – Acoustical sealant added to the pleats in the strip of poly. ... A-25 Figure A-29. WCP W1 – Acoustical sealant added to the pleats in the strip of poly. ... A-25 Figure A-30. WCP W1 - Poly air/vapour barrier taped to poly strip at the head and jambs, and to the flashing membrane at the sill. ... A-26 Figure A-31 - WCP W1 – Sill corner detail of the completed poly air/vapour barrier... A-27 Figure A-32. WCP W1 - Completed interior of the wall prior to the installation of instrumentation. ... A-28 Figure A-33. WCP W1 – Drywall installed on the interior of the wall specimen... A-29 Figure A-34 .WCP W1 – Wooden window trim with rubber gasket. ... A-30 Figure A-35 .WCP W1 – Installing the window trim. ... A-31 Figure A-36 .WCP W1 – Window trim installed... A-31
Figure A-37. WCP W1 – Window trim detail at the top left corner - showing clear caulking used to seal cracks between trim pieces. ... A-32 Figure A-38. WCP W1 – Rubber gasket behind the window trim. ... A-32 Figure A-39. WCP W1 - Wall specimen installed in the Guarded Hot Box. ... A-33 Figure A-40 - WCP W1 - Backer rod installed in the gap between the window frame and the rough opening ... A-34 Figure A-41 - WCP W1 – Caulking applied to the backer rod, sealing the gap between the window frame and the rough opening. ... A-34 Figure A-42 - WCP W1 – Completed caulking detail at the sill. ... A-35 Figure A-43. WCP W1 - Completed caulking detail at the head and jambs. ... A-35 Figure A-44. WCP W1 - Glass fibre installed in the gap between the window frame and the rough opening. ... A-36 Figure A-45. WCP W1 - Glass fibre installed in the gap between the window frame and the rough opening. ... A-36 Figure A-46. WCP W1 – Backer rod and caulking applied to seal the window frame to the rough opening. ... A-37 Figure A-47. WCP W1 - Polyurethane spray-in-place foam (SPF) sprayed into the rough opening. (wall shown after testing) ... A-38 Figure A-48. WCP W1 - Polyurethane spray-in-place foam trimmed to the size of the window frame after spraying to make room for the interior window trim. (wall shown after testing) ... A-39 Figure A-49. WCP W1 – Trim installed. (wall shown after testing) ... A-39 Figure A-50. WCP W1 – Mounting a thermocouple in the cavity between the window frame and rough opening. The thermocouple was taped to the window frame. ... A-40 Figure A-51. WCP W1 –Thermocouples in the cavity between the window frame and rough opening. ... A-40 Figure A-52. WCP W1 –Thermocouples in the cavity between the window frame and rough opening. ... A-41 Figure A-53. WCP W1 - Sensor layout, room side wall ... A-42 Figure A-54. WCP W1 - Thermocouples on the inside wall. ... A-43 Figure A-55. WCP W1 - Sensor layout, window glazing and frame... A-44 Figure A-56 - Thermocouples taped into position on the window glazing and frame. ... A-45 Figure A-57. WCP W1 – View from exterior, showing window glazing with thermocouples. ... A-45 Figure A-58. WCP W1 – P1 and P2 pressure tap locations. ... A-46 Figure A-59. WCP W1 - P1 pressure tap. ... A-47 Figure A-60. WCP W1 – P2 pressure tap. ... A-47 Figure A-61. WCP W1 – Opening #1, plugged, located at the exterior bottom left corner of the window. ... A-48 Figure A-62. WCP W1 – Opening #2, plugged (left) and open (right), located at bottom left corner of interior window trim. (Note: Opening #2 not used in final test procedure) ... A-48 Figure A-63. WCP W1 – Opening #3, plugged (left) and open (right), located at top left corner of interior window trim. ... A-49 Figure A-64. WCP W1 – Tube behind Opening #3, to allow air to pass through the caulking and backer rod, and into the cavity between the window frame and rough opening. ... A-49 Figure B-1. Vertical Cross Section of Window Condensation Potential Wall 2 (WCP W2) ... B-4 Figure B-2. Horizontal Cross Section at Jamb of Window Condensation Potential Wall 2 (WCP W2) ... B-5
x
Figure B-3. WCP W2 - 2x6 (38 x 140 mm) wood framing with 2 in. (50 mm) thick piece of XPS on interior side of header. ... B-6 Figure B-4. WCP W2 – OSB installed on interior side of wall. Header detail: 2x6 (38 x 140 mm) wood, OSB, 2x6 (38 x 140 mm) wood and 2 in. (50 mm) thick piece of XPS. ... B-7 Figure B-5. WCP W2 – Piece of WRB (Tyvek) wrapped around window header. ... B-7 Figure B-6. WCP W2 – WRB (Tyvek) installed using I-cut procedure. ... B-8 Figure B-7. WCP W2 - 6% Sloped sill with ¼ in. (6 mm) back dam installed. ... B-9 Figure B-8. WCP W2 - Self-adhered flashing membrane installed on the rough sill, wrapping onto the WRB below the sill, and 6 in. (150 mm) up the jambs. ... B-9 Figure B-9. WCP W2 – WRB wrapped around the jambs, lapping over the sill flashing. ... B-10 Figure B-10. WCP W2 – Strip of poly installed around the interior of the rough opening, at the jambs and head, sealed to the WRB using acoustical sealant. ... B-11 Figure B-11. WCP W2 – Tape seals the strip of poly to the WRB in the rough opening at the head and jambs. ... B-11 Figure B-12. WCP W2 – Box window installed in the rough opening. Beginning of hardboard siding installation. ... B-12 Figure B-13. WCP W2 – Vinyl drip cap flashing (left) cut to produce vinyl flashing strips (right) for use at the jambs and head of the box window. ... B-12 Figure B-14. WCP W2 – Vinyl flashing installed at the jambs and head of the window. ... B-13 Figure B-15. WCP W2 – Vinyl flashing installed at the head and jambs of the box window. The WRB is cut on the diagonal at the top corners of the window, to allow for proper lapping with the vinyl flashing and drip cap flashing (see Figure B-19). ... B-13 Figure B-16. WCP W2 - Flashing detail at the base of the window jamb. ... B-14 Figure B-17. WCP W2 – Two 4 in. (100 mm) strips of self-adhered flashing membrane installed over the vinyl flashing at the jambs ... B-14 Figure B-18. WCP W2 - Aluminium drip cap head flashing with end dams installed at the head of the window... B-15 Figure B-19. WCP W2 – WRB at the head of the window, lapped over the drip cap flashing and taped in place. ... B-15 Figure B-20. WCP W2 - Aluminum sill flashing installed and J-trim installed at the jambs prior to continuing siding installation. ... B-16 Figure B-21 - Detail of aluminium sill flashing and J-trim at bottom right hand corner of the window. ... B-16 Figure B-22. WCP W2 – Hardboard siding installation. ... B-17 Figure B-23. WCP W2 – Detail of siding installation at the drip cap heat flashing, at the top left corner of the window. ... B-17 Figure B-24. WCP W2 - Sealant applied between the vinyl flashing and window frame at the jambs and head, and between the aluminium sill flashing and the window frame. ... B-18 Figure B-25. WCP W2 – Completed exterior of WCP W2. ... B-19 Figure B-26. WCP W2 - Installation of foam backer rod in the gap between the window frame and the rough opening. ... B-20 Figure B-27. WCP W2 – Caulking applied to the back rod, to seal the window frame to the air barrier. ... B-21 Figure B-28. WCP W2 – Caulking applied to the back rod, to seal the window frame to the air barrier. ... B-21
Figure B-29. WCP W2 – Glass fibre insulation installed in the gap between the rough opening and the window frame. ... B-22 Figure B-30. WCP W2 - Glass fibre insulation installed in the gap between the rough opening and the window frame. Backer rod and caulking was then applied over top of the glass fibre
insulation, to seal the window frame to the rough opening. ... B-23 Figure B-31. WCP W2 - SPF sprayed in the gap between the window frame and the rough
opening. ... B-24 Figure B-32. WCP W2 - SPF sprayed in the gap between the window frame and the rough
opening. ... B-25 Figure B-33. WCP W2 - Sensor layout, room side wall (WCP W1 shown) ... B-26 Figure B-34. WCP W2 – Interior side of wall assembly, with thermocouples taped in place. ... B-27 Figure B-35. WCP W2 - Sensor layout – window glazing and frame ... B-28 Figure B-36. WCP W2 - Installation of thermocouples on the window and window frame (weather side shown). ... B-29 Figure B-37. WCP W2 - Installation of thermocouples in the wall-window interface cavity – attached to the underside of the window frame. ... B-29 Figure B-38. WCP W2 - Installation of thermocouples on the window and window frame (weather side shown). ... B-30 Figure B-39. WCP W2 – P1 and P2 pressure tap locations. ... B-31 Figure B-40. WCP W2 - P1 pressure tap. ... B-32 Figure B-41. WCP W2 – P2 pressure tap. ... B-32 Figure B-42. WCP W2 – Opening #1, shown plugged, located at the exterior bottom left corner of the window... B-33 Figure B-43. WCP W2 – Opening #3, shown plugged, located at the top left corner of the interior window trim. (There was no opening at location #2 in WCP W2)... B-34 Figure B-44. WCP W2 – Tube behind Opening #3, to allow air to pass through the caulking and backer rod, and into the cavity between the window frame and rough opening. ... B-34
xii
List of Tables
Table 1 – List of standards for determining condensation potential of windows ... 2
Table 2 – RSI value of wall components and calculation location of plane of thermal insulance of wall ... 8
Table 3 – Test series for boxed window configuration ... 11
Table 4 – Test series for flanged window configuration ... 11
Table 5 – Temperature indexes on the IGU and window frame without pressure difference ... 46
Table 6 – Temperature indexes in the cavity between window frame and wall ... 47
Table 7 – Temperature index for different locations in 6 test setups ... 49
Table 8– Changes in temperature index due to pressure differences and deficiencies ... 50
Table 9 – Changes in temperature index due to installation method ... 51
Table 10 – Relative Humidity Threshold for Condensation for Test 1 (Box window, neutral position, no insulation) ... 60
Table 11 - Relative Humidity Threshold for Condensation for Test 2 (Box window, neutral position, glass fibre batt insulation) ... 61
Table 12 - Relative Humidity Threshold for Condensation for Test 3 (Box window, neutral position, SPF insulation) ... 61
Table 13 - Relative Humidity Threshold for Condensation for Test 4 (Flange window, no insulation) ... 62
Table 14 - Relative Humidity Threshold for Condensation for Test 5 (Flange window, glass fibre batt insulation) ... 62
Table 15 - Relative Humidity Threshold for Condensation for Test 6 (Flange window, SPF insulation) ... 63
Table A-1. Features of Window Condensation Potential Wall 1 ... A-3 Table B-1. Features of Window Condensation Potential Wall 2 ... B-3
xiv
Acknowledgements
The authors wish to thank the Canada Mortgage and Housing Corporation (CMHC) for partial funding of the project and acknowledge the contributions of Mr. Silvio Plescia, Senior Researcher, CMHC to the present contribution.
xvi
Executive Summary
The development of alternative details to manage water intrusion at the wall-window interface has produced a number of novel approaches to detailing the interface between the window and adjacent wall assembly. Many of these approaches advocate the need to provide drainage at the rough opening of the window subsill given that the window components themselves are susceptible to water entry over their expected life. Depending on the types of windows used and the cladding into which the windows are installed, there arise different methods to provide drainage that may also affect air leakage through the assembly. This in turn may give rise to the formation of condensation along the window at the sill or along the window sash and glazing panels. Hence there is a need to determine if, under cold weather conditions, specific interface details that incorporate sill pans provide potential for condensation on the window components in which air leakage paths may be prominent at the sill or elsewhere on the window assembly. The report provides information on a laboratory evaluation of conditions that could result in the formation of condensation at the window frame perimeter of the interface assembly as a function of both temperature deferential and air leakage rate across the test assembly. The laboratory test protocol is provided that includes a description of the test set-up and apparatus, fabrication details of the specimen and information on instrumentation and calibration. The experimental results for flanged and box windows are each discussed in turn. Included in the results is a preliminary analysis based on thermal simulation of the window frame in which experimental results are presented and compared to those obtained from simulation undertaken using a commercially available thermal software.
An outline of the experimental work had previously been prepared as a draft client report to the Canada Mortgage and Housing Corporation (CMHC) and was subsequently published by Lacasse et al. [2009]. Preliminary results derived from the experiments on flanged windows have been submitted for publication to an ASTM E6 conference [Maref et al. 2010].
xviii
Sommaire
Le développement de solutions de rechange en matière de détails de gestion de la pénétration de l’eau aux interfaces mur-fenêtre a donné lieu à un certain nombre d’approches novatrices de la conception des détails de l’interface mur-fenêtre adjacent. Plusieurs de ces approches préconisent la nécessité d’assurer un écoulement à l’ouverture brute de la lisse d’appui étant donné que les composants de fenêtre eux-mêmes sont sujets à la pénétration de l’eau pendant leur durée de vie prévue. Suivant le type de fenêtre qui est employé et le bardage dans lequel celle-ci est installée, différentes méthodes peuvent procurer un drainage de l’eau, susceptible lui-même d’influer sur les fuites d’air à travers l’ensemble. En retour, ceci peut entraîner la formation de condensation le long de la fenêtre, à la lisse d’assise, ou le long du châssis et des panneaux de vitrage. D’où la nécessité de déterminer si, par temps froid, les détails d’interface spécifiques qui font intervenir des bacs d’égouttement procurent un potentiel de condensation sur les composants de fenêtre ou en un autre point de l’ensemble. Ce rapport fournit de l’information sur une évaluation en laboratoire des conditions qui sont propices à la formation de condensation au périmètre du cadre de fenêtre de l’interface en fonction à la fois de la différence de température et du débit de fuite d’air de part et d’autre de l’ensemble d’essai. Le protocole d’essai en laboratoire est également fourni, lequel inclut une description de l’installation et de l’appareil d’essai, les détails de fabrication de l’éprouvette, ainsi que de l’information sur l’instrumentation et l’étalonnage. Les résultats expérimentaux pour fenêtres à bride et fenêtres à caisson sont examinés à tour de rôle. Ces résultats comprennent en outre une analyse préliminaire fondée sur la simulation thermique du cadre de fenêtre, dans laquelle on présente les résultats expérimentaux et on les compare à ceux issus de la simulation. BISCO fut le logiciel de simulation employé. Il s’agit d’un logiciel de simulation thermique offert sur le marché.
Un sommaire de nos travaux expérimentaux avait été préparé antérieurement comme rapport préliminaire présenté au client, soit la Société canadienne d’hypothèques et de logement (SCHL), et fut plus tard publié par Lacasse et coll. [2009]. Les résultats préliminaires découlant des expériences sur fenêtres à bride ont été soumis pour publication lors d’une conférence ASTM E6 [Maref et coll., 2010].
1 INTRODUCTION
1.1 Overview
The development of alternative details to manage water intrusion at the wall-window interface has produced a number of new approaches to detailing the interface between the window and adjacent wall assembly. Many of these approaches advocate the need to provide drainage at the rough opening of the window sill given that the window components are susceptible to water entry over their expected life. Depending on the types of windows used and the cladding into which the windows are installed, there arise different methods to provide drainage that may also affect air leakage through the assembly. This in turn may give rise to the formation of condensation along the window at the sill or along the window sash and glazing panels. Hence there is a need to determine if, under cold weather conditions, specific interface details that incorporate sill pans could result in the formation of condensation on the window components in which air leakage paths may be prominent at the sill or elsewhere on the window assembly.
As will be shown in a subsequent section of the report, several methods have been devised to evaluate the potential for condensation at the window proper; however, there have not yet been any methods specially derived for evaluating the formation of condensation at windows given different window installation details. Such a method would permit determining if a window installation provides adequate thermal resistance and reduced risk to the formation of condensation. It would also permit comparative evaluations amongst different installation methods using the same window and cladding types in a given wall assembly. It may also offer a means to benchmark the results of a field-testing method, should one be developed in the future.
This report provides information on a laboratory evaluation of conditions suitable for the formation of condensation at the window frame perimeter of the interface assembly as a function of both temperature deferential and air leakage rate across the test assembly. A summary of the laboratory test protocol is provided that includes a description of the test set-up and apparatus, fabrication details of the specimen and information on instrumentation of the test specimen and calibration of the sensors. Experimental results for one type of window box and a similar type of flanged window are provided. As well, simulation results are presented and compared to those obtained from the experiments using the thermal software BISCO version 10.0 [Physibel, 2009].
An outline of the experimental work had been previously prepared as a draft client report to the Canada Mortgage and Housing Corporation (CMHC) and was subsequently published by Lacasse et al. [2009]. Preliminary results derived from the experiments on flanged windows have been submitted for publication to an ASTM E6 conference [Maref et al. 2010].
1.2 Overview of standards
There exist several standard methods for determining the potential for the formation of condensation on windows, as provided in Table 1, however the essential aspects of the method were first proposed by Sasaki [1971] and the standardisation work carried out in AAMA [1972; 1998], ASTM [2000] and CSA [2008] follows on these initial efforts. These standards prescribe the overall test protocol, temperatures of the room side and cold side,
Page 2 of 67
and maximum relative humidity under test conditions. A useful overview of these methods is given by Elmahdy [1990].
Table 1 – List of standards for determining condensation potential of windows
Org. Standard designation Room side Temp. (°C) Cold side Temp. (°C)_ Test period Pressure / %RH AAMA AAMA 1502.3 / AAMA 1503-98 21.1 (70°F) -17.8 (0°F) Nil / <15%
ASTM ASTM C1199-00 21.1 (70°F) -17.8 (0°F) Nil / <15% CSA CSA A440.2-04 20 ± 1 -30 ± 1 5h (< 1 °C) 0 ± 5 Pa / <15%
AAMA — The American Architectural Manufacturers Association (AAMA) developed and published a standard for rating windows in terms of a condensation resistance factor (CRF) in 1972 in their standard AAMA 1502.3 [AAMA 1972]. This test method uses thermocouples to measure multiple interior surface temperatures of the frame and glass of standard-sized window specimens. The dimensionless CRF number is then computed based on the ratio of the numerical difference between the average measured inside surface temperature of either the frame or the glass and the cold side air temperature and the difference between the warm side air temperature and the cold side air temperature. Based on these tests, the CRF number is determined for both the glass and the frame.
Since publication of the original standard, several changes have been made [AAMA 1998], and currently the test is conducted with a warm side air temperature of 70°F (21.1°C), a cold side air temperature of 0°F (-17.8°C), a 15 mph (25 km/h) perpendicular air flow on the cold side, a natural convection air flow on the interior, and less than 15 % RH on the warm side [Kudder et al. 2005]. The test is performed without a differential air pressure across the window specimen, which in effect, eliminates air infiltration, and any influence it might have on the thermal and condensation performance of the window. ASTM — The ASTM Subcommittee C16.30 focused on thermal measurement is developing a new standard test method for determining the condensation resistance of fenestration products [ASTM 2000]. The test method specifies the necessary measurements to be made using a “Hot Box Method” for the determination of fenestration system thermal transmittance as described in (Standard Test Method for Measuring the Steady-State Thermal Transmittance of Fenestration Systems Using Hot Box Methods). The condensation resistance is determined for a single set of environmental conditions. Based on the comparative rating of the CR value, the potential for formation of condensation on the interior surfaces of a product under other environmental conditions (ambient temperature conditions and indoor relative humidity) can be assessed. The test method is limited to evaluating and rating the condensation resistance of, residential and commercial windows, doors, curtain wall systems, site-built products, skylights, and other related fenestration products. However, it does not cover the effect of air leakage nor degradation in the performance of fenestration products.
CSA — The CSA A440 Standard describes a method of rating a window’s condensation potential that in most elements is similar to that provided by ASTM and AAMA other than,
as shown in Table 1, the cold side room temperature is –30 °C as compared to ca. –20 °C specified in the other relevant standards. Additionally, the CSA A440.2 refers to the use of NRC’s Calibration Transfer Standard given by Bowen [1988] to calibrate the hotbox.
1.3 Simulation tools
There also exist commercially available simulation tools that could be used to assess the potential for window condensation such as, e.g., FRAME4.0 [Enermodal Engineering 1996], VISION 4.0 [University of Waterloo 1996] and BISCO 10.0 [Physibel, 2009]. Provided details of the window profile are available in the format accessible by the simulation software, such tools permit standard window types to be readily assessed from known boundary conditions and rapid evaluations on the energy efficiency as well as condensation potential are possible. However, such software is not typically adaptable to measuring the performance of window installation in which non-standard conditions and different approaches might be of interest as, for example, where air leakage is considered a testing and evaluation parameter [McGowan 1998]. Such tools nonetheless can prove useful in helping understand the effects of thermal bridging at the wall-window interface as will be evident in later sections of the report.
1.4 Method for determining condensation potential
The essential elements of the method, briefly described, consist of testing a window in a hotbox chamber, measuring the window and frame surface temperatures at specified locations on the window, and calculating an average of the interior surface temperature. The “Temperature index” ( I ) is then determined based on the following relationship provided in the CSA A440.2 Standard [CSA, 2004]::
I = (Ts–To) ÷ (Ti – To) x100………..(1)
where Ti and To are the indoor and outdoor air temperatures in °C, and Ts is the average
room-side surface temperature measured in the test.
For the equation (1) to be expressed as a percent, a slightly modified form of equation (1) was used in accordance with EN ISO 10211:2007:
I = (Ts–To) ÷ (Ti – To) ………(2)
The temperature Index is non-dimensional, and represents the interior surface temperature relative to the interior and exterior air temperatures. I = 0 implies Ts = To,).
When the temperature Index, I = 1, this indicates that Ts = Ti, and is the same as the
room-side air temperature thus providing the best possible rating. In practice I can never be equal to 1 since the heat transfer coefficient of the surface boundary layer and hence the thermal resistance is not infinite. Based on equation (2), I may range between 0 and 1, with a typical value for a clear double-glazed window having a metal frame being ca. I = 0.4. Thus using Equation (2) to predict condensation potential of a given window in a room, the following information is required:
Page 4 of 67 • The I (temperature index) value for the window;
• The indoor room air temperature (Ti) and outdoor temperature (To) at the location
of interest
• The relative humidity or dew point temperature of the room air.
Based on this information, the estimated room-side surface temperature (Ts) can be
determined and thereafter compared to the dew point temperature. If the value of Ts is
less than that of the dew point temperature inside the room then condensation on the window is expected. Furthermore, the use of the temperature indexes offers the opportunity to compare the thermal performance of samples subjected to different boundary conditions. Taking into consideration Fourrier’s law of heat conduction, the linear correlation between heat transfer and temperature difference is evident, and hence the temperature index does not depend on the absolute value of the boundary conditions. However, one should take into account a number of practical limitations when conducting condensation risk assessment:
• In general, reported indoor relative humidities are averaged values at a certain location of a building or a room. Due to the convection pattern in a room small spatial distributions can arise and relative humidities can differ from the average value. • Furthermore, the relative humidity will correlate with related moisture producing
activities in a room, and as such special attention should be paid to e.g. toilets, bathrooms, kitchens and swimming pool areas.
• Insufficient ventilation rates may raise the relative humidity in a room above expected levels, and the control settings of heating systems may also have a serious effect on the indoor temperature and relative humidity.
• In newly constructed buildings higher relative humidities can temporarily be caused by evaporation of moisture out of onsite applied cementitious materials and plasters. • Reported temperature indexes are only valid for a specific heat transfer coefficient,
which assumes the specific location is open to the interior side of the room. By e.g. placing furniture in front of a window, less radiation will heat the surface of the window and frame thereby inducing a higher risk on condensation.
The use of the temperature index is a good indication of the condensation risk assessment, since it depends on given values for indoor and outdoor temperatures and indoor relative humidity. Depending on the nature of the project and the possible consequences of condensation, a safety factor may be applied when a temperature index is determined.
2 APPROACH
The purpose of the test was to obtain surface temperature measurements on specific window component that thereafter permitted determining whether there existed conditions suitable for the formation of condensation given specified interior and exterior conditions. The CSA A440.2 [CSA, 2004] test method for determining condensation potential on windows, as described by Elmahdy [1990], was followed with the following adaptations to the method:
• The pressure difference across the specimen was adjusted to 20 and 40 Pa and at levels in excess of that required in the standard (i.e. 0 ± 5 Pa);
• Steady state conditions were maintained for at least 6 hours (compared to 5 h in the standard);
• Once steady state was achieved, readings were averaged over a period of at least 2 hours;
• Deficiencies were introduced at the wall-window interface.
A guarded hotbox was used to subject a suitable specimen, incorporating a window and related interface details, to temperature differentials specified for the purposes of the test.; a description of the hotbox is provided by Brown et al. [1961].
Details on the experimental procedure, the calibration of the hotbox, specimen instrumentation and data acquisition are provided in subsequent sections.
Given that the primary interest was to determine whether different window installation details affect the potential risk to the formation of condensation on a window, the different issues arising from this relate to the following:
• Selection of type of wood frame assembly and assembly components including size of frame, sheathing board, insulation and window types,
• Location of window in window opening
• Choice of installation details, including, sill pan flashing, other flashing • Incorporation of “deficiencies” in the specimen
A representative wood frame assembly for cold climates would consist of a 6-in wood stud wall, sheathed with an OSB panel and incorporating a polyolefin sheathing membrane, glass fiber insulation, polyethylene vapour barrier, and interior gypsum board finish. In this assembly, fixed (non-operable) PVC windows of two different types were installed: windows incorporating a fixing (installation) flange (i.e. flanged window), and those not having a flange (i.e. box window). PVC windows were selected as these were considered to be the most commonly specified in large commercial housing projects.
For flanged windows, the location of the glazing is fixed in relation to the plane of thermal resistance of the wall whereas in the case of the box window, the variations in installation include having the window installed either in the same plane as the average thermal resistance of the wall (neutral) or installed forward of that plane or some other location that may compromise the overall thermal resistance at the opening.
In regard to installing either the fixed flange or box window in the wall opening, the location of the window in the opening will necessarily affect the overall thermal resistance (RSI-value) at the opening as illustrated in Figure 1a. However, when a window incorporating a fixed flange is installed, as shown in Figure 1b, the location of the plane of thermal resistance is predetermined, based on the location of the flange in relation to the windowpane and window frame. In this instance, the plane of thermal resistance of this window may very well be forward of that of the nominal plane of thermal resistance of the wall.
Page 6 of 67
Figure 1 – Schematic of (a) box and (b) flanged window installation in window opening showing the respective planes of thermal resistance of window in relation to that of nominal wall assembly
As the difference between the locations of these two planes increases, so too does the likelihood for the formation of condensation on the window or frame, for windows installed in cold climates. This is due to the fact that there is less thermal resistance in the cavity between the window and the window opening as compared to the wall proper thus giving rise to decreases in surface temperature of the window or window frame on the interior in relation to the interior room temperature. The continuity of the thermal plane at the window interface with the wall must, in principle, be reconciled; nonetheless, this is limited by the amount of space in which insulation can be applied even though the products typically used have themselves high thermal resistance.
In respect to the choice of installation details, consideration was only given to those details that had in a previous study [Lacasse et al. 2007; Lacasse et al. 2005] demonstrated an ability to adequately manage rainwater entry. Such installation details typically include a sloped sill with sill pan flashing incorporating a back dam.
Finally, given the interest in using installation details that include a sill pan, thought was given to possible paths of air leakage through the assembly at the sill and the type of deficiencies that might arise at these locations due to improper installation of components or premature failure of seal components. Two possible paths were considered: a short path at the sill and another longer path along the interior jamb that enters the room side at the window head.
Summary information is provided in the subsequent section on the configuration of the different test specimens, the window installation and location of the window in the specimen, and the incorporation of deficiencies in the specimens to simulate air leakage problems.
3 EXPERIMENTAL SET-UP AND PROCEDURES
3.1 Configuration of test specimen and mounting specimen in test assembly
Two (2) sets of individual test specimens were prepared: one test specimen having a fixed (non-operable) PVC window (610-mm by 1220-mm) incorporating an integral installation flange (i.e. flanged window), and the other, a box window without a flange; each test set had a single wall-window interface detail. Both installations had the PVC windows centered vertically within the specimen. The nominal size of a single wall-window interface test specimen was 1.22-m (4-ft.) wide by 2.44-m (8-ft.) high and the assembly was framed with 38 by 140-mm (2 by 6-in.) SPF lumber in the configuration shown in Figure 2. The test assembly was intended to be representative of typical North American wood frame construction practice. The exterior cladding of the assembly was hardboard wood composite siding, installed in accordance with current building practice, and directly to the sheathing membrane (spun bonded polyolefin). The membrane overlays an oriented strand board (OSB; 11-mm) sheathing panel affixed over the wood frame. Fibreglass batt type insulation was placed in the stud cavities adjacent to the window opening and the interior finish was gypsum board (12.7-mm).
The location of a flanged window in the window opening, as was previously discussed, is necessarily predetermined by the configuration of the flange in the window frame. However, the location of a box window in the opening can in principle be located in a forward or neutral position or towards the back of the window opening. Given that in this research program there was interest in comparing the differences in condensation potential arising from installing windows at different locations in the opening, consideration was given to determining the location of the plane of thermal resistance of the wall; the plane of thermal resistance of the window was assumed to fall along the center line of the glazing.
Table 2 provides information on the respective values of RSI for each of the relevant wall components from which the location of the plane of thermal resistance was determined; the red line in the table indicates the point at which the cumulative RSI up to the depth indicated for the fibreglass batt (i.e. 2.7-in.) is equal to the remaining portion of the assembly. Figure 3 shows the location of the plane of thermal resistance of the wall in relation to that of a box window installed along the same plane (Figure 3a), and a flanged window (Figure 3b). As shown in the Figure, the respective planes of thermal resistance are displaced in respect to one another and the plane of thermal resistance of the window closer to the exterior of the wall as compared to that of the plane of thermal resistance of the wall.
The installation details incorporated pan flashing, sloped sill, up-stand and related component details that help promote drainage of water from the window sill if subjected to inadvertent water entry, are shown in Figure 4 and Figure 5; information in Figure 4 relates to the installation of a flanged window and that in Figure 5 for a box window installation. A full set of construction details for specimen W1 with flanged window installation are provided in Appendix A, and in Appendix B, a similar set of details for the box window installation (Specimen W2).
Page 8 of 67
Table 2 – RSI value of wall components and calculation location of plane of thermal resistance of wall
Component Thickness m (in.) Thermal resistivity [mK/W] Thermal resistance RSI [m2K/W] Cumulative RSI
Wall-outside air film, 24 km/h --- 0.03 0.030 0.030
Siding - hardboard 0.0111 (7/16) 10.75 0.120 0.150
Sheathing - OSB 0.0111 (7/16) 11 0.122 0.272
Fibreglass Batt 0.0685 (2.695) 26 1.798 2.070
Fibreglass Batt 0.0712 (2.805) 26 1.872 3.942
Drywall 0.0127 (0.5) 6.2 0.079 4.021
Inside Air Film (non reflective, vertical) --- 0.120 0.120 4.141
Total 0.175 (6.871) 4.141
Figure 2 – Nominal test specimen set-up showing size and location of non-operable vinyl window in wood frame assembly
Interior Exterior
a a
Figure 3 – Sectional view of (a) box window and (b) flanged window showing location of plane of thermal resistance of window as compared to that of wall
A summary of the different interface details for either the box or flanged windows are given in Table 3 and Table 4, in which information is provided on the:
• Type of window (box or flanged) and the position of the window in the rough opening; “Position” refers to the position of the window in the rough opening; flange implies that the plane is determined on the basis of where the flange of the window is located in relation to the respective planes of thermal resistance;
• Use, or not, of insulation and the type of insulation used when specified; “Batt” refers to fiber glass batt insulation, whereas the SPF designation indicates that
polyurethane spray-in-place-foam was used in the same cavities located between the window opening and window frame.
• Incorporation, or not, of deficiencies in the assembly; D1 was located at the exterior of the wall-window interface and at the juncture of the cladding and window frame at the lower extreme comer of the window (Figure 6); D3 was located at the interior of the assembly and at the interface between the window frame and the interior finish but located at the upper most corner of the window assembly.
Figure 4 – Vertical Section of W1 showing installation details for non-operable Fixed – flanged window– vertical line through section indicates plane of thermal resistance of wall
Figure 5 – Vertical Section of W2 showing installation details for non-operable boxed window – vertical line through section indicates plane of thermal resistance of wall
Vertical Wall Section Window Condensation W2
1/2 in. Metal Drip cap head flashing
with end dams (32 mil)
Mineral fibre batt Air/Vapour barrier Drywall, 1/2 in. 1 in.
Metal flashing (32 mil) fastened to window
No furring space behind siding Horizontal hardboard siding
Sheathing board, 7/16 in. OSB Self-adhered flashing installed
over sloped rough sill
WRB (Tyvek) wrapped over rough sill Caulking PVC fixed window with flange
Exterior
1/4 in. back dam Sloped sub-sill, 6% slope
Interior
Air/Vapour barrier Piece of WRB (Tyvek)
wrapped into rough opening WRB (Tyvek) lapped over flashing at head
XPS Wood framing (2x6)
Acoustical sealant seals the air/vapour barrier to the WRB Backer rod and sealant connects the air/vapour barrier to the window
Sealant connects the air/vapour barrier to the window
318
Caulking Vinyl flashing 50 mil thick
1 1 2
Vertical Wall Section Window Condensation W1
Acoustical sealant seals the air/vapour barrier to the WRB
1/2 in.
PVC fixed window with flange
Horizontal hardboard siding
Sheathing board, 7/16 in. OSB Self-adhered flashing installed over sloped rough sill 1/8" (3 mm) gap between J-trim and window frame at sill and jambs filled with backer rod and caulking
1 in.
1/2 in. back dam
No furring space behind siding WRB (Tyvek) wrapped over rough sill J-trim
Air/Vapour barrier Mineral fibre batt
Drywall, 1/2 in. Sloped sub-sill, 6% slope
Backer rod and sealant connects the air/vapour barrier to the window
Exterior
Drip cap head flashing with end dams
Tape seals the air/vapour barrier to the the sill flashing
Interior
Piece of WRB (Tyvek) wrapped into rough opening WRB (Tyvek) lapped over flashing at head
Wood framing (2x6)
Air/Vapour barrier Wood framing (2x6) XPS
Backer rod and sealant connects the air/vapour barrier to the window
Table 3 – Test series for boxed window configuration
Boxed installation Test Set 1 Test Set 2 Test Set 3
3.2
Position Neutral Neutral
Insulation type NONE NONE Batt Batt SPF SPF
Presence of Deficiency NO YES NO YES NO YES
Deficiency type / location
3.2.1.1.1
D1+D3 D1+D3
Table 4 – Test series for flanged window configuration
Flanged installation
Test Set 4 Test Set 5 Test Set 6
Position Fixed Fixed Fixed Fixed Fixed Fixed
Insulation type NONE NONE Batt Batt SPF SPF
Presence of Deficiency NO YES NO YES NO YES
Deficiency type / location D1+D3 D1+D3 D1+D3
The introduction of deficiencies at the wall-window interface provides a means to evaluate whether air leakage across different components of the window assembly cause condensation to form on the warm side of the wall assembly when leakage is induced in the test assembly. The intent was to demonstrate the vulnerability of the assembly to the formation of condensation on the interior in instances where, for example, a deficiency is located at the:
• Exterior of the wall-window interface and at the juncture of the cladding and
window frame at the lower extreme comer of the window, as shown in Figure 6
(referred as D1 in Tables 3 and 4);
• Interior of the assembly and at the interface between the window frame and
the interior finish but located at the upper most corner of the window assembly
such that the path for air leakage would extend as shown in Figure 6 (referred as
D3 in Tables 3 and 4);
Page 12 of 67
Figure 6 – Sectional view of specimen; shows location of deficiency at lower corner of window and alternate leakage path at top of window
3.3 Instrumentation and Data Acquisition
Measurement of Temperatures and Relative Humidity — The chamber environmental,
conditions were monitored continuously over the course of a test sequence; likewise surface temperatures on the interior and exterior surface of the window and window frame were measured; the following provides information on accuracy of measurements and the means of capturing data.
Monitoring chamber conditions — Both the temperature and relative humidity (RH) was
continuously monitored over the course of a test sequence in the warm side chamber and only temperature in the cold side chamber. Measurements of temperature in the chamber were made to an accuracy of ± 1.5 °C and that of relative humidity to ± 1 % RH. The data was recorded on the data acquisition system to subsequently be used to ensure that steady state conditions had been maintained over the course of a test sequence.
Monitoring and recording surface temperature conditions — Surface temperature
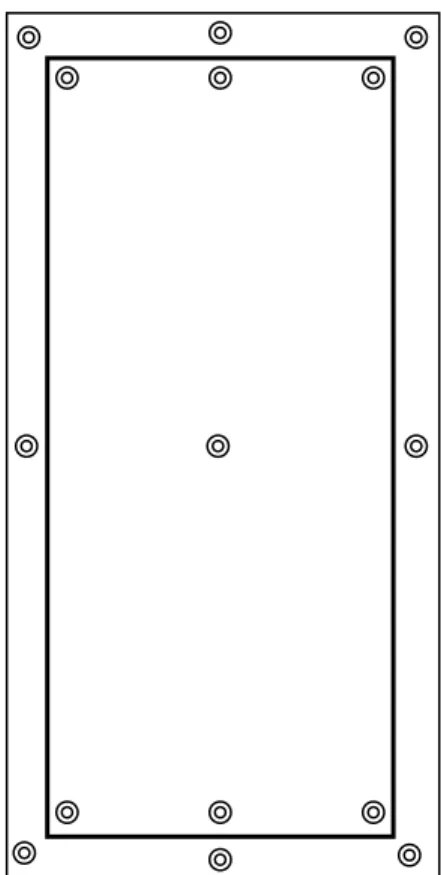
conditions on either side of the window (i.e. exterior and interior) and on specified window components (e.g. window glazing; window frame at sill, frame at jambs, etc.) were continuously monitored with the use of a set of forty 30 thermocouples, 15 were used on the exterior, and 20 on the interior of the specimen. Measurements of temperature were made to an accuracy of ± 0.5 °C. The location of each of these thermocouples is given in Figure 7.
D1
Figure 7 – Nominal location of thermocouples on exterior and interior face of test specimen
In additional to continuous monitoring of surface temperature conditions, an IR camera was used to scan the surface temperature of the window frame. The data was thereafter compared to that provided by the thermocouples. Acquiring an IR scan of the interior of the window requires the use of a baffle to minimize variations in surface conditions that may results from the presence of a camera operator in the warm side room.
Measurement of Pressure Differentials and Airflow — Tests to be carried out under a
pressure differential required that the pressure difference across the test assembly be continuously monitored during the test sequence. A pressure transducer having a 250 Pa range (1-in. water) and accuracy of ± 1 Pa was placed in the warm side chamber. Additionally, a pressure transducer was used to monitor the pressure in the interstitial space between the window frame and window opening. The requirement for a specified pressure differential across the test assembly necessitated the use of an air pump that expelled air from the warm side chamber. The amount of airflow was not monitored; however the flow was adjusted to accommodate the specified pressure differential.
3.4 Experimental Procedures
The basis for this test was determining surface temperatures and from these corresponding values of temperature index sufficient to cause the formation of condensation on window components located on the warm side of the test assembly. Actual visual observation of condensation was not required nor desired as the formation of condensation on thermocouples can affect measurements taken of affected sensors.