READ THESE TERMS AND CONDITIONS CAREFULLY BEFORE USING THIS WEBSITE.
https://nrc-publications.canada.ca/eng/copyright
Vous avez des questions? Nous pouvons vous aider. Pour communiquer directement avec un auteur, consultez la première page de la revue dans laquelle son article a été publié afin de trouver ses coordonnées. Si vous n’arrivez pas à les repérer, communiquez avec nous à PublicationsArchive-ArchivesPublications@nrc-cnrc.gc.ca.
Questions? Contact the NRC Publications Archive team at
PublicationsArchive-ArchivesPublications@nrc-cnrc.gc.ca. If you wish to email the authors directly, please see the first page of the publication for their contact information.
NRC Publications Archive
Archives des publications du CNRC
This publication could be one of several versions: author’s original, accepted manuscript or the publisher’s version. / La version de cette publication peut être l’une des suivantes : la version prépublication de l’auteur, la version acceptée du manuscrit ou la version de l’éditeur.
Access and use of this website and the material on it are subject to the Terms and Conditions set forth at
Hygrothermal simulations of cool reflective and conventional roofs Saber, H. H.; Swinton, M. C.; Kalinger, P.; Paroli, R. M.
https://publications-cnrc.canada.ca/fra/droits
L’accès à ce site Web et l’utilisation de son contenu sont assujettis aux conditions présentées dans le site LISEZ CES CONDITIONS ATTENTIVEMENT AVANT D’UTILISER CE SITE WEB.
NRC Publications Record / Notice d'Archives des publications de CNRC:
https://nrc-publications.canada.ca/eng/view/object/?id=a11a7ddb-f01f-4deb-9552-c6bf2b38420b https://publications-cnrc.canada.ca/fra/voir/objet/?id=a11a7ddb-f01f-4deb-9552-c6bf2b38420b
H ygrot he rm a l sim ula t ions of c ool re fle c t ive a nd c onve nt iona l roofs
N R C C - 5 4 5 1 8
S a b e r , H . H . ; S w i n t o n , M . C . ; K a l i n g e r , P . ; P a r o l i , R . M .
S e p t e m b e r 2 0 1 1
A version of this document is published in / Une version de ce document se trouve dans: Proceedings of the 2011 International Roofing Symposium, Washington, D.C. September 6-9, 2011, pp. 1-28
http://www.nrc-cnrc.gc.ca/irc
The material in this document is covered by the provisions of the Copyright Act, by Canadian laws, policies, regulations and international agreements. Such provisions serve to identify the information source and, in specific instances, to prohibit reproduction of materials without written permission. For more information visit http://laws.justice.gc.ca/en/showtdm/cs/C-42
Les renseignements dans ce document sont protégés par la Loi sur le droit d'auteur, par les lois, les politiques et les règlements du Canada et des accords internationaux. Ces dispositions permettent d'identifier la source de l'information et, dans certains cas, d'interdire la copie de documents sans permission écrite. Pour obtenir de plus amples renseignements : http://lois.justice.gc.ca/fr/showtdm/cs/C-42
Hygrothermal Simulations of Cool Reflective and Conventional Roofs
Hamed H. Saber1, Michael C. Swinton1, Peter Kalinger2 and Ralph M. Paroli1
1 National Research Council Canada, Institute for Research in Construction (NRC-IRC)
Bldg. M-24, 1200 Montreal Road, Ottawa, Ontario, Canada K1A 0R6
2 Canadian Roofing Contractors Association, Ottawa, Ontario, Canada
ABSTRACT
When solar radiation hits a roof surface, a part of solar energy is reflected and part is absorbed. The absorbed part of solar energy results in an increase of the surface temperature of the roof. Cool reflective (white) roofs use bright surfaces to reflect the incident short-wave solar radiation, which lowers the surface temperature compared to conventional (black) roofs with bituminous membrane. As such, white roofs help reduce the urban heat island effect during the summer. The question is “do white roofs lead to moisture-related problems in northern and southern climates?” To answer this question, numerical simulations are conducted to compare the hygrothermal performance of white and black roofs under different outdoor and indoor conditions. The outdoor conditions are obtained from the weather database of the National Research Council of Canada, Institute for Research in Construction (NRC-IRC). The indoor conditions are taken based on European standard (EN 15026) and ASHRAE recommendations for conditioned space. The type of roofs considered in this study are Modified-Bitumen (MOD-BIT) roofing systems. The numerical simulations were conducted using the NRC-IRC’s hygrothermal model called “hygIRC-C”.
INTRODUCTION
Climate change is one of the problems that we currently face. Roofing systems with potential energy savings with no moisture accumulation can help reduce the energy requirements for running buildings, thereby reducing operating costs and contributing to the fight against global warming. Ray and Glicksman [1] developed a thermal model which was used to assess the energy savings of
cool and green roofs. Their results showed that the potential energy savings are highly sensitive to many parameters: roof type, climate and amount of insulation. It is important to design roofing systems that can lead to simultaneously energy savings and low risk of moisture related problems. Moisture accumulation over time, in roofing materials, can damage these materials and reduce the effective thermal resistance of the roofing system, resulting in higher energy costs. Normally, short-wave solar radiation can dry-out the roofing system during the daytime and summer. The amount of short-wave energy absorbed by the roof system depends on the reflectivity of its surface. Because cool (white) roofs have low short-wave solar absorption coefficient, they maintain lower temperatures than dark (black) roofs, and so they may provide less heat to dry-out moisture. This could cause cool roofs to be more susceptible to moisture accumulation when used in cold climates [2]. This phenomenon has been observed in both cool and dark roofs in cold climates [3].
Self-drying roofing systems are designed to avoid moisture accumulation with time in the construction. Under normal operating conditions, condensation shall not occur under the membrane during winter uptake. The construction in these roofing systems is usually sealed to the outside by a membrane that acts as water and vapour barrier. To the inside, no vapour barrier is used in order to allow moisture to dry-out to the interior of the building. Desjarlais [4, 5] conducted extensive studies to investigate the hygrothermal performance of white and black self-drying roofing systems in various US locations.
Bludau et al. [6] conducted hygrothermal simulations to investigate moisture build-up in white and black roofs under different climatic conditions (Phoenix, AZ, Chicago, IL, Anchorage, AK, and Holzkirchen, Germany). The simulations were conducted for 5 years with short-wave solar absorption coefficients of 0.88 for black roofs and 0.2 for white roofs. That study showed that black roofs always run with lower moisture compared to white roofs. In hot climates, like Phoenix there is no risk for this kind of moisture build-up for both white and black roofs. In colder climates,
like Chicago, Anchorage, or Holzkirchen, they found that there is less heat available to dry-out the cool roofs and more opportunities for moisture build-up with time. Bludau et al. [7] investigated the hygrothermal performance of dark, bright and shaded flat roofs with construction moisture where 2 L/m2 of water was added before the roof was sealed from above. In that study, a short-wave solar
absorption coefficient of 0.9 was considered for the dark roof. For the white roof, a measured short-wave solar absorption coefficient of 0.2 was considered; this coefficient can increase to 0.3 with time by ageing and the effect of dust [7]. The dark roofs showed the largest surface temperature and humidity fluctuations, including comparatively high heat fluxes during summer. The surface temperature and drying potential were low in roofs with bright and shaded surfaces.
The objective of this paper is to conduct hygrothermal simulations to investigate the moisture accumulation over time as well as energy use of reflective (cool) and non-reflective (black) Modified-Bitumen (MOD-BIT) roofing systems. These roofs are subjected to different outdoor climates of North America with different Heating Degree Days (HDD), namely: Toronto (Ontario), St John’s (Newfoundland), Saskatoon (Saskatchewan), Seattle (Washington), and Wilmington (North Carolina). The HDD based on degree Celsius (<18oC) for Seattle and Wilmington are 2564 and
1349, respectively [8]. According to the National Building Code of Canada (NBC), the HDD based on degree Celsius for Toronto, St John’s and Saskatoon are 3650, 4800 and 5950, respectively [9]. MODEL DESCRIPTIONS
In this study, the NRC-IRC’s hygrothermal model “hygIRC-C” originally developed for wall systems, was adapted in this project to perform a comparative parametric investigation of the hygrothermal (i.e., heat, air and moisture) performance of reflective and non-reflective roofing systems. This model solves simultaneously the 2D and 3D moisture transport equation, the energy equation, and the air transport equation in the various material layers. The air transport equation is the Navier-Stokes equation for the airspace (e.g. airspace above steel deck, see Figure 1), and Darcy
equation (Darcy number < 10-6) and Brinkman equation (Darcy number > 10-6) for the porous
material layers. According to the roof configuration shown in Figure 1, the 2D version of hygIRC-C model is adequate for conducting the numerical simulations. This model was benchmarked against the hygIRC-2D model that was previously developed at NRC-IRC [10, 11], and test results of different wall systems in a number of projects [12-19].
ROOF DESCRIPTIONS AND ASSUMPTIONS
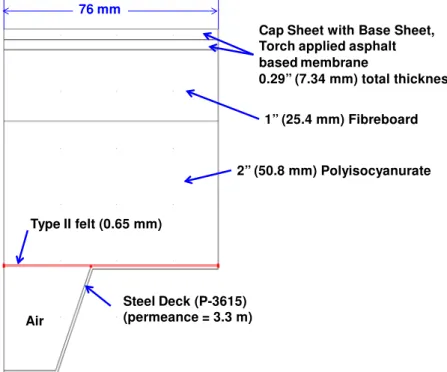
The numerical simulations are conducted for a flat MOD-BIT roofing system (289 mil) shown in Figure 1. Both cap sheet and base sheet (7.34 mm total thickness) were made of torch applied asphalt based membrane. The thermal insulation in this roofing system consisted of a fibreboard (25.4 mm thick), cover board over a rigid polyisocyanurate board (50.8 mm thick). Unlike self-drying roofing systems (e.g. see Desjarlais [4, 5]), a vapour barrier made of bituminous paper, Type II felt (0.65 mm thick) was placed between the polyisocyanurate board and steel deck (P-3615). It was assumed that all material layers shown in Figure 1 are in good contact (i.e. the interfacial resistances due to heat and moisture transport are neglected).
Figure 1. A schematic of MOD-BIT roofing system Steel Deck (P-3615)
(permeance = 3.3 m) Air
2” (50.8 mm) Polyisocyanurate 1” (25.4 mm) Fibreboard Cap Sheet with Base Sheet, Torch applied asphalt based membrane
0.29” (7.34 mm) total thickness
Type II felt (0.65 mm)
The hygrothermal properties of torch applied asphalt based membrane, fibreboard (FB), polyisocyanurate and Type II felt were obtained from the NRC-IRC’s material database [20, 21]. Currently, this database provides the hygrothermal properties of different construction materials as a function of moisture content only (i.e. independent on temperature). However, these properties may change with temperature. For example, Schwartz et al. [22] showed that the measured water vapour permeability of polyurethane and polyisocyanurate foams is constant for temperature < 20oC, but increases linearly for temperature > 20oC. Also, laboratory testing has shown that the
vapour permeance of Ethylene Propylene Diene Monomer (EPDM) membranes increases nonlinearly with temperature for temperature above 32oC [23].
To account for perforations and joints of the steel decking, its vapour permeability was taken to be 3.3 m (5 US perms) [4, 6]. According to Bludau et al. [6], the long-wave emissivity of the external roof surface was taken to be 0.9; and the short-wave solar absorption coefficient of 0.2 and 0.88 were used for white surface and black surface, respectively. Bludau et al. [7] indicated that the short-wave solar absorption coefficient of white surface can increase from 0.2 to 0.3 with time by ageing and the accumulation of dust. In cold climates, there is a possibility for snow accumulation on the top of the roofing system. The snow can affect the long-wave emissivity and short-wave solar absorption coefficient for both white and black roofing systems. Both shading and insulating effects due to snow are not accounted for in the present study.
INITIAL AND BOUNDARY CONDITIONS
In all material layers, the initial moisture content was set to correspond to 50% RH and the temperature was set to 10oC. Due to symmetry, the boundary conditions on the left and right
boundaries of the roofing system (see Figure 1) were adiabatic (no energy transport) and sealed (no moisture and air transport). The top boundary was subjected to outdoor conditions while the bottom boundary was subjected to indoor conditions. The outdoor conditions were based on
hourly weather data and obtained from the NRC-IRC’s weather database for a number of North American cities, namely: Toronto (HDD = 3650), St John’s (HDD = 4800), Saskatoon (HDD = 5950), Seattle (HDD = 2564), and Wilmington (HDD = 1349). To identify the worst case scenario in terms of the hygrothermal performance, numerical simulations were conducted using the weather data of Toronto with two different types of indoor conditions. The first indoor conditions were based on ASHRAE recommendations for conditioned space [24]. The second indoor conditions were based on European standard, EN 15026 [25].
RESULTS AND DISCUSSIONS
In this section, the hygrothermal performances of white and black MOD-BIT roofing systems (see Figure 1) are discussed. These roofing systems are subjected to different outdoor climates. Because the objective of this study is to investigate the moisture accumulation over time within the roofing system, the numerical simulations for different roofing systems were conducted for a period of 5 years. When we observed the moisture accumulation continues to increase over time after 5 years, the period of simulation was extended. In all numerical simulations, the weather data of only one year for each location was used. This weather data was repeated for subsequent years. Also, in all simulations, time = 0 corresponds to January 1st.
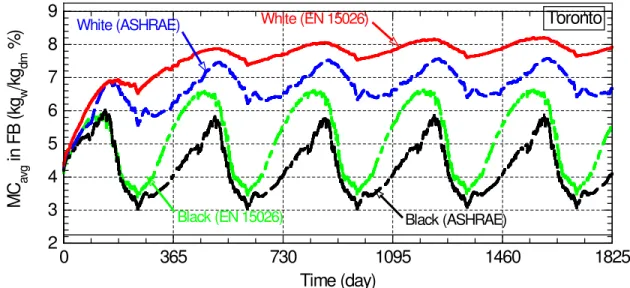
Effect of Indoor Conditions and Roof Colour on the Hygrothermal Performance in Toronto The effect of using different indoor conditions on the hygrothermal performance of black and white roofs was investigated at only one location. For the outdoor climate of Toronto, Figure 2 shows the average moisture content (MCavg) in the Fibreboard (FB), using the indoor conditions of
ASHRAE [24] and EN 15026 [25]. As shown in this figure, the black roof runs with lower moisture compared to the white roof. For the black roof, no moisture accumulation occurs from year to year. In the case of the white roof, moisture accumulation occurs during the first 4 years; however, the highest MCavg in the FB was well below the acceptable limit of 19% according to the National
Building Code of Canada [26]. Thus, the simulation results suggest that there is little risk of moisture damage for a white roof for the outdoor climate of Toronto used in this simulation, providing there is no water leakage through the membrane of the roofing system.
Figure 2. Average moisture content (MCavg) in the fibreboard for white and black MOD-BIT roofs
Figure 2 shows that both white and black roofs run with higher moisture in the case of EN 15026 indoor conditions than in the case of ASHRAE indoor conditions. The MCavg for the white
roof with EN 15026 indoor conditions was 8.0%, which were higher than that with ASHRAE indoor conditions (7.4%). Similarly, the highest MCavg for the black roof with EN 15026 indoor
conditions was 6.6%, which also was higher than that with ASHRAE conditions (5.7%). Thus, the EN 15026 indoor conditions represent the worst case scenario in terms of the hygrothermal performance of the roofing systems. As such, all numerical simulations for black and white roofing systems for other outdoor climates were conducted using the EN 15026 indoor conditions.
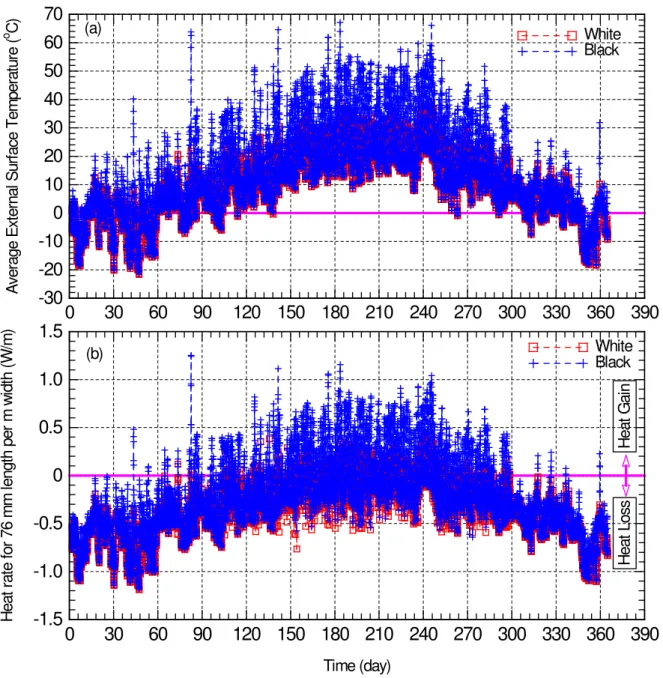
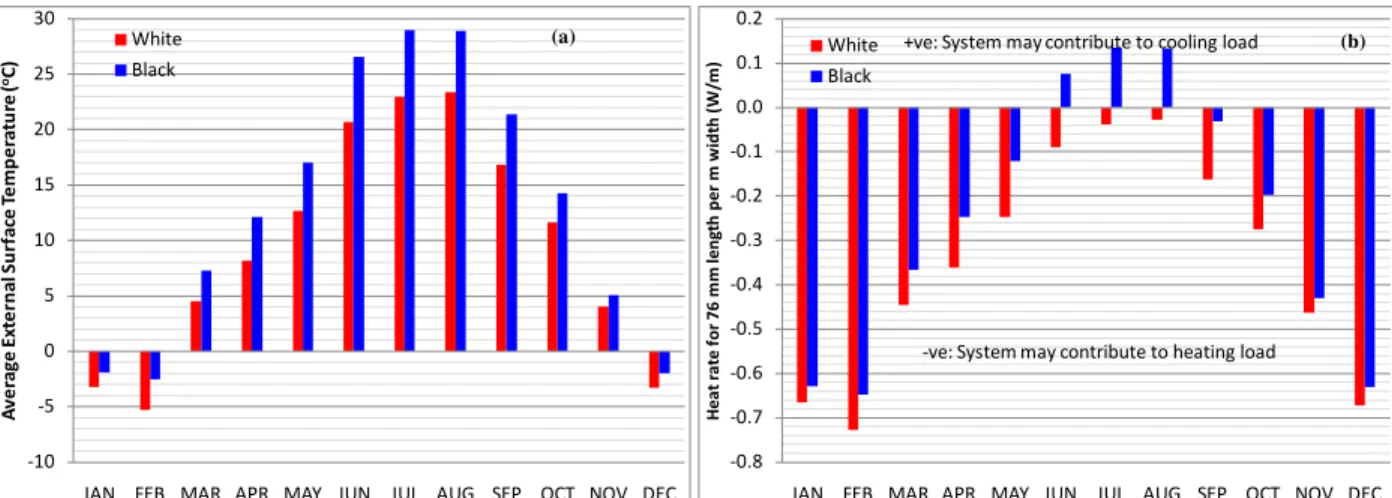
Figure 3a and Figure 4a show comparisons of the hourly and monthly average external surface temperature of white and black roofing systems for the outdoor climate of Toronto. Due to the high short-wave solar absorption coefficient of the black roof (0.88), its surface temperature was found through numerical simulations to be significantly higher than that of the white roof with
2 3 4 5 6 7 8 9 0 365 730 1095 1460 1825 Toronto
Black (EN 15026) Black (ASHRAE)
White (ASHRAE) White (EN 15026)
Time (day) M C a vg in F B ( kg w /k g dm % )
short-wave absorption coefficient of 0.2. The highest surface temperature of the black roof was found to be 67.2oC compared to 38.9oC for the white roof (see Table 1). During nighttime, the
surface temperatures of both black and white roofs were approximately the same. Figure 4a shows that the highest difference between the monthly average surface temperatures of the black and white roofs occurred in July (6.0 K), while the lowest difference between these temperatures occurred in November (1.1 K).
Figure 3. Comparison of hourly external surface temperature and heat gain/loss at the indoor surface of white and black roofing systems for outdoor climate of Toronto
-1.5 -1.0 -0.5 0 0.5 1.0 1.5 0 30 60 90 120 150 180 210 240 270 300 330 360 390 White Black (b) H e a t L o ss H e a t G a in Time (day) H e a t ra te f o r 7 6 m m le n g th p e r m w id th ( W /m ) -30 -20 -10 0 10 20 30 40 50 60 70 0 30 60 90 120 150 180 210 240 270 300 330 360 390 White Black (a) A ve ra g e E xt e rn a l S u rf a ce T e m p e ra tu re ( o C )
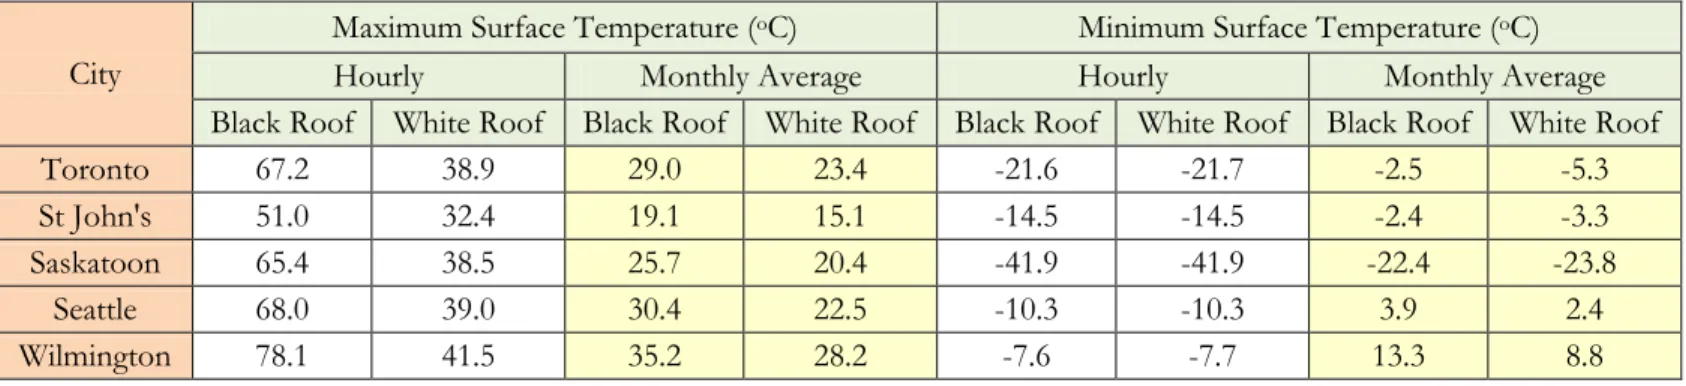
Table 1. Maximum and minimum hourly and monthly average external surface temperature for white and black roofs at different locations
City
Maximum Surface Temperature (oC) Minimum Surface Temperature (oC)
Hourly Monthly Average Hourly Monthly Average
Black Roof White Roof Black Roof White Roof Black Roof White Roof Black Roof White Roof
Toronto 67.2 38.9 29.0 23.4 -21.6 -21.7 -2.5 -5.3
St John's 51.0 32.4 19.1 15.1 -14.5 -14.5 -2.4 -3.3
Saskatoon 65.4 38.5 25.7 20.4 -41.9 -41.9 -22.4 -23.8
Seattle 68.0 39.0 30.4 22.5 -10.3 -10.3 3.9 2.4
Wilmington 78.1 41.5 35.2 28.2 -7.6 -7.7 13.3 8.8
Table 2. Maximum hourly and monthly average heat gain/loss at the indoor surface of white and black roofs at different locations
City
Maximum Heat Gain (W/m) Maximum Heat Loss (W/m)
Hourly Monthly Average Hourly Monthly Average
Black Roof White Roof Black Roof White Roof Black Roof White Roof Black Roof White Roof
Toronto 1.252 0.391 0.135 NA* -1.185 -1.189 -0.647 -0.727
St John's 0.765 0.411 NA* NA* -0.988 -0.988 -0.644 -0.670
Saskatoon 1.187 0.402 0.061 NA* -1.772 -1.772 -1.221 -1.262
Seattle 1.020 0.416 0.187 NA* -0.871 -0.875 -0.462 -0.508
Wilmington 1.509 0.462 0.295 0.092 -0.791 -0.793 -0.217 -0.343
* NA means that the maximum monthly average heat gain showed heat loss instead (see Figure 6).
Table 3. Yearly accumulation of energy gain/loss (in W-day/m) at the indoor surface for each 76 mm length per meter width of black and white roofs at different locations
City Yearly Accumulation of Energy Gain (W-day/m) Yearly Accumulation of Energy Loss (W-day/m)
Black Roof White Roof Black Roof White Roof
Toronto 26.23 4.94 -116.10 -131.87
St John's 6.77 0.52 -146.25 -162.78
Saskatoon 15.42 2.09 -168.12 -188.13
Seattle 30.68 4.48 -82.19 -98.53
Figure 4 Comparison of monthly average external surface temperature and heat gain/loss of white and black roofing systems for outdoor climate of Toronto
Figure 3b and Figure 4b show comparisons of the hourly and monthly average heat rate (in W/m) for 76 mm length per meter width at the indoor surface of white and black roofing systems. In these figures, a zero heat rate represents the case of no heat entering or leaving the building through the roof. Note that when the monthly average heat rate is positive, it is called “heat gain” (i.e. heat into the building where the system may contribute to an increased cooling load). Also, when the monthly average heat rate is negative, it is called “heat loss” (i.e. heat out of the building where the system may contribute to an increased heating load). Due to the higher surface temperature of black roof, its heat gain is significantly higher than that for white roof. During one year, the hourly highest heat gain for the black roof was 1.252 W/m (Table 2), which was about 3.2 times that for white roof (0.391 W/m, Table 2). Furthermore, the highest hourly heat loss of both black and white roofs was approximately the same and occurred during the nighttime (1.185 W/m and 1.189 W/m for black and white roofs, respectively, Table 2).
During the winter, and for a roof with no snow accumulation, lower energy gain due to short-wave solar radiation for the white roof resulted in higher heat loss from the building than that of the black roof (see Figure 4b). Consequently, buildings with white roofs would require more heating load during the winter days than buildings with black roofs, providing there is no snow
-0.8 -0.7 -0.6 -0.5 -0.4 -0.3 -0.2 -0.1 0.0 0.1 0.2
JAN FEB MAR APR MAY JUN JUL AUG SEP OCT NOV DEC
H e a t r a te f o r 7 6 m m le ng th pe r m wi dt h ( W /m ) White Black
+ve: System may contribute to cooling load
-ve: System may contribute to heating load (b) -10 -5 0 5 10 15 20 25 30
JAN FEB MAR APR MAY JUN JUL AUG SEP OCT NOV DEC
A v e ra g e E xt ern a l S u rf a ce T e m p e ra tu re ( oC) White Black (a)
accumulation on the roofing system. For example, in February, the monthly average heat loss for the white roof is 0.73 W/m, which is 12% higher than that of the black roof (0.65 W/m). Conversely, during the summer, low short-wave solar radiation for the white roof resulted in less heat gain into the building compared to that of the black roof. Thus, buildings with white roof in our simulation would require less cooling load in the summer than buildings with our simulated black roofs (Figure 3b). Table 3 shows that the yearly accumulation of energy loss for white roof is 131.87 W-day/m for 76 mm length per meter width, which is 14% higher than that of the black roof. However, the yearly accumulation of energy gain for the black roof is 26.23 W-day/m, which is 5.3 times that of the white roof (4.94 W-day/m). Moreover, as explained above, the average moisture content in the FB for the white roof was well below the acceptable limit of 19% [26]. As a result, the simulations suggest that buildings with white roofs would experience a net yearly energy saving, and would run with slightly higher moisture contents that are nevertheless predicted to be well below 19% for the wood-based elements of the roofing system.
Effect of Roof Colour and Climate on Roof Surface Temperatures
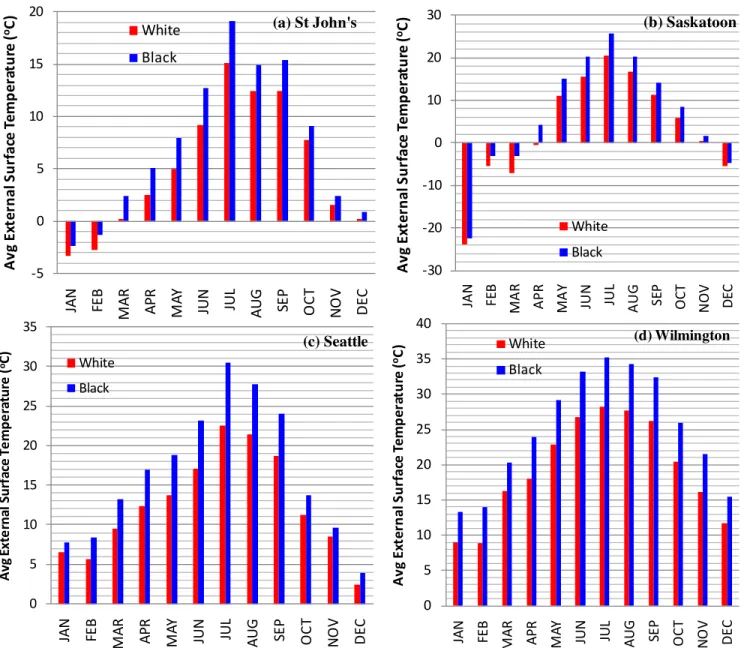
Figure 5 shows the monthly average external surface temperature for white and black roofs at different locations (St John’s, Saskatoon, Seattle and Wilmington). Similar to the outdoor climate of Toronto (see Figure 4a), the highest monthly average surface temperature occurred in July at these locations. The lowest monthly average surface temperature occurred in January at St John’s, Saskatoon and Wilmington, and in December and February at Seattle and Toronto. The lowest monthly average surface temperature was above 0oC at Seattle and Wilmington, but below 0oC at the
other locations.
Table 1 lists the maximum and minimum hourly and monthly average external surface temperature for white and black roofs at different locations. As shown in the table, for a given location, the hourly minimum surface temperatures for both black and white roofs were
approximately the same and they occurred at the night. The outdoor climate of Wilmington showed the highest surface temperature for both black and white roofs, followed by Seattle and Toronto. The maximum hourly and monthly average surface temperatures at Wilmington for the black roof were 78.1oC and 41.5oC, respectively, and 41.5oC and 35.2oC for white roof (see Table 1). For both
black and white roofs, the outdoor climate of St John’s showed the lowest surface temperature during the summer and the outdoor climate of Saskatoon showed the lowest surface temperature
Figure 5. Comparison of monthly average external surface temperature of white and black roofing systems at different locations
-30 -20 -10 0 10 20 30 JA N F E B MA R A P R MA Y JU N JU L AU G S E P O CT N OV DEC A v g E xt er n a l S u rf a ce T em p er at u re ( oC) White Black (b) Saskatoon 0 5 10 15 20 25 30 35 JA N FE B M A R
APR MAY JUN JUL AUG SE
P OC T N O V DE C A v g E x ter n a l S u rf a ce T em p er a tu re ( oC) White Black (c) Seattle 0 5 10 15 20 25 30 35 40 JA N FE B M A R
APR MAY JUN JUL AUG SE
P OC T N O V DE C A v g E xt er n a l S u rf a ce T em p er at u re ( oC) White Black (d) Wilmington -5 0 5 10 15 20 JA N FE B M A R
APR MAY JUN JUL AUG SE
P OC T N O V DE C A v g E xt er n a l S u rf a ce T em p er at u re ( oC) White Black (a) St John's
during the winter. Consequently, it would be expected that both black and white roofs would function with higher moisture at St John’s and Saskatoon compared to the other locations, and this was confirmed with hygrothermal results as discussed later.
Effect of Roof Colour and Climate on Heat Gain/Loss
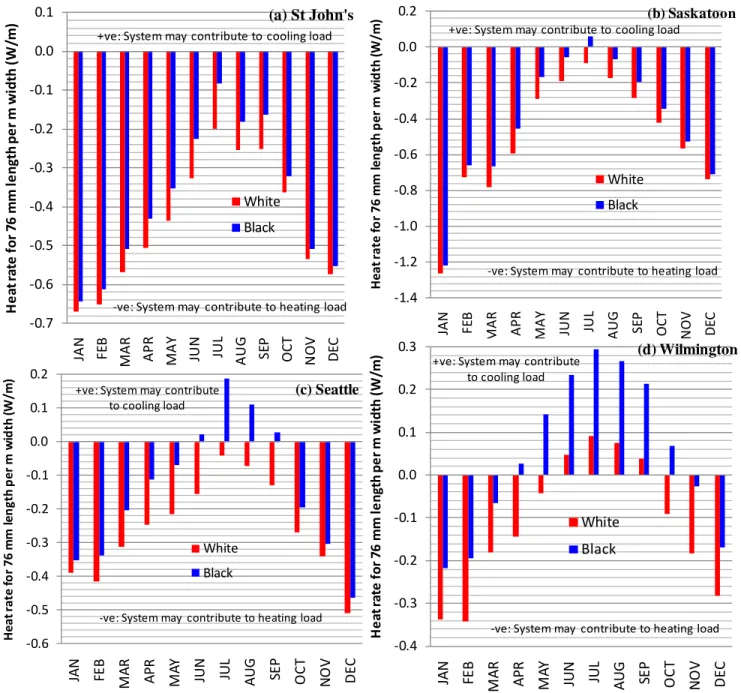
Figure 6 compares the monthly average heat gain and heat loss at the indoor surface of white and black roofing systems at different locations. Also, Table 2 lists the maximum hourly and monthly average heat gain and heat loss at the indoor surface for white and black roofs at different locations. For black roofs, the climate of Wilmington resulted in the highest maximum hourly heat gain (1.509 W/m), followed by Toronto (1.252 W/m); while the climate of St John’s resulted in the lowest value (0.765 W/m). For white roofs, the climate of Wilmington showed the highest maximum hourly heat gain (0.462 W/m), followed by Seattle (0.416 W/m). In terms of the maximum monthly average heat gain for black roofs, the highest value occurred at Wilmington, followed by Seattle. For white roofs, the only outdoor climate that showed a monthly average heat gain was Wilmington (Table 2). In general, all outdoor climates investigated in this paper showed that black roofs experience lower heating loads than white roofs.
For the outdoor climate of St John’s, Figure 6a shows that there is no monthly average heat gain (i.e. net heat into the building) during the whole year, not only for the white roof, but also for the black roof. Also, as will be explained in the next subsection (see Figure 7 and Figure 8), the black roof functions with much lower moisture compared to the white roof in St John’s. As a result, for energy savings with low risk of moisture damage, buildings with black roofs are recommended for the outdoor climate of St John’s. For the same reasons, buildings with black roofs are also recommended in the outdoor climate of Saskatoon, since there is only one month during the year (July) when a relatively small amount of monthly average heat gain occurs (0.061 W/m) (see Figure 6b and Table 2).
Figure 6. Comparison of monthly average heat gain/loss at the indoor surface of white and black roofing systems at different locations
Similar to Toronto, Figure 6c shows that there is no monthly average heat gain for the white roof during the whole year for outdoor climate of Seattle. For the black roof, however, there is monthly average heat gain during four months (June, July, August and September), resulting in an increased cooling load during these months. During the winter, the highest monthly average heat loss for the white roof occurred in December (0.508 W/m, Table 2). However, the heat loss is
-0.7 -0.6 -0.5 -0.4 -0.3 -0.2 -0.1 0.0 0.1 JA N F E B MA R A P R MA Y JU N JU L AU G S E P O CT N OV DEC H e a t ra te f o r 7 6 mm l e n g th p e r m w id th ( W /m) White Black
+ve: System may contribute to cooling load
-ve: System may contribute to heating load
(a) St John's -1.4 -1.2 -1.0 -0.8 -0.6 -0.4 -0.2 0.0 0.2 JA N F E B MA R A P R MA Y JU N JU L AU G S E P O CT N OV DEC H e a t ra te f o r 7 6 m m l e n g th p e r m w id th (W /m ) White Black
+ve: System may contribute to cooling load
-ve: System may contribute to heating load
(b) Saskatoon -0.6 -0.5 -0.4 -0.3 -0.2 -0.1 0.0 0.1 0.2 JA N FE B M A R
APR MAY JUN JUL AUG SE
P OC T N O V DE C H e a t ra te f o r 7 6 m m l e n g th p e r m w id th (W /m ) White Black
+ve: System may contribute to cooling load
-ve: System may contribute to heating load
(c) Seattle -0.4 -0.3 -0.2 -0.1 0.0 0.1 0.2 0.3 JA N FE B M A R
APR MAY JUN JUL AUG SEP OC
T N O V DE C H e a t ra te f o r 7 6 mm l e n g th p e r m w id th ( W /m) White Black
+ve: System may contribute to cooling load
-ve: System may contribute to heating load
~10% higher than that of the black roof (0.462 W/m, Table 2). Table 3 shows that the yearly accumulation of energy gain for the black roof was 30.68 W-day/m for 76 mm length per meter width, which is about 6.8 times that of the white roof (4.48 W-day/m). Furthermore, the yearly accumulation of energy loss for the white roof was 98.53 W-day/m, which is 20% higher than that of the black roof (82.19 W-day/m). Figure 7, and Figure 8 show that both white and black roofs function with low moisture (moisture content in FB was well below the acceptable limit of 19% [26]). Therefore, buildings with white roofs would be expected to experience a net yearly energy savings, and function with a low risk of moisture damage.
Figure 7. Comparison of average moisture content in the fibreboard (FB) for black MOD-BIT roofing systems at different locations
Unlike other locations, the outdoor climate of Wilmington resulted in a non-zero monthly average heat gain for both black and white roofs during the summer (see Figure 6d). Also, Figure 7, and Figure 8 show that both white and black roofs function with very low moisture (moisture content in FB was well below the acceptable limit of 19% [26]). Table 3 shows that the yearly accumulated energy gain for the black roof was 61.82 W-day/m, which is about 4.2 times that of the white roof (14.89 W-day/m). However, the yearly accumulation of energy loss for the white roof was 55.93 W-day/m, which is 26% higher than that for the black roof (44.41 W-day/m).
2 3 4 5 6 7 8 9 0 365 730 1095 1460 1825 2190 2555 Wilmington Seattle St John's Saskatoon Toronto Time (day) M C a vg in F B ( kg w /k g dm % )
Consequently, buildings with white roofs would experience a net yearly energy savings compared to with black roofs in the outdoor climate of Wilmington.
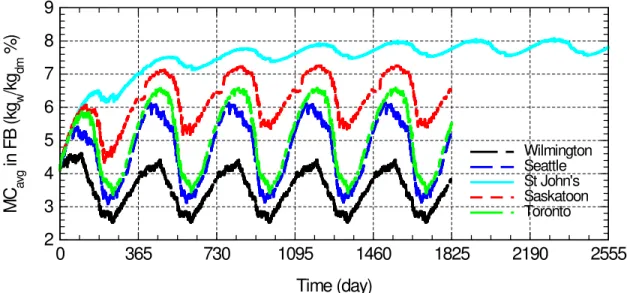
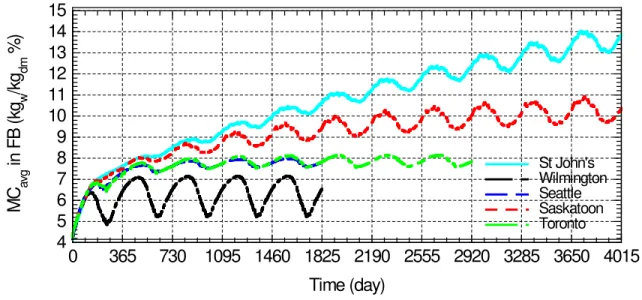
Figure 8. Comparison of average and moisture content in the fibreboard (FB) for white MOD-BIT roofing systems at different locations
Effect of Outdoor Conditions and Roof Colour on Moisture Accumulation
Figure 7 and Figure 8 show the average moisture content (MCavg) in the fibreboard (FB) for
black and white roofs, respectively, at different locations. Also, Figure 9a and Figure 9b show the moisture content of the upper surface of the FB (MC), beneath the membrane, in these roofing systems. As shown in these figures, the outdoor climate of St John’s resulted in the highest moisture content in the FB for both black and white roofs, followed by the outdoor climate of Saskatoon; while the outdoor climate of Wilmington resulted in the lowest moisture content. For black roofs, no moisture accumulation occurred after 2 years in outdoor climates of Wilmington, Seattle and Toronto, and after 4 years and 6 years for Saskatoon and St John’s. Additionally, the highest MC and MCavg in the FB for different outdoor climates were below the acceptable limit of 19% (Figure 7
and Figure 9a). As such, the simulations suggest that the modelled black roof would run with a low risk of moisture damage at the different locations investigated in this paper.
4 5 6 7 8 9 10 11 12 13 14 15 0 365 730 1095 1460 1825 2190 2555 2920 3285 3650 4015 St John's Wilmington Seattle Saskatoon Toronto Time (day) M C a vg in F B ( kg w /k g dm % )
Figure 9. Moisture content (MC) of the upper surface of fiberboard (beneath the membrane) at different locations
In the case of the white roofs, Figure 8 and Figure 9b show that no moisture accumulation with time occurred after 3 years, 4 years and 5 years in the outdoor climates of Wilmington, Seattle and Toronto, respectively. Furthermore, the highest MC and MCavg in the FB for these outdoor
climates were below the acceptable limit of 19% [26]. Thus, the model predicts that white roofs have a low risk of moisture damage in these locations. However, the outdoor climates of St John’s and Saskatoon resulted in significant moisture accumulation over time (see Figure 8 and Figure 9b).
1 4 7 10 13 16 19 22 25 28 31 34 37 40 0 365 730 1095 1460 1825 2190 2555 2920 3285 3650 4015 St John's Saskatoon Toronto Seattle Wilmington 19% MC (b) White Roof Time (day) M C o f th e U p p e r S u rf a ce o f F B ( kg w /k g dm % ) 1 4 7 10 13 16 19 22 0 365 730 1095 1460 1825 2190 2555 St John's Saskatoon Toronto Seattle Wilmington 19% MC
(a) Black Roof
M C o f th e U p p e r S u rf a ce o f F B ( kg w /k g dm % )
For example, after 11 years, the highest MCavg reached 14.1% and 10.8% in St. John’s and Saskatoon,
respectively. Figure 9b shows that the moisture content of the upper surface of FB exceeded the acceptable limit of 19% (reached 35.4% and 29.8% in St John’s and Saskatoon, respectively). Therefore, the model predicts that white roofs would function with a high risk of moisture damage in the outdoor climates of St John’s and Saskatoon.
SUMMARY AND CONCLUSIONS
Numerical simulations were conducted using the NRC-IRC’s hygrothermal model “hygIRC-C”, to investigate the hygrothermal performance of white and black roofing systems. The roofs considered in this study were reflective (white) and non-reflective (black) Modified-Bitumen (MOD-BIT) roofing systems. These roofs were subjected to different climates of North America with different Heating Degree days (HDD), namely: Toronto (HDD = 3650), St John’s (HDD = 4800), Saskatoon (HDD = 5950), Seattle (HDD = 2564), and Wilmington (HDD = 1349). Numerical simulations were conducted using the two indoor conditions of ASHRAE and European standard (EN 15026), for the outdoor conditions of Toronto. Results showed that the indoor conditions of EN 15026 resulted in higher moisture content in the roofing system compared to the indoor conditions of ASHRAE. Thus, the numerical simulations for the other outdoor climates were conducted using the indoor conditions of EN 15026.
Simulation results showed that black roofs performed with lower moisture content than white roofs. For the outdoor climates of St John’s and Saskatoon, the model suggests that black roofs have a low risk of moisture damage. In these locations, the simulations suggest that the white roofs could lead to longer-term moisture-related problems, where the moisture content of the upper surface of the fibreboard, beneath the roofing membrane, exceeds the acceptable limit of 19% (35.4% and 29.8% for St John’s and Saskatoon, respectively). For the outdoor climates of Toronto, Seattle, and Wilmington, the simulation results showed that the white roofs have a low risk of
experiencing moisture damage. The yearly accumulation of energy loss (i.e. heat out of the building, system contributing to heating load) of the white roof was only 14%, 10% and 26% higher than that of the black roof for Toronto, Seattle, and Wilmington. Conversely, the yearly accumulation of energy gain (i.e. heat into the building, system contributing to cooling load) of the black roof were much higher than that of the white roof (5.3, 6.8 and 4.2 times that for white roof in Toronto, Seattle, and Wilmington, respectively). Thus, buildings with white roofs in these locations should result in a net yearly energy savings compared to buildings with black roofs.
REFERENCES
1. Ray, S., and Glicksman, L. “Potential Energy Savings of Various Roof Technologies”, Eleventh International Conference on Thermal Performance of the Exterior Envelopes of Whole Buildings XI (Clearwater, FL, USA, December 4-9, 2010).
2. Urban, B., and Roth, K., Guidelines for Selecting Cool Roofs, U.S. Department of Energy, Energy Efficiency and Renewable Energy, Building Technologies Program, July 2010.
3. Hutchinson, T. 2009. “Cool roofing challenging what’s cool.” Eco-structure. http://www.eco-structure.com/cool-roofing/challenging-whats-cool.aspx, visited in December 2010.
4. Desjarlais, A.O. “Self-Drying Roofs: What?! No Dripping!”, Proceedings of Thermal Performance of Exterior Envelopes of Buildings VI, December 4-8, 1995, Clearwater, Florida, pp. 763-773, 1995.
5. Desjarlais, A.O., Petrie, T.W., Childs, P.W., and Atchley, J.A. “Moisture Studies of a Self-Drying Roof: Tests in the Large-Scale Climate Simulator and Results From Thermal and Hygric Models”, Proceedings of the Thermal Performance of the Exterior Envelopes of Buildings VII, Clearwater, FL, p. 41-54, 1998.
6. Bludau, C., Zirkelbach, D., and Kuenzel, H.M, “Condensation problems in cool roofs”, Interface, the Journal of RCI. Vol. XXVII, No.7, pp. 11-16, 2009.
7. Bludau, C., Künzel, H.M. and Zirkelbach, D. “Hygrothermal Performance of Flat Roofs with Construction Moisture”, Eleventh International Conference on Thermal Performance of the Exterior Envelopes of Whole Buildings XI (Clearwater, FL, USA, Dec 4-9, 2010).
8. Comparative Climatic Data, National Climatic Data Center, NOAA, 2001,
http://ggweather.com/ccd/nrmhdd.htm, last visited in December, 2010
9. National Building Code of Canada, 2005, Volume 1, Issued by the Canadian Commission on Building and Fire Codes, National Research Council of Canada.
10. Maref, W., Kumaran, M.K., Lacasse, M.A., Swinton, M.C., van Reenen, D., “Laboratory measurements and benchmarking of an advanced hygrothermal model”, Proceedings of the 12th
International Heat Transfer Conference (Grenoble, France, August 18, 2002), pp. 117-122, October 01, 2002 (NRCC-43054).
11. Maref, W., Lacasse, M.A., Kumaran, M.K., Swinton, M.C., “Benchmarking of the advanced hygrothermal model-hygIRC with mid-scale experiments”, eSim 2002 Proceedings (University of Concordia, Montreal, September 12, 2002), pp. 171-176, October 01, 2002.
12. Saber, H.H., Maref, W., Lacasse, M.A., Swinton, M.C., Kumaran, M.K., “Benchmarking of hygrothermal model against measurements of drying of full-scale wall assemblies”, 2010
International Conference on Building Envelope Systems and Technologies, ICBEST 2010, Vancouver, British Colombia Canada, June 27-30, 2010, pp. 369-377.
13. Elmahdy, A.H., Maref, W., Swinton, M.C., Saber, H.H., Glazer, R., “Development of Energy Ratings for Insulated Wall Assemblies”, 2009 Building Envelope Symposium (San Diego, CA. 2009-10-26) pp. 21-30, 2009.
14. Saber, H.H., Maref, W., Elmahdy, A.H., Swinton, M.C., Glazer, R., “3D thermal model for predicting the thermal resistances of spray polyurethane foam wall assemblies”, Building XI Conference, December 5-9, 2010, Clearwater Beach, Florida, USA.
15. Saber, H.H., Maref, W., Elmahdy, A.H., Swinton, M.C., Glazer, R. “3D Heat and Air Transport Model for Predicting the Thermal Resistances of Insulated Wall Assemblies”, International Journal of Building Performance Simulation, First published on: 24 January 2011 (iFirst), pp. 1-17 (http://dx.doi.org/10.1080/19401493.2010.532568).
16. Saber, H.H., Maref, W. Armstrong, M., Swinton, M.C., Rousseau, M.Z., Gnanamurugan, G., “Benchmarking 3D thermal model against field measurement on the thermal response of an insulating concrete form (ICF) wall in cold climate”, Building XI Conference, December 5-9, 2010, Clearwater Beach, Florida, USA.
17. Saber, H.H., and Swinton, M.C., “Determining through numerical modeling the effective thermal resistance of a foundation wall system with low emissivity material and furred – airspace”, 2010 International Conference on Building Envelope Systems and Technologies, ICBEST 2010, Vancouver, British Colombia, Canada, June 27-30, 2010, pp. 247-257.
18. Saber, H.H., Maref, W., and Swinton, M.C. “Thermal Response of Basement Wall Systems with Low Emissivity Material and Furred Airspace” Submitted for Publication to the Journal of Building Physics, in print, May, 2011.
19. Saber, H.H., Maref, W., Swinton, M.C. and St-Onge, C., “Thermal Analysis of above-Grade Wall Assembly with Low Emissivity Materials and Furred Airspace”, Journal of Building and Environment, volume 46, issue 7, pp. 1403-1414, 2011 (doi:10.1016/j.buildenv.2011.01.009). 20. Mukhopadhyaya, P., Kumaran, M.K, Lackey, J., Normandin, N., van Reenen, D. and Tariku, F.,
“Hygrothermal Properties of Exterior Claddings, Sheathing Boards, Membranes and Insulation Materials for Building Envelope, Proceedings of Thermal Performance of the Exterior Envelopes of Whole Buildings X, Clearwater, FL, December 2-7, p. 1-16, 2007.
21. Kumaran, M.K., Lackey, J., Normandin, N., Tariku, F., and van Reenen, D., A Thermal and Moisture Transport Property Database for Common Building and Insulating Materials, Final Report from ASHRAE Research Project 1018-RP, p. 1-229, 2004.
22. Schwartz, N.V., Bomberg, M., and Kumaran, M.K., “Water Vapor Transmission and Moisture Accumulation in Polyurethane and Polyisocyanurate Foams”, Water Vapor through Building Materials and System: Mechanisms and Measurements, ASTM, STP 1039, 1089, p. 63-72 (IRC Paper No. 1614, NRCC 30890).
23. Dupuis, R. M. “Field Survey of Moisture Gain Behavior within Singly-Ply Roof Systems”, Proceedings, Second International Symposium on Roofing Technology, National Roofing Contractors Association (NRCA), Chicago, IL, p. 261-264, 1985.
24. ASHRAE Handbook – Applications, Chapter 3 – Commercial and Public Buildings, Atlanta: American Society of Heating, Refrigerating and Air-Conditioning Engineers, Inc., 2003.
25. EN 15026, “Hygrothermal Performance of Building Components and Building Elements – Assessment of Moisture Transfer by Numerical Simulation,” European Committee for Standardization, Brussels, Belgium, 2007.
26. National Building Code of Canada 2010, Issued by Canadian Commission on Building and Fire Codes, National Research Council of Canada, volume 2, p. 9-4 Division B.