Copyright © 1995 Cambridge I'niversity Press
The development of an age structured model for schistosomiasis
transmission dynamics and control and its validation for
Schistosoma mansoni
M. S. CHAN1. H. L. GUYATT2, D. A. P. BUNDY1, M. BOOTH1, A. J. C. FULFORD3 AND G. F. MEDLEY4
1 Centre for the Epidemiology of Infectious Disease, Department of Zoology, University of Oxford, South Parks Road, Oxford 0X1 3PS, UK 2
Department of Public Health and Epidemiology, Swiss Tropical Institute, Socinstrasse 57, CH4002, Basel, Switzerland
3 Division of Microbiology and Parasitology, Department of Pathology, Cambridge University, Tennis Court Road, Cambridge CB2 1QP, UK
4
Ecosystems Analysis and Management Group, Department of Biological Sciences, University of Warwick, Coventry CV4 7AL, UK
{Accepted 24 May 1995)
SUMMARY
Mathematical models are potentially useful tools to aid in the design of control programmes for parasitic diseases. In this paper, a fully age structured epidemiological model of human schistosomiasis is developed and parameterized, and used to predict trends in infection prevalence, intensity and prevalence of heavy infections over age and time during several rounds of mass and age targeted treatment. The model is validated against data from a Schistosoma mansoni control programme in Kenya.
INTRODUCTION
Schistosomiasis is a major parasitic disease in many areas in the developing world. Although rarely causing mortality, the morbidity caused by this disease can inflict a heavy health burden on high-prevalence communities. The highest intensity of infection is usually observed in children but chronic consequences of infection may last into adulthood. At present, a cost-effective method of controlling the morbidity caused by schistosomiasis is chemotherapy on a community level, especially since the development of the drug, praziquantel, which can be used as a single oral dose and against all the main species of schistosomes. For designing community level control programmes, mathematical modelling of transmission dynamics has proved to be a useful tool in many human infections [1]. and this paper explores the development of a model to assist the design of schistosomiasis control programmes.
Transmission models of schistosomiasis have been in existence since the 1960s [2. 3]. These models have used the indirect life-cycle of schistosomes as the basis of the model with the explicit modelling of transmission between man and snails
(the intermediate hosts) and between snails and man. These models can be used to assess different types of control strategies such as chemotherapy and snail control. A different approach has generally been used to model intestinal nematode dynamics. Since the timescale of the free-living stages is much shorter than that of the mature worm in the human host, the free-living stages are assumed to be at equilibrium and the system is modelled with respect to the mature worm population only [1,4—8]. This reduction in model complexity by bypassing the intermediate life stages is also applicable to schistosomes since the timescale of snail infection (a few weeks) is much shorter than that of human infection (several years). This simplifies the analysis since fewer processes need to be characterized. This is the approach taken in this paper.
The framework explored here is based on an age structured model previously developed for intestinal helminth dynamics [8], In this model there are two host groups, representing adults and children with different infection and con-tamination rates. This age group structure can be used to assess the consequences of child targeted chemotherapy programmes which can be subjected to cost-effectiveness analysis [9].
In this paper we adapt this framework to model human schistosomiasis. The model is expanded to become a fully age-structured partial differential equation model. This is necessary because schistosomes have a much longer lifespan than intestinal helminths and therefore the movement of humans between age groups has a more significant epidemiological effect. Age dependent functions of infection and contamination, as well as the demographic age structure, are also included. Unlike the case with intestinal nematodes, there is no simple way to measure human worm burden for schistosomiasis and all available field results report intensity in terms of egg counts. The model was therefore modified to allow input and output in terms of egg counts. The results of this model are compared with field data from Schistosoma mansoni control programmes.
CONCEPTUAL FRAME WO R K
The schistosomiasis model is developed from the age structured intestinal helminth model described in Chan and colleagues [8]. The main development is from a model with two constant host age groups to a continuous partial differential equation model in which infection intensity is modelled as a continuous function of age and time. There is assumed to be a reduction in the rate of infection with increased level of present infection (analogous in effect to concomitant immunity) and this provides the density dependent feedback in the system. Overall rates of infection and contamination are assumed to be functions of age. and simple empirical functions which peak in the childhood or teenage years are used to simulate these. Data on the demographic age distribution are also incorporated into the framework as the differential contribution of each age group to the transmission of the disease is important.
Data input and output from the model are in terms of mean egg count, either as an arithmetic or geometric mean, and translated to mean worm burden using statistical methods (see section on estimation of parameters). Other outputs from the model are infection prevalence and an estimate of the risk of morbidity due to high levels of current infection (for example, an estimate of the number of
individuals excreting more than 100 epg or eggs per gram of faeces). Age targeted chemotherapy is simulated as an instantaneous reduction of infection intensity in the targeted age groups determined by the coverage and drug efficacy. There will be two effects of treatment, the reduction of infection intensity in the treated age groups due to treatment and the reduction in the other age groups due to the overall reduction in transmission [7].
MODEL DEVELOPMENT
A fully age structured partial differential equation model is developed from the two age group model described in Chan and colleagues [8]. It is similar in structure to an intestinal helminth model published by Anderson and May [5, 6] but also includes heterogeneous contact and contamination rates by age. The rate of change of mean worm burden (M) over age (a) and time (t) is given as:
...
(1)
+
A(M)
where [i is the mortality rate of the mature parasite. The quantity A(a, t) includes the processes of production of infective stages, infective contact and establishment of mature parasites as well as any density dependent processes operating in the transmission cycle. Anderson and May's model assumed that the rate of contact with infective stages is independent of age. However, epidemiological field studies suggest that the contact rate with infection is strongly dependent on age [10, 11]. In this model, this age-dependent infection rate is modelled using the following (unsealed) function p(a):
p(a) = a e( ' ', (2)
which gives a peak at the age l/fi which is typically in the child age classes. As well as age-dependent contact rates, the model also includes age-dependent contamination rates which represent the rates at which individuals of different ages contaminate the environment with infective stages. This is represented by a similar function K(a):
K(a) = a*S-9a\ (3)
which gives a peak at age 1/6 which is also typically in the child age classes. Given a demographic age distribution of n(a), the age-dependent force of infection can then be given as:
fiRop(a)f(M(a,t)) n(a) K(a)M(a,t)da
Ma. t) = ; ^ , (4)
n(a) K(<J) p(a) da
where f(M(a, t)) is a density dependent worm establishment function and Ro is the basic reproductive number. Worm establishment is assumed to be reduced when the current worm burden is high, which is intended to simulate the action of concomitant immunity which provides the density dependent mechanism in this model. It is assumed that the reduction in establishment in a host with n worms is given by e~yn. The distribution of worms between hosts at any time is given by
Time (years)
Fig. 1. An example of a simulation comparing the results of the model in Chan and colleagues [8], using parameters for Ascaris lumbricoides (large roundworm). which simulates the changes in worm burden distribution after treatment (solid lines) with a simplified model in which the worm burden distribution is kept constant (dashed lines). The changes in worm burden over time are shown for adults (light line) and children (heavy line) separately. Children are treated every year for 5 years. The close correspondence between the two models justifies the use of the simpler framework in the schistosomiasis model.
which increases linearly with the mean worm burden. f(M(a.t)) can therefore be
given as [1]: , _ \-<*Wf)+i)
(5) The approximation of a fixed negative binomial is shown to give very close results to more complex models of parasite distributions which include explicit changes in worm distributions as a result of treatment [1. 7. 8]. An example of the correspondence between a model with a fixed distribution and the complex model described in Chan and colleagues [8] is shown in Fig. 1. Since the more complex model would be very difficult to implement for a partial differential equation model, and the results of the two approaches are similar, there is good justification for using the simpler method. Ro has to exceed unity for the infection to remain endemic. The derivation of the equations of this model and the basic definition of
Ro are discussed in more detail in the appendix.
The model is run by assuming that the population parasite distribution is initially at equilibrium. Treatment by chemotherapy perturbs this equilibrium. The equilibrium age distribution of mean worm burden (M*(a)) can be calculated by solving the following ordinary differential equation:
dM*(a)
da
= A(a,t)-fiM.
(6)The details of the procedure used to set up the equilibrium age-intensity distribution are discussed in the appendix.
Treatment by chemotherapy is modelled as an instantaneous reduction in the mean worm burden. Treatment is administered in an age targeted manner but individuals in the treated age groups are selected for treatment at random. The treated age groups are treated with a coverage (c) with a drug of efficacy (E). The instantaneous reduction in mean worm burden is therefore given by:
M(a,t)^(l-cE)M(a,t). (7)
Since data on worm burden for schistosomiasis during the course of a control programme are not available, the input and output of the model are given in terms of mean egg count. It is assumed that there is a constant average number of eggs produced per worm (mating probabilities are not taken into account) given by et. Data on mean egg counts are generally given as either arithmetic or geometric means. The arithmetic mean (EA) is related to the mean worm burden by:
EA = e{M. (8)
The geometric mean (EG) is calculated from the assumed negative binomial distribution of worms. If the probability of harbouring x worms is px, the geometric mean is given as:
px\n(x+l))-l. (9)
The model also calculates the prevalence of infection and the proportion of people above a threshold egg count (an estimate of morbidity) from the negative binomial distribution.
A computer program to implement the model was written in FORTRAN.77 and run on a SUN workstation. The mean worm burden is calculated using a numerical finite difference method (Euler type method). This method is shown to be accurate enough for this model using a time step of 0-05 years.
ESTIMATION OF MODEL PARAMETERS
The central objective of this paper is not the estimation of reliable values for the model parameters but the development of a modelling framework for schisto-somiasis. Therefore where estimates of parameter values exist, these were used and only parameters for which no values are published were estimated.
There are estimated values for the basic epidemiological parameters of all the species of schistosomes and in general the values published in Anderson and May [1] are used. This includes the worm lifespan (4 years) and the basic reproductive number (in the range 1-4).
Measures of worm burdens are available from a few autopsy studies [12]. However, these data are very few in number and do not represent a random sample from a community. In this study worm burden and worm burden distribution were estimated using a statistical method which analyses paired data on prevalence and mean egg count. A dataset for <S. mansoni was obtained from previously published analyses [13].
Initially a model developed originally by Booth [14] for Trichuris trichiura infections was used. This model estimates an appropriate form for the function of the negative binomial parameter k against mean worm burden and a form for the change in egg output per female with worm burden (the model includes the effect of mating probability). The results of the analysis for the S. mansoni data are
Table 1. Analysis of prevalence-intensity data for S. mansoni
k function e, function Maximum likelihood Constant: 0-2385 Constant: 7-3508 -7981-78 Linear: 01453 + 000071/ Constant: 4-0938 -794339 Constant: 0-2359 Exponential: 6-9665e" 0001/ - 7980-54
Linear: 0-1405 + 0-0003M Exponential: 2-8996e-°0004/ -7946-89
Constant: 0-2365 Power: 6-9339/-00001 -798180 Linear: 01447 +0-0007J/ Power: 40229/~00001 -794340
This table shows the fitted values for the aggregation parameter (k) and the egg output per female worm (et). The maximum liklihood value is shown for different assumed functional
forms; the higher this value, the better the fit. The k functions are functions of the worm burden M whereas the fecundity function is a function of the number of female worms. / . A sex ratio of 1 is assumed.
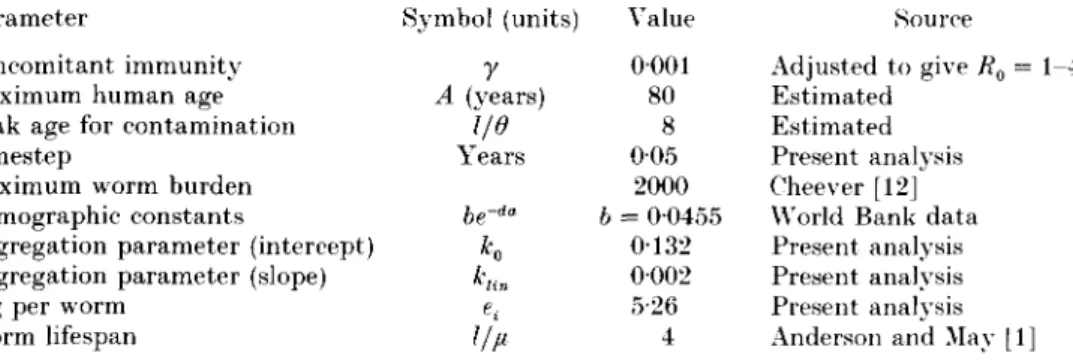
Table 2. Default parameter set used for all simulations
= 1-4 Parameter
Concomitant immunity Maximum human age Peak age for contamination Timestep
Maximum worm burden Demographic constants
Aggregation parameter (intercept) Aggregation parameter (slope) epg per worm
Worm lifespan Symbol (units)
r
A (years) I/O Years be-""K
e. 1/u \ alue 0001 80 8 0-05 2000 b = 00455 0132 0002 5-26 4 Source Adjusted to give Ko Estimated Estimated Present analysis Cheever [12] World Bank data Present analysis Present analysis Present analysis Anderson and Mav 11] shown in Table 1. These results suggest that there is no appreciable density dependence in fecundity and that the most appropriate function for k is a linear function. It is interesting to note the appropriate functional forms are the same as obtained by Booth [14] for T. trichiura. These were the forms of the functions used.The model was then refitted without taking into account mating probability (since it is not part of the dynamic model) or density dependent fecundity and using a linear function for k. This yields three parameters, an intercept and slope for the k function and the mean egg output per worm (er). These are shown in Table
2 (these values are slightly different from those in Table 1 because of the different assumptions). A comparison of the observed data and the fitted model is shown in Fig. 2a.
The transmission model requires the input of the demographic age distribution of the human population. For the purposes of this analysis it was assumed that the age distribution is constant through time and is the current observed age distribution. Data on current demographic distributions in different regions of the world were obtained from the World Bank Global Burden of Disease' study. A good empirical fit was found by using an exponential function for Sub-Saharan Africa and the Middle East and using parts of the Normal curve for Latin America, China, India and South East Asia. Note that these are purely descriptive functions and do not model processes of birth and death. The data used in this
Schistosomiasis transmission model
100 80 60 40 201 (a) 100 200 300 400Intensity (arithmetic mean epg)
500 600
(b)
20
Fig. -'. Fitted functional forms used as input t o t h e schistosomiasis model, (a) Tlie relationship between prevalence and mean egg intensity ( a r i t h m e t i c m e a n ) . T h e line shows the fitted function and the d a t a points are published in [13). P a r a m e t e r values are uiven in Table l\ 1,1)) Fitted generalized d e m o g r a p h i c function for Sub-Kaharan Africa showing t h e percentage of individuals in 5-year age b a n d s . D a t a are from t h e World Bank (bars) and the fitted function used is e x p o n e n t i a l (lines) with p a r a m e t e r s given in Table 2.
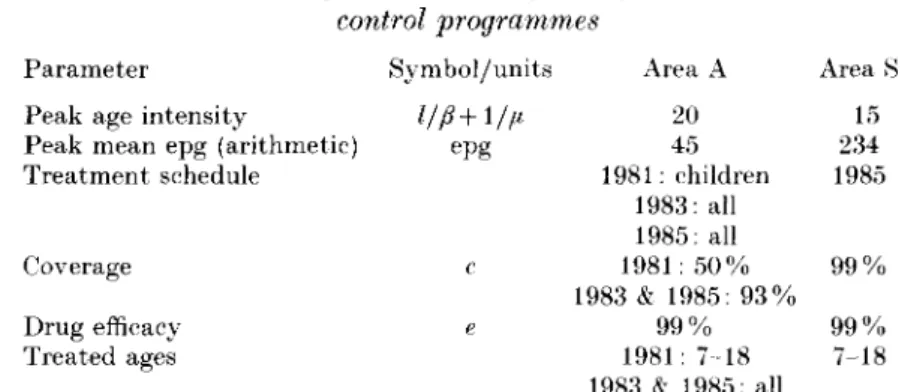
Table 3. Parameters used for validation of data from Kenyan S. mansoni
control programmes Parameter
Peak age intensity
Peak mean epg (arithmetic) Treatment schedule Coverage Drug efficacy Treated ages Symbol/units epg c e Area A 20 45 1981: children 1983: all 1985: all 1981: 50% 1983 & 1985: 93% 9 9 % 1981: 7-18 1983 & 1985: all Area 15 234 1985 9 9 % 9 9 % 7-18
Values obtained from Butterworth and colleages [15] and Sturrock and colleagues [16]. See text for other details of programmes.
paper are from Africa and the exponential model used to simulate the age distribution is shown in Fig. 26.
The default set of epidemiological parameters used is shown in Table 2.
VALIDATION OF MODEL FOR S. MANSONI
The model was validated for S. mansoni using data collected by Butterworth and colleagues [15] in Kenya. In this project, different localities were given different programmes of treatment with a view to comparing the outcomes of different control strategies. Infection prevalence, intensity (measured as geometric mean epg), and prevalence of infections over 100 epg were measured, all of which can be directly output from the model. Two treatment programmes are of particular interest in the context of the model; the area designated Area A in which all individuals were treated and Area S where only school-children were treated. The treatment parameters and initial epidemiological conditions are taken from the study and are shown in Table 3. Other parameters are as in Table 2. Note that the age intensity profile for the model is generated from the generalized function for age dependent exposure rather than using the actual age intensity profile observed in the study.
The treatment history of Area A is somewhat complicated and had to be simulated to give a sensible comparison between the model and data. A number of children had previously been treated in 1981 and the pretreatment intensity had to be obtained from an earlier publication [16]. This child targeted treatment had to be simulated before also simulating the mass treatments in 1983 and 1985. In Area S, school-children between the ages of approximately 7 and 18 years were treated in 1985.
The predicted and observed results are shown together in Fig. 3a-/. The predicted and observed intensity of infection over age and time for Area A are shown in Fig. 3a and b respectively. The model correctly predicts that there is hardly any reinfection over the time period of the programme (4 years after the last mass treatment). In fact, infection has been reduced to and maintained at negligible levels after two mass treatments.
In Area S, where children only were treated, a greater degree of reinfection occurs (Fig. Sc-d). The model correctly predicts this but slightly overestimates the rate of reinfection particularly in the older age classes. This overestimation appears to reflect the unusually severe initial age convexity of intensity in this population (compare 1981 data for Fig. 36 with 1984 data for Fig. 3d). The predicted and observed prevalence of heavy infection are shown in Fig. 3e-/and again there is reasonable correspondence between model and data.
The underlying distributional assumptions of the model can also be tested with these data. Fig. 4 shows the prevalence of heavy infection (> 100 epg) plotted against the overall prevalence of infection (Fig. 4a), prevalence plotted against the mean egg count (Fig. 4b) and prevalence of heavy infection plotted against the mean egg count (Fig. 4c). The data points include data from different age groups and years, pre and post treatment and from Area A and Area S. Several points are to be noted from these graphs. Firstly, the data points clearly show a consistent relationship between the parameters plotted, which demonstrates the feasibility of using a common distributional form for all ages and pre and post treatment. Secondly, the data and model correspond very closely, which gives extra support for the predictive abilities of the model. Note that these data are not the same as the data in Fig. 2a and this therefore is an independent test of the model. Thirdly, a small, but systematic, discrepancy is observed between the data and model and is probably due to the distribution of worms (measured by the function k(M)) in this locality being slightly different from the global average values used in the model. This underlines the importance of using locality specific parameter values (from pre-treatment data) for predictions, while also showing that more global data do usefully predict the overall trends.
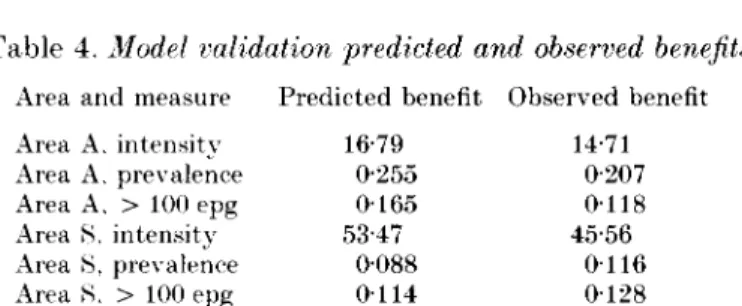
With respect to using the model as a tool for assessing the benefits of treatment, an important test is whether the model can correctly assess the relative benefits of different programmes of treatments. The actual and predicted benefits of the programmes are shown in Table 4. The model estimates are sufficiently close to the actual benefits to warrant using the model to compare the potential suitability of different control programmes.
.SIMULATION OF TREATMENT PROGRAMMES
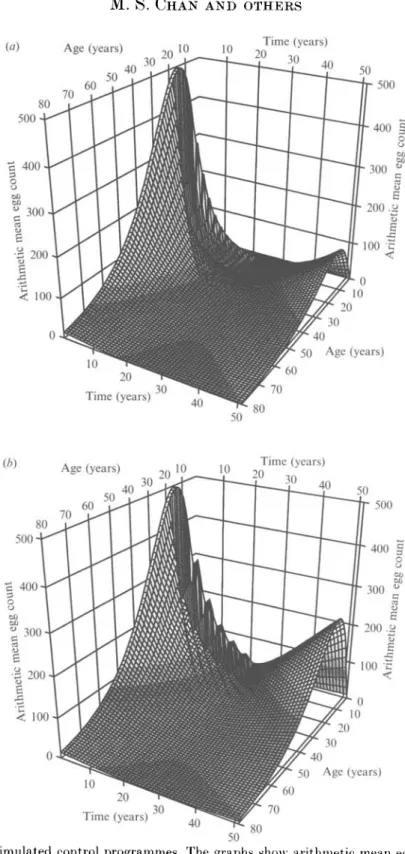
The model was used to simulate different control scenarios in order to illustrate the potential community impact of long-term treatment programmes. Typical control strategies are simulated but the time scale chosen is deliberately long (50 years, comparable to human lifespan) to include ageing related effects. Treatment is carried out for 20 years following by reinfection for 30 years. Treatment parameters are given in Table 5. Arithmetic mean egg count over age and time is plotted for the different control programmes in Fig. 5. For modelling purposes, the arithmetic mean is considered more appropriate than the geometric mean because it is a direct measure of total population size.
Fig. 5a (Control 1) shows a programme with treatment of children aged 7-18 years every 2 years. The simulation shows a decrease in the intensity of infection over the 20 years of treatment and a slow rate of reinfection thereafter. The regular treatment of the most heavily infected age group sustained over a long period results in the virtual elimination of the worm population and therefore the
1981 1981 1984 0-4 5-1 9-1 "13-20 21-40>40 1988
Fig. 3. Model v a l i d a t i o n p r e d i c t e d a n d observed results. Observed results are from a S. mansoni control p r o g r a m m e in K e n y a published in B u t t e r w o r t h and colleagues [15]. I n Area A m a s s t r e a t m e n t occurred w h e r e a s in Area S t r e a t m e n t of school-children occurred, see t e x t for details. P a r a m e t e r values are given in T a b l e s 2 and 3. Results are p l o t t e d b v age g r o u p a n d y e a r as follows, (a) Area A. predicted results, geometric
(d) 1984 1984 1984 0-4 >40
mean egg intensity, (b) Area A. observed results, geometric mean egg intensity, (c) Area S. predicted results, geometric mean egg intensity, (d) Area S. observed results, geometric mean egg intensity, (e) Area S. predicted results, prevalence of infections more than 100 epg. (/) Area >S. observed results, prevalence of infections more than
0-8 (a) 0 6 A i « 0-4] 0 2 -0 0 ^ • 0-2 1 % • / , H 0-4 Prevalence - > * • • 0-6 of infection i 1 0! 0-8--06 0-41 0-21 (b)
t
100 200 Geometric mean 300 400 200 Geometric mean 300 400Fig. 4. Comparison of observed and predicted parasite distributions. Squares show the Butterworth and colleagues [15] dataset, solid line shows the model prediction, (a) Prevalence of infections more than 100 epg against the overall prevalence of infection. (b) Prevalence of infection against geometric mean egg intensity, (r) Prevalence of infections more than 100 epg against geometric mean egg intensity.
Table 4. Model validation predicted and observed benefits Area and measure Predicted benefit Observed benefit Area A. intensity 1679 14-71 Area A. prevalence 0-255 0-207 Area A. > 100 epg 0-165 0-118 Area S. intensity 53-47 45-56 Area 8, prevalence 0-088 0-116 Area H. > 100 epg 0-114 0-128
Benefit measures show average reduction in intensity (geometric mean epg), infection prevalence and prevalence of > 100 epg per year over the duration of the simulation, averaged over all ages, achieved as a result of treatment. Prevalence of infection and infection > 100 epg are quoted as proportions.
Table 5. Parameters used in simulated control programmes Parameter Symbol/units Value
Peak age intensity l/{l + l/(i 15 Peak mean epg (arithmetic) epg 500 Treatment schedule Start year 1;
finish year 21 Coverage c Children 80%; adults 50% Drug efficacy e, 95% Treated ages Child: 7-18;
all: 0-80
rate of infection is very slow. Note that those individuals treated during the programme are not heavily reinfected since they would be older in the reinfection period and thus experience lower rates of exposure. Since all individuals are aging over time in the model, those getting reinfected will be of younger cohorts than those originally treated.
Fig. 56 (Control 2) shows the treatment of children every 4 years. This longer interval of treatment allows more reinfection between treatments and therefore transmission is not reduced to very low levels. Consequently, the rate of reinfection after the treatment stops is significantly higher than in the previous example.
Fig. 5f (Control 3) shows mass treatment of all ages every 4 years. The coverage levels are 80% for school-age children (7-18 years) and 50% for others. The sustained cycles of mass treatment show reduction of infection to very low levels with virtually no reinfection over 50 years.
Fig. 5rf (Control 4) shows one mass treatment followed by child targeted treatment every 4 years. The initial mass treatment is thought to bring down the level of transmission at the beginning of the programme. The long-term results of this strategy, however, are not very different from the 4-yearly treatment of children alone (Fig. 56).
The consequences of these control programmes are best assessed by comparing the community benefits (Table 6). These essentially measure the average reduction in infection intensity over the 50 years of the programme [7-9]. Note that these
(a) Age (years) ,n 10 30 ' 10 Time (years) 50 40 50 500 10 40 50 Age (years) 20 Time (years)30 10 10 20Time (years) 30 40 50 500 10 20 Time (years)
Fig. 5. Simulated control programmes. The graphs show arithmetic mean egg count plotted over age and time. Treatment programmes are initiated in year 1 and finish in year 21. 'Children' refers to individuals in between the ages of 7 and 18. See Tables 2
10 20Time (years) 30 40 50 500 Age (years) 10 20 Time (years)30 40 (d) 500 Age (years) 9f) 10 70 Time (years) 40 50 500 Age (years) 10 Time (years)
and 5 for parameter values, (a) Treatment of children every 2 years. (6) Treatment of children every 4 years, (r) Mass treatment every 4 years, (d) Initial mass treatment then treatment of children everv 4 vears.
Table 6. Benefits for simulated control programmes Programme Absolute benefit Relative benefit 1:
2: 3: 4:
Children every 2 years Children every 4 years Mass every 4 years
Initial mass then children 4 yearly
170 138 183 153 0-81 0-66 0-87 0-73
Benefit measures show average reduction in arithmetic mean epg per year over 50 years averaged over all ages. Absolute benefit is the absolute reduction in intensity relative to no control. Relative benefit is this reduction as a proportion of the mean intensity with no control.
are not directly comparable to those in the previous section since these are measured in terms of arithmetic mean. Compared with the least intensive treatment programme (child treatment every 4 years, Control 2), mass treatment shows the highest increase in benefit (Control 3). This reflects the significant amount of infection in other age groups, especially young adults. However, mass treatment may be expensive to carry out and may achieve low coverage. Two-yearly treatment of children (Control 1) also shows a high benefit. Although requiring more interventions, this may be beneficial when other health programmes at similar intervals may be offered to school children [17].
This exercise is intended to be illustrative of the use of the model for comparing different control strategies. The quantitative results will clearly depend on the initial parameter values, and the outcomes illustrated here are likely to be parameter specific.
DISCUSSION
In this paper, a model of schistosomiasis transmission has been developed using concepts from two earlier published models, those of Chan and colleagues [8] and Anderson and May [5]. Unlike the earlier Chan and colleagues model, age structure is explicitly simulated allowing individuals to age over time. This is necessary when modelling long-lived parasite species where the lifespan of the worm is comparable to the maturation time of the host. The shape of the age-intensity profile can also be taken into account and treatment can be targeted at specific ages. The Anderson and May [5] model has a full age structure but does not take into account age related changes in contact with infection. The present model can give a much more realistic description of community treatment programmes because the greatest intensity of infection is assumed to be in the children which is the generally observed pattern. The drawback of our more complex model is that more parameters need to be estimated. In this paper, this was made as simple as possible by using single parameter functions for the age related functions of exposure and contamination and published data for the demographic age distribution. Although this may not be a very accurate method, the levels of uncertainty in other areas of the model do not warrant greater accuracy at present.
The model predicted the observed trends in infection status over several years after treatment very well given the likely magnitudes of experimental error. These results give support for the predictive value of the model. Analysis of the predicted
and observed benefits of treatment programmes indicate the potential ability of the model to aid policy decisions. The model was tested over a timescale of approximately 10 years. Care must be taken, however, when using this model to make longer-term predictions. This is because over longer timescales effects of acquired immunity (not included in the model) may have a marked impact. Furthermore, neither the local transmission environment nor the population demography can be assumed to be constant over such long timescales. The simulated treatment programmes show perhaps less reinfection than one would imagine. These simulations can be viewed as similar to a 'projection' of the Butterworth and colleagues [15] control programmes continued for 20 years. Since the parameters used in the two analyses were similar, the low amount of reinfection is actually an extrapolation of the Butterworth and colleagues results. Better understanding in three central areas of uncertainty in our understanding of schistosome biology would greatly improve the predictive value of the model. The first of these is the mechanism and strength of density dependence. The marked stability of endemic helminth infections in human communities implies that feedback processes must be operating but the nature of these is still unclear. The evidence for density dependent fecundity is inconclusive [18-20] and the analysis in the current paper found no evidence for it. Limited evidence does exist for the action of concomitant immunity in human schistosomiasis [21] and mouse models [22]. In this paper, density dependence is assumed to operate on establishment. The strength of this mechanism, however, cannot be directly measured in human experiments and in the model the value of this parameter is fitted by assuming a value for the basic reproductive manner (assumed to be about 2)[7.8j.
The second central problem is the impossibility of knowing the true worm burden for schistosome infections. The statistical method used [14] has low discriminatory power due to the relatively large number of parameters estimated and there are no data available for validating the results. This is in contrast to the case for Trichuris trichiura. for which this model was originally developed since there are limited anthelmintic expulsion data for this species. The inability to estimate worm burden has important implications for estimating the basic reproductive number. The only partial solution to this problem is to analyse more datasets using the statistical method and ascertain whether there is a consistency in the results. Data from autopsy or animal studies can also be consulted [12, 23]. The third area of uncertainty is in the basic epidemiological parameters for schistosomes. The most often quoted values are 1-4 for the basic reproductive number and 4 years for the worm lifespan [1] and these values are used here. However, Woolhouse. Hasibeder and Chandiwana (unpublished observations) calculated higher values (4-16) for the basic reproductive number by taking into account acquired immunity and heterogeneity in exposure and contamination. Also, recent analysis of the worm lifespan suggests a longer lifespan of approximately 8 years (Fulford and colleagues, unpublished observations).
The uncertainty in the values of many of the parameters in the model indicates that it will be important to carry out sensitivity analysis on the results of the model. More sophisticated entry of the initial conditions (such as including intensity, prevalence and water contact for all age groups rather than just the peak intensity) would make better use of the data on infection status in a
community and will lead to better predictions. Likewise, better estimates of the parameter values will improve the usefulness of the model.
The public health significance of schistosomiasis includes chronic effects of infection that develop over many years. Measures of morbidity such as prevalence of hepatomegaly are monitored in some control programmes [15]. Such effects are now being incorporated into a morbidity model in a continuation of the current project. Acquired immunity may also have implications for the predictions of the model [24] which can also be incorporated into the framework.
The main improvements of the current model over earlier versions are the incorporation of age related patterns of transmission and infection and the ability to compare the results directly with field data. Comparison between the model and field data demonstrates a convincing ability to predict observed patterns. Such a framework can be very useful in planning control interventions under a wide variety of conditions. The framework lays down the foundation on which further refinements can be made leading to the development of a potentially powerful analytical tool to aid public health decision making.
ACKNOWLEDGEMENTS
We wish to thank Anthony Butterworth and John Ouma for permission to use their field data from Kenya for the model validation. We benefited from discussions with Alison Agnew, Roy Anderson, John Beddington, Nicholas Lwambo. Kate Nokes, James Xokes, John Williams and Mark Woolhouse at various stages of the project. D. A. P. Bundy acknowledges the support of the Wellcome Trust. G. F. Medley is a Royal Society University Research Fellow. M. Booth and H. L. Guyatt were in receipt of Wellcome Trust Travelling Research Fellowships. This study was supported by the Edna MeConnell Clark Foundation.
APPENDIX
Notes on the derivation of model equations
By taking into account the pool of 'free-living' infective stages and setting the number of these to be always at equilibrium (L*), as described in the model of Chan and colleagues [8], the force of infection by age can be written as
k(a)f(M,a.t)L* which can be represented as:
k(a)f(M(a,t)) n{a)A(a)M(a.t)da
\{a,t)= h . (Al) fiL+ k(a)n(a)da
where the functions k(a) and A(a) are the absolute values of the age dependent contact rate and contamination functions respectively and fiL is the infective stage mortality rate.
For a randomly mixing population, the basic reproductive number can be given as [8]:
n(a)A(a)k(a)da
:A 2)
By substituting Ro into equation (10) and rescaling the contact and contamination functions using relative (p{a) and K(U) respectively) instead of absolute values, equation (4) can be obtained.
Notes on calculation of the equilibrium age-intensity distribution
The initial epidemiological conditions are set up by inputting the age of peak intensity (ap) and the intensity at this peak (mp). To calculate the equilibrium worm burden distribution, it is assumed that the age of peak intensity is the sum of the age of peak contact (///?) and the worm lifespan (l/fi) which is a very good approximation, from which:
/? = — ^ — . (A3) fiap - 1
Using this definition, an intermediate scaling factor (a) is calculated (by taking the derivative of equation (6) as zero at the peak) which allows the calculation of the equilibrium age intensity curve as follows:
a = e~^apf(m ) dM*(a) da = aa e-' ia f(M{a))-/jM. (A 5) Equation (14) is solved numerically.
The basic reproductive number (i?0) can then be evaluated, using the known
parameters, as:
r
a. n(a) K(a) p(a) da
R
o= —U . (A 6)
n(a)K(a)M*(a)da
The integrations are performed numerically using NAG subroutines [25]. REFERENCES
1. Anderson RM. May RM. Infectious diseases of humans: dynamics and control. Oxford: Oxford University Press. 1991.
2. Hairston NG. On the mathematical analysis of sehistosome populations. Bull WHO 1965: 33:45-62.
3. Macdonald G. The dynamics of helminth infections, with special reference to schistosomes. Trans Roy Soc Trop Med Hyg 1965: 59: 489-506.
4. Anderson RM. The dynamics and control of direct life evcle helminth parasites. Lect Notes Biomath 1980; 39: 278-322.
5. Anderson RM, May RM. Population dynamics of human helminth infections: control by chemotherapy. Nature 1982; 297: 557-63.
6. Anderson RM. May RM. Helminth infections of humans: mathematical models, population dynamics and control. Adv Parasitol 1985; 24: 1-101.
7. Medley GF. Guyatt HL. Bundy DAP. A qualitative framework for evaluating the effect of community treatment on the morbidity due to ascariasis. Parasitology 1993; 106: 211-21. 8. Chan MS. Guyatt HL. Bundy DAP. Medley GF. The development and validation of an age-structured model for the evaluation of disease control strategies for intestinal helminths. Parasitology 1994: 109: 389-96.
chemotherapy: which is the most cost-effective option ? Trans Roy Soc Trop Med Hyg 1995; 89: 16-20.
10. Jordan P. Schistosomiasis: the St Lucia project. Cambridge: Cambridge University Press. 1985.
11. Bundy DAP. Population ecology of intestinal helminth infections in human communities. Phil Trans Roy Soc Lond 1988: B321: 405-20.
12. Cheever AW. A quantitative post-mortem study of Schistosomiasis mansoni in man. Am J Trop Med Hyg 1968; 17: 38-64.
13. Guyatt HL, Bundy DAP. Estimating prevalence of community morbidity due to intestinal helminths: prevalence of infection as an indicator of the prevalence of disease. Trans Roy Soc Trop Med Hyg 1991: 85: 778-82.
14. Booth M. The epidemiology and population biology of multiple infections with Ascaris Jumbricoides. Trichuris trichiura and hookworms [thesis], London: University of London. 1994.
15. Butterworth AE. Sturrock RF. Ouma JH. et al. Comparison of different chemotherapy strategies against Schistosoma mansoni in Machakos District. Kenya: effects on human infection and morbidity. Parasitology 1991: 103: 339-55.
16. Sturrock RF. Bensted-Smith R, Butterworth AE. et al. Immunity after treatment of human Schistosomiasis mansoni. III. Long-term effects of treatment and retreatment. Trans Roy Soc Trop Med Hyg 1987; 81: 303-14.
17. Warren KS. Bundy DAP. Anderson RM. et al. Helminth infections. In: Jamison DT. Mosley WH. Measham AR. Bobadilla JL. eds. Disease control priorities in developing countries. Oxford: Oxford U/niversity Press. 1993.
18. Medley G. Anderson RM. Density-dependent fecundity in Schistosoma mansoni infections in man. Trans Roy Soc Trop Med Hyg 1985: 79: 532 4.
19. Quinnell RJ. Medley GR. Keymer AE. The regulation of gastrointestinal helminth populations. Phil Trans Roy Soc Lond B 1990: 330: 191-201.
20. de Vlas SJ. Gryseels B. van Oortmarssen GJ. Polderman AM. Habbeina JDF. A model for variations in single and repeated egg counts in Schistosoma mansoni infections. Parasitology
1990: 104: 451-9.
21. Maizels RM. Bundy DAP. Selkirk ME. Smith DF. Anderson RM. Immunological modulation and evasion by helminth parasites in human populations. Nature 1993: 365: 797-805.
22. Smithers SR. Terrv RJ. Immunity in schistosomiasis. Ann Xew York Acad Sci 1969: 160: 826.
23. Muller R. Worms and disease: a manual of medical helminthologv. London: William Heinemann. 1975.
24. Woolhouse MEJ. A theoretical framework for the immunocpidemiology of human helminth infection. Parasitol Immunol 1992: 14: 563-78.
25. Numerical Algorithms Group Limited. The NAG Fortran Library. Mark 14. Oxford: XAG. 1990.
![Fig. 1. An example of a simulation comparing the results of the model in Chan and colleagues [8], using parameters for Ascaris lumbricoides (large roundworm)](https://thumb-eu.123doks.com/thumbv2/123doknet/14925299.663835/4.785.113.662.108.451/example-simulation-comparing-colleagues-parameters-ascaris-lumbricoides-roundworm.webp)


![Fig. 4. Comparison of observed and predicted parasite distributions. Squares show the Butterworth and colleagues [15] dataset, solid line shows the model prediction, (a) Prevalence of infections more than 100 epg against the overall prevalence of infection](https://thumb-eu.123doks.com/thumbv2/123doknet/14925299.663835/12.785.193.596.112.944/comparison-distributions-butterworth-colleagues-prediction-prevalence-infections-prevalence.webp)