Remote Nanoimaging on Mars - Results of the Atomic Force Microscope
Onboard NASA’s Phoenix Mission
S. Gautsch1, D. Parrat1, N. F. de Rooij1, U. Staufer2, J-M. Morookian3, M. Hecht3, S. Vijendran4, H. Sykulska5, T.W. Pike5
1 SAMLAB, EPFL STI, Jaquet-Droz 1, 2002 Neuchatel, Switzerland
2 MNE - Laboratory, TU Delft, Mekelweg 2, 2628 CD Delft, The Netherlands; [email protected] 3 Jet Propulsion Laboratory, California Institute of Technology, Pasadena, CA 91109
4 ESTEC, Keplerlaan 1 Postbus 299, 2200 AG Noordwijk, The Netherlands
5 Dept. of Electrical and Electronic Eng., Imperial College, South Kensington Campus, London SW7 2AZ, UK
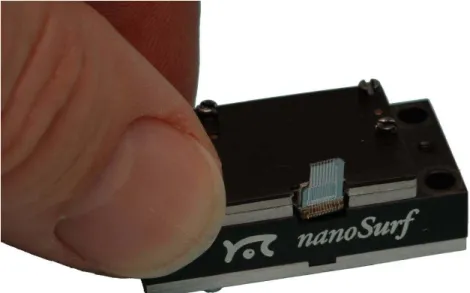
Light scattering experiments conducted on Mars [1] indicated that soil particles have dimensions around 1 Pm. Particles in that range play an important role in the gas exchange between sub-surface water ice and the atmosphere. Their shape can help tracing the geological history and may indicate past presence of liquid water. NASA’s Phoenix mission [2] therefore decided to analyze soil and dust particles in the sub-micrometer to a few sub-micrometer range using an atomic force microscope (AFM) for the first time on another planet. The instrument [3,4,5] was backed up by an optical microscope. The co-axially mounted AFM was capable of resolving particles with 10 nm lateral resolution and a total scan a range of 65Pm in x and y, and 13Pm in z. A MEMS approach combined with mechatronic concepts for the scanner was selected for implementing the AFM. For redundancy, the sensor chip featured eight, about 61m thick silicon cantilevers each with a 7 to 8 Pm high tip. The chip was tilted with two angles relative to the sample surface, such that only one cantilever was in measuring position at a time. The cantilevers could be cleaved off if contaminated. The chip was glued on a triangular platform, which was suspended from the rigid body of the scanner by means of symmetrically arranged polyimide springs. The later also contained the electrical contacts to the chip. Three magnets were attached in the corners of the platform. An electrical coil mounted underneath each magnet allowed deflecting them. The whole scanner
measured 12mm×18mm×24mm and weighted 15g. Figure 1 shows the scanner box with mounted silicon chip.
The AFM system was completed by a single-board electronic controller for static or dynamic, frequency modulation mode [6], and a sample wheel stage. The sample stage featured 10 sets of 6 substrates and 10 calibration samples. It could be moved out of the enclosure to receive a soil or airfall sample. Once rotated in front of the microscopes, the sample wheel moved first to the focus position of the optical microscope. An OM image was taken on which the position for the AFM measurement was selected. The stage was then used to approach the sample to the AFM tip. During NASA’s Phoenix Mission, which operated on the red planet from May to October 2008, we could demonstrate successful AFM operations. The instrument has executed 85 experiments of which 26 were needed for calibration. Of the remaining experiments about half (28) returned images where signatures of particles could be discerned. Figure 2 shows an example of spheroidal and platy particles of a Martian soil sample. The planning of an AFM observation on a given sol was driven by different constraints, depending both on the instrument specificities and on the allocated resources (time, power, data volume). For example, a single AFM observation typically took more than an hour to be executed, limiting the number of images per sol to 3 or 4. In addition, the relation between the AFM and the other instruments of the mission had to be
considered. 864
doi:10.1017/S1431927611005198 © Microscopy Society of America 2011Microsc. Microanal. 17 (Suppl 2), 2011
https://doi.org/10.1017/S1431927611005198
1 W. J. Markiewicz, et al., J. Geophys. Res., 104 (E4), 9009–9017 (1999)
2 PH. Smith, et al., J. of Geophys. Res. - Planets 113, Article Number: E00A18 (2008)
3 M.H. Hecht, et al., J. of Geophys. Res. - Planets 113 Article Number: E00A22 (2008)
4 S. Gautsch, PhD thesis Univ. of Neuchatel, 2002, ISBN 3-935511-24-8
5 D. Parrat, PhD thesis Univ. of Neuchatel, 2007
6 T.R. Albrecht, P. Grütter, D. Horn, and D. Rugar, J. Appl. Phys, 69, 668 (1991)
FIG. 1. AFM scanner of the Phoenix mission with mounted silicon chip showing 8 microfabricated cantilevers
FIG. 2. AFM image taken on August 17th 2008 on sol 82 of the Phoenix mission. This dustfall sample shows a spheroidal particle (in the center) and more platy particles on the top side.
Microsc. Microanal. 17 (Suppl 2), 2011 865
https://doi.org/10.1017/S1431927611005198