Supplementary information ATLAS
Vivian Link, Athanasios Kousathanas, Krishna Veeramah, Christian Sell, Amelie Scheu and Daniel Wegmann
Section 1: Complete list of functionalities
Sequence data processing tools and diagnostics
• Estimate post-mortem damage (PMD): Infer position-specific PMD patterns, as in Map-Damage 2.0 (J´onsson et al., 2013), or fit a generalized model of exponential decay (Kousathanas et al., 2017). While the former is more accurate at the end of the reads, imposing the gen-eralized model reduces estimation noise in the rest of the read where PMD observations are rare.
• Calculate post-mortem damage score (PMDS): Calculate for each read the post-mortem damage score (PMDS) following Skoglund et al. (2014), but considering all sites and thus including the probability of observing a variant affected by PMD.
• Base quality score recalibration based on haploid/ultra-conserved regions (recal): Recalibrate the base sequencing quality scores by exploiting regions of the genome known to show no polymorphism, such as the X-chromosome in mammalian males, or ultra-conserved sites. Compared to BQSR (see below), recal is reference-free as it integrates over the unknown genotypes using our genotyping model taking PMD into account (Hofmanov´a et al., 2016). • Base quality score recalibration (BQSR): Recalibrate the base sequencing quality scores
with a direct extension of BQSR (DePristo et al., 2011). This method is applicable to genomes for which detailed knowledge on known polymorphisms is available and is based on our geno-typing method taking PMD into account (Hofmanov´a et al., 2016).
• Track quality transformation: Compare the original to the recalibrated sequencing quality scores or compare those resulting from two different recalibration methods.
Variant discovery tools
• MLE genotype caller: Determine the most likely diploid genotypes similarly to GATK (De-Pristo et al., 2011) but based on our genotyping model taking PMD into account (Hofmanov´a et al., 2016). The possible output formats include VCF, a custom flat format containing the likelihoods of all genotypes, BEAGLE and gVCF as defined by GATK. The gVCF files can be used as input to GATK’s combinedGVCFs tool in order to produce population sample calls.
• Bayesian genotype caller: Determine the diploid genotypes with the highest posterior probabilities using our genotyping model taking PMD into account (Hofmanov´a et al., 2016). This bayesian caller uses the expected heterozygosity (θ) estimates and base compositions of non-overlapping genomic windows as a prior, inferring them on-the-fly (Kousathanas et al., 2017). The output formats include VCF, a custom flat format containing the posterior probabilities of all genotypes, BEAGLE and gVCF as defined by GATK. The gVCF files can be used as input to GATK’s combinedGVCFs tool in order to produce population sample calls. • Bayesian allele presence caller: For samples with very low sequencing depth identify the alleles with the most evidence to be present based on our genotyping model taking PMD into account (Hofmanov´a et al., 2016). This caller uses the same prior as the Bayesian genotype caller. The haploid genotype posterior probabilites can be produced in VCF or a custom flat format containing the posterior probabilities of all alleles.
Population genetic methods
• Estimate heterozygosity (θ): Estimate local heterozygosity in a genomic region by account-ing for the uncertainty of the local genotypes and PMD (Kousathanas et al., 2017).
• PSMC input file: Produce pairwise sequentially Markovian coalescent (PSMC) model input files following Li and Durbin (2011) by calculating the genotype likelihoods with our genotyping model taking PMD into account (Hofmanov´a et al., 2016).
Auxiliary tools
• Produce recalibrated BAM file: Generate a BAM file containing the recalibrated quality scores by taking the PMD patterns and recalibration parameters generated by ATLAS into account. The probability of PMD can further be added to the sequencing error rate and thus reflected in the quality scores, following mapDamage 2.0 (J´onsson et al., 2013).
• Pileup: For each genomic position determine the sequencing depth, the identity of the bases covering it following Li et al. (2009) and the product of all base observation probabilities given each genotype, which are calculated based on our genotyping model taking PMD into account (Hofmanov´a et al., 2016).
• Classify single-end sequencing reads by length: The probability of PMD depends on a nucleotide’s distances from the fragment ends. These distances are known for paired-end and single-end sequencing reads spanning the entire fragment, but not for single-end reads shorter than their fragment. ATLAS thus implements this functionality to classify single-end reads accordingly in order to infer PMD patterns independently for both groups.
• Merge paired reads: Merge mates from paired-end sequencing by inserting ’N’ when the reads do not overlap and choosing the bases with higher quality scores when they do.
• Merge read groups: Merge specified read groups and produce a new BAM file. • Calculate coverage: Calculate mean sequencing depth of BAM file.
• Calculate coverage per window: Calculate mean sequencing depth for non-overlapping genomic regions.
Section 2: Pipeline for paired-end data
Step 1: Inferring PMD patterns. For paired-end sequencing data the fragment lengths are known and the PMD patterns can be inferred directly from the original BAM file without having to classify the reads according to length.
Step 2: Recalibrating base quality scores. This step does not differ from the single-end pipeline in the main text.
Step 3: Merging paired-end mates. A merging step is necessary to remove overlapping se-quencing data from paired mates, which is redundant for the variant discovery or population genetic tools. When the paired mates are overlapping, the recalibrated sequencing quality scores are used to decide on which base to keep.
Step 4: Inferring PMD patterns for merged reads. The PMD patterns have to be re-estimated since the reads are now longer.
Step 5: Applying the variant discovery/population genetic tool of choice. This step does not differ from the single-end pipeline in the main text.
Section 3: Parameters used with the different programs
GATK
BaseRecalibrator: default parameters PrintReads: default parameters HaplotypeCaller:
• –ERC BP RESOLUTION • –doNotRunPhysicalPhasing • –min base quality score 1
• –standard min confidence threshold for calling 0 • –standard min confidence threshold for emitting 0
• -minPruning 1 (only for increased sensitivity for supplementary Figure 1)
• -minDanglingBranchLength 1 (only for increased sensitivity for supplementary Figure 1)
ATLAS
BQSR:
• minEpsQuality 0.0001 callMLE:
• gVCF • printAll
For the rest of the ATLAS pipeline the default parameters were used.
mapDamage 2.0
–rescale in order to print BAM file with quality scores adjusted for post-mortem damage
Section 4: Accuracy with increased sensitivity of GATK
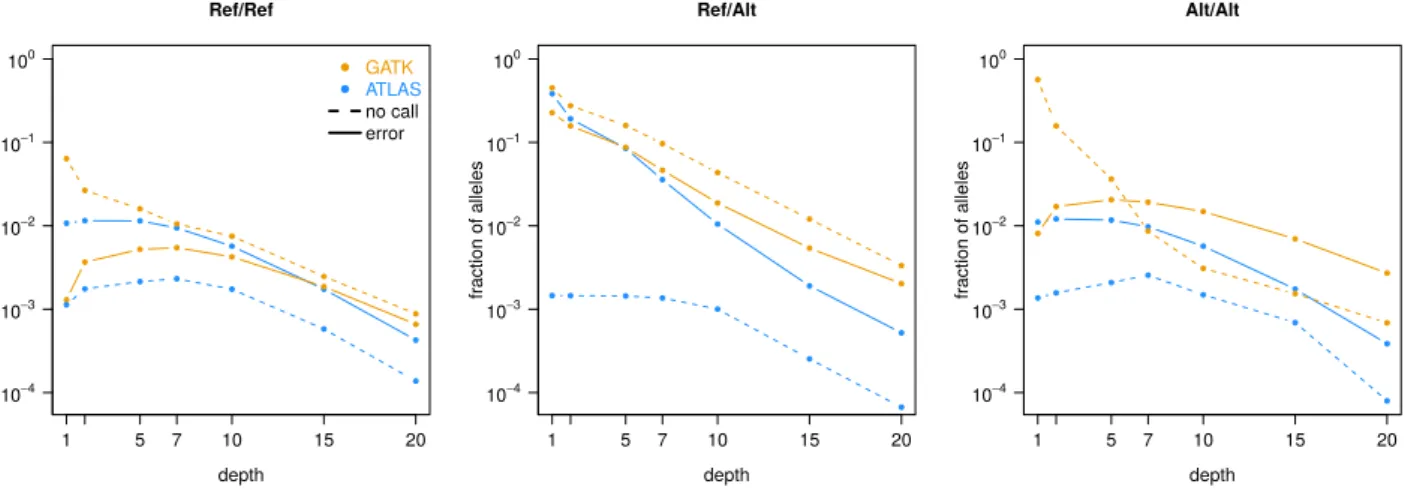
Since the greatest difference between ATLAS and GATK was that GATK disregards many sites, we tried to reduce the depth it requires to produce calls and to increase its sensitivity towards variants by running the HaplotypeCaller with parameters -minPruning 1 and -minDanglingBranchLength 1. Figure 1 shows that the number of sites GATK left uncalled in the presence of sequencing depth barely changed compared to the analysis with default parameters (main text Figure 1). The error rate, however, greatly increased, which is probably why the developers warn from changing the default values of these parameters.
Ref/Ref depth fraction of alleles 1 5 7 10 15 20 10−4 10−3 10−2 10−1 100 ● ● ● ● ● ● ● ● ● ● ● ● ● ● ● ● ● ● ● ● ● ● ● ● ● ● ● ● ● ● GATK ATLAS no call error Ref/Alt depth fraction of alleles 1 5 7 10 15 20 10−4 10−3 10−2 10−1 100 ● ● ● ● ● ● ● ● ● ● ● ● ● ● ● ● ● ● ● ● ● ● ● ● ● ● ● ● Alt/Alt depth fraction of alleles 1 5 7 10 15 20 10−4 10−3 10−2 10−1 100 ● ● ● ● ● ● ● ● ● ● ● ● ● ● ● ● ● ● ● ● ● ● ● ● ● ● ● ●
Figure 1: Fraction of alleles not called or wrongly called at sites with sequencing depth > 0 in a simulated chromosome of 10Mb. ATLAS was run with the default parameters while GATK was run with -minPruning 1 and -minDanglingBranchLength 1 to increase sensitivity. The calls are classified according to the underlying true genotype (Ref=reference allele, Alt=alternative allele).
References
DePristo, M. et al. (2011). “A framework for variation discovery and genotyping using next-generation DNA sequencing data.” In: Nat. Genet. 43.
Hofmanov´a, Z. et al. (2016). “Early farmers from across Europe directly descended from Neolithic Aegeans”. In: Proc. Natl Acad. Sci. USA 113.
J´onsson, H. et al. (2013). “mapDamage2.0: fast approximate Bayesian estimates of ancient DNA damage parameters.” In: Bioinformatics 29.
Kousathanas, A. et al. (2017). “Inferring Heterozygosity from Ancient and Low Coverage Genomes”. In: Genetics 205.1.
Li, H. et al. (2009). “The Sequence Alignment/Map format and SAMtools”. In: Bioinformatics 25.16. Li, H. and R. Durbin (2011). “Inference of human population history from individual whole-genome
sequences”. In: Nature 475.
Skoglund, P. et al. (2014). “Separating endogenous ancient DNA from modern day contamination in a Siberian Neandertal”. In: Proc. Natl Acad. Sci. USA 111.