Article
People with Alcohol Use Disorders in Specialized
Care in Eight Different European Countries
Jürgen Rehm
1,2,3,4,5, Allaman Allamani
6, Henri-Jean Aubin
7,
Roberto Della Vedova
8, Zsuzsanna Elekes
9, Ulrich Frick
10,11,
Andrzej Jakubczyk
12, Nikoleta Kostogianni
7, Inga Landsmane
13,
Jakob Manthey
5,*, Laia Miquel
14,15,16, François Paille
17, Lars Pieper
5,
Charlotte Probst
1,5, Francesca Scafuri
8, Kevin D. Shield
1,3, Sigita Snikere
18,
Pierluigi Struzzo
8, Marcis Trapencieris
18,19, Fabio Voller
6,
Hans-Ulrich Wittchen
5, Antoni Gual
14,15,16,†, and Marcin Wojnar
12,20,†1
Centre for Addiction and Mental Health, 33 Russell Street, Toronto, ON M5S 2S1, Canada,
2Addiction Policy, Dalla
Lana School of Public Health, University of Toronto, 155 College Street, 6th Floor, Toronto, ON M5T 3M7, Canada,
3
Faculty of Medicine, Institute of Medical Science, University of Toronto, Medical Sciences Building, 1 King
’s
College Circle, Room 2374, Toronto, ON M5S 1A8, Canada,
4Department of Psychiatry, University of Toronto, 250
College Street, 8th Floor, Toronto, ON M5T 1R8, Canada,
5Institute of Clinical Psychology and Psychotherapy &
Center of Clinical Epidemiology and Longitudinal Studies (CELOS), Technische Universität Dresden, Chemnitzer
Str. 46, 01187 Dresden, Germany,
6Agenzia Regionale di Sanità Toscana, Villa la Quiete Alle Montalve, Via Pietro
Dazzi 1, 50141 Firenze, Italy,
7Centre D
’Enseignement, de Recherche et de Traitement des Addictions, Hôpital Paul
Brousse, AP-HP, Univ Paris-Sud, INSERM U669, 94804 Villejuif, France,
8Regional Centre for the Training in
Primary Care (Ceformed), Via Galvani 1, 34074 Monfalcone, GO, Italy,
9Corvinus University of Budapest, Közraktár u.
4-6, H-1093 Budapest, Hungary,
10Research Institute for Public Health and Addiction, University of Zurich, Zurich,
Switzerland,
11Department of Applied Psychology, Döpfer University of Applied Sciences, Cologne, Germany,
12
Department of Psychiatry, Medical University of Warsaw, Nowowiejska 27, 00-665 Warsaw, Poland,
13Riga
Centre of Psychiatry and Addiction Medicine, Tvaika Iela 2, Riga, Latvia,
14Addictions Unit, Psychiatry Department,
Neurosciences Institute, Hospital Clinic, Carrer Villarroel 170, 08036, Barcelona, Spain (Catalonia),
15Institut
D
’Investigacions Biomèdiques August Pi i Sunyer (IDIBAPS), Carrer Rosselló 149, 08036, Barcelona, Spain
(Catalonia),
16Red de Trastornos Adictivos (RTA - RETICS), Instituto de Salud Carlos III, Calle Sinesio Delgado, 4,
28029 Madrid, Spain (Catalonia),
17Department of Addiction, CHU de Nancy, rue du Morvan, 54500 Vandoeuvre,
France,
18Institute of Sociological Research, Dzirnavu Iela 55 k2-2, Riga, Latvia,
19Institute of Philosophy and
Sociology, University of Latvia, Akademijas Laukums 1, Riga, Latvia, and
20Department of Psychiatry, University of
Michigan, 4250 Plymouth Rd, Ann Arbor, MI 48109, USA
*Corresponding author: Chemnitzer Str. 46, 01187 Dresden, Germany. Tel.: +49 176 99076559; Fax: +49 351 46339830; E-mail: [email protected]
†Joint last authorship.
Received 7 September 2014; Revised 23 December 2014; Accepted 27 January 2015
Abstract
Aim: To provide a description of patients receiving alcohol treatment in eight different European
countries, including the level of comorbidities and functional limitations.
Methods: Drinking behaviours, DSM-IV alcohol use disorder (AUD), mental and somatic
comorbid-ities, disability and health services utilization of 1767 patients from various specialized treatment
set-tings were assessed as representative for regions of eight European countries. Severity of alcohol
dependence (AD) in terms of drinking level was compared with a large representative US sample.
doi: 10.1093/alcalc/agv009 Advance Access Publication Date: 25 February 2015 Article
Results: Patients in specialized care for AUDs showed high levels of consumption [average level of
daily ethanol intake: 141.1 g, standard deviation (SD): 116.0 g], comorbidity [e.g. liver problems:
19.6%, 95% con
fidence interval (CI): 17.5–21.6%; depression: 43.2%, 95% CI: 40.7–45.8%; anxiety:
50.3%, 95% CI: 47.8
–52.9%], disability and health services utilization (average number of nights
spent in hospital(s) during the last 6 months: 8.8, SD: 19.5 nights). Severity of AD was similar to
the US sample, but European men consumed on average more alcohol daily.
Conclusions: High levels of consumption, somatic and mental comorbidities, disability and
func-tional losses were found in this representative treatment sample, indicating that treatment was
in-itiated only at severe stages of AUDs. Earlier initiation of treatment could help avoid some of the
health and social burden.
INTRODUCTION
Alcohol use disorders (AUDs) in general and alcohol dependence (AD) in particular are highly prevalent and disabling conditions in the Euro-pean Union (EU). AUD here is defined as fulfilling the diagnostic criteria of AD and/or alcohol abuse, as defined in the DSM-IV. Regarding prevalence, the most recent overview (Rehm et al., 2015b) found a prevalence of AD 3.4% for both sexes combined in 2010 for people aged 18–64 (1.7% among women and 5.2% among men), which translates into an estimated 11 million people with AD in the EU. For all AUD, the estimate was about 23 million people affected (Rehm et al., 2015b). It should be noted that these numbers are based on general population surveys with standardized instruments which do not include people with AD or AUD among the homeless (Fazel et al., 2008), the prison population (Fazel et al., 2006) or in mental institutions (Shield and Rehm, 2012), meaning that the numbers are likely underestimates. In addition, a large study in primary care in six EU countries showed that standardized in-struments may underestimate the true prevalence of AUD, especially in age groups 40 and above (Rehm et al., 2015a).
With respect to disability and burden of disease, recent studies have revealed not only a high degree of comorbidity and disability (Samokhvalov et al., 2010;Rehm et al. 2014b,2015a), but also a sur-prisingly high rate of fatalities (for meta-analyses, seeRoerecke and Rehm, 2013,2014).
Despite this burden, treatment rates for AD or AUDs have been low, especially rates in specialized treatment. Alonso and co-workers found a treatment rate of 8.3% among people with AUD in the general population in six countries in western Europe, who participated in the World Mental Health Survey between January 2001 and August 2003 (Alonso et al., 2004); and Rehm and colleagues, with different meth-ods, 10 years later, estimated about the same proportion for the EU as a whole (Rehm et al. 2012,2013c). The high treatment gap was also corroborated byDrummond et al. (2011).
While we can estimate treatment rates based on aggregate statistics, not much is known about the characteristics of people who seek treat-ment for AUD or AD in the EU. There are two main sources of infor-mation on patients in AUD treatment: (a) official statistics on patients treated for substance use disorders (including alcohol) in different institutions (e.g.Agència de salut pública de Barcelona, 2012;Italian Ministry of Health, 2013), and (b) single studies in se-lected in- or outpatient facilities, not representative for an entire re-gion or country (e.g.Röske et al., 2004;Picci et al., 2012). However neither source could give detailed characteristics of a representative sample of treated AUD patients for larger regions or countries in Europe for characteristics such as, but not limited to, comorbidity or problem severity indicators.
There have been some indications that AD in specialized health care (SC) is more severe in Europe compared with North America (e.g. in terms of more DSM-IV symptoms experienced; more standard drinks per occasion and more heavy drinking days in the German ver-sion of the Combine study compared with the US original study; Mann et al., 2013), but we do not know how representative the study populations showing differences had been (Bottlender et al., 2006), and whether other factors such as age are the main determi-nants on such differences. The latter seems plausible (albeit not for theMann et al., 2013, study), as prevalence of AD in adolescence and early adulthood seems to be considerably higher in North Amer-ica (especially the US, cf.Grant et al., 2004;Caetano and Babor, 2006;) compared with Europe (Rehm et al., 2005), at least in general population samples.
The objective of this contribution was tofill the above-described gap in the literature, and to describe representative samples from spe-cialized treatment in European regions or countries. More specifically, we wanted to characterize SC patients with respect to:
• sociodemographics;
• their alcohol consumption, symptoms of DSM-IV AUD and severity of AUD;
• mental and somatic comorbidity, and associated disability;
• health service utilization.
In addition, we wanted to compare patients from different treatment settings (inpatients vs. outpatients vs. rest) and examine whether our treatment sample differed from a representative sample in the US with respect to average daily drinking.
MATERIALS AND METHODS
This assessment of AUDs in SC facilities was complementary to the Alcohol Dependence in Primary Care (APC) study (Manthey et al., 2014;Rehm et al., 2015a), which assessed prevalence and detection of AUDs in primary care settings. While thefirst part was restricted to regions in six European countries, the second part extended its scope to regions in eight European countries, namely Austria (Carinthia), France (sampling was based on whole country), Germany (Saxony & Berlin-Brandenburg), Hungary (whole country), Italy (Friuli-Venezia Giulia & Tuscany), Latvia (whole country), Poland (Pomorskie, Warminsko-Mazurskie, Dolnoslaskie, Podlaskie, Podkarpackie & Malopolskie) and Spain (Catalonia). In total, 1767 patients from 45 SC facilities and various self-help groups were re-cruited for this study. Monetary compensation of goods or vouchers was offered to the clinics and/or professionals participating in the
study in Austria, France, Latvia and Poland. Interviews were con-ducted between January 2013 and March 2014.
Sampling of AUD treatment providers in eight
European countries
Treatment provision for AUD in Europe differs greatly, with varia-tions being understudied (European Commission, 2004;Drummond et al., 2011;Rehm et al., 2013b). However, we tried to account for and represent country- or region-specific characteristics and included patients receiving various types of treatments for their alcohol pro-blems. Broadly, institutionalized and non-institutionalized treatment options have been identified. A brief description of sampled treatment facility types is available in Supplementary Appendix 1.
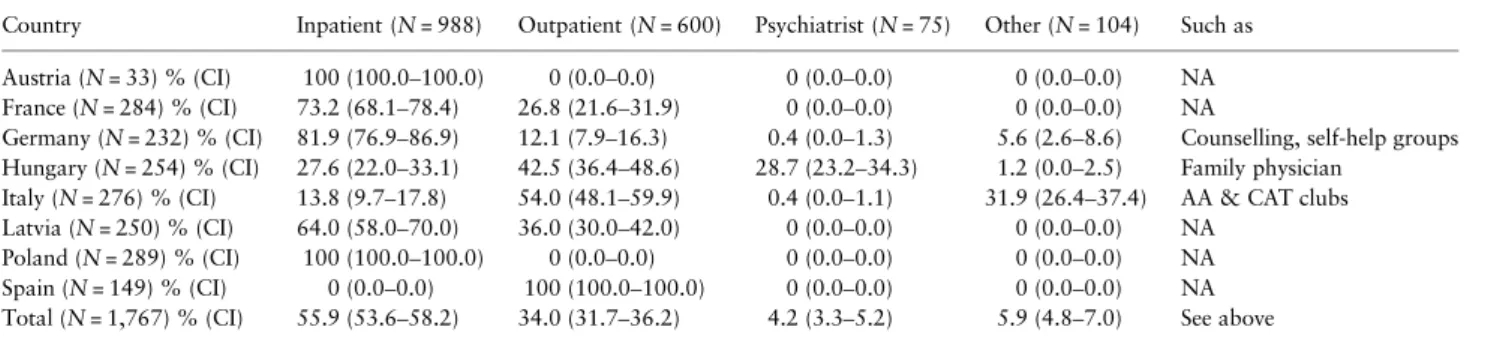
The type of treatment facility as sampled by each country is sum-marized in Table1. Most commonly, patients included in this study were admitted as inpatients (55.9%), followed by those in outpatient treatment (34.0%). Some patients were also treated by a registered psychiatrist (4.2%) or were recruited from other non-institutionalized treatment providers (5.9%), mostly self-help groups. However, marked differences between countries could be observed: in Austria, all patients received inpatient treatment, whereas all Spanish patients were recruited from outpatient treatment facilities (reflecting the or-ganization of the Catalonian treatment system for AUD; see Supple-mentary Appendix 1). Regarding non-institutionalized treatment, patients in treatment with a psychiatrist were recruited foremost in Hungary (28.4% of Hungarian patients) and self-help groups were most highly represented in Italy (31.9% of Italian patients).
Patient interview
In most countries, all patients aged 18–64 years receiving current in-terventions for their alcohol problems on a given day were asked to be interviewed. Interviewees in Friuli-Venezia Giulia (Italy) were con-tacted if they were present on a given day, and were called if not pre-sent but registered on a SC list. In Poland, admission to the SC facility implied participation in this study. Hence, all newly admitted patients could be recruited there with interviews being conducted within 1–2 weeks after admission.
More than 9 out of 10 patients were interviewed in the respective SC facility. All interviews were conducted by trained interviewers across all countries. Computer-assisted personal interviews were used in Austria, Germany, Latvia and Spain. In the remaining coun-tries, paper and pencil were used to document the interview.
The basic structure and content of the patient interview was similar to the interview conducted in the APC study (seeManthey et al., 2014) and began with obtaining informed consent and
comprised a socio-demographic part, the World Health Organization Disability Assessment Schedule 2.0 (WHODAS 2.0;Üstün et al., 2010), the Kessler Psychological Distress Scale (K10) to identify severe mental problems (Kessler et al., 2002), the Composite International Diagnostic Interview—CIDI (Robins et al., 1988) and the UK alcohol treatment trial health service utilization questionnaire (UKATT Research Team, 2005). We also assessed self-reported height, weight and select somatic (hypertension, liver) and mental co-morbidities. Monetary compensation for interviewees was offered in most countries: Austria (15€), Germany (20€), Hungary (2€ gift coupon), Latvia (3€) and Spain (20€).
Comparison with US sample
We compared our sample with the treated subsample of the large (N = 43,093) NESARC study, representative for the US for the years 2001/2002, with respect to the level of consumption among current drinkers (in g/day with a cap of 500 g/day and excluding current abstainers as defined by less than 10 g/day) via linear regression for men and women separately, controlling number of AD criteria. Add-itionally we analysed differences in the number of AD criteria between samples via a quasi-poisson regression for men and women separately. All regression models took into account the complex sampling design of the NESARC survey and were performed using R version 3.1.1 (R Development Core Team, 2014) and the R survey statistical pack-age (Lumley, 2004). The NESARC sample has been described in detail elsewhere (Grant et al., 2003).
Statistical methodology
Missing values were imputed for scales if only single items were miss-ing. Other missing cases were not included in the analyses. All analyses other than the comparison with NESARC were conducted using Stata 12 (Stata Corporation, 2011). In order to test for country differences on key drinking variables we carried out ANOVAs (for average daily intake of ethanol) and logistic regressions (for percentage of patients with weekly binge drinking or chronic heavy drinking habits), both adjusted by age and sex. If the overall model was significant, each country was compared against the remaining countries using the same procedure. In order to account for multiple testing, the signi fi-cance level was Bonferroni-adjusted.
RESULTS
Response and refusals
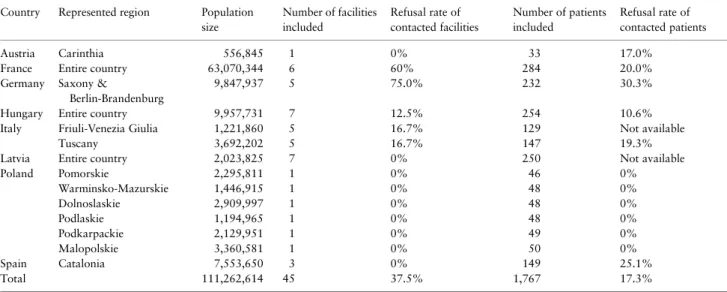
Table2reports the countries and regions for which the selected SC fa-cilities are representative. Most treatment centres were willing to take
Table 1. Type of treatment facility by country
Country Inpatient (N = 988) Outpatient (N = 600) Psychiatrist (N = 75) Other (N = 104) Such as Austria (N = 33) % (CI) 100 (100.0–100.0) 0 (0.0–0.0) 0 (0.0–0.0) 0 (0.0–0.0) NA France (N = 284) % (CI) 73.2 (68.1–78.4) 26.8 (21.6–31.9) 0 (0.0–0.0) 0 (0.0–0.0) NA
Germany (N = 232) % (CI) 81.9 (76.9–86.9) 12.1 (7.9–16.3) 0.4 (0.0–1.3) 5.6 (2.6–8.6) Counselling, self-help groups Hungary (N = 254) % (CI) 27.6 (22.0–33.1) 42.5 (36.4–48.6) 28.7 (23.2–34.3) 1.2 (0.0–2.5) Family physician
Italy (N = 276) % (CI) 13.8 (9.7–17.8) 54.0 (48.1–59.9) 0.4 (0.0–1.1) 31.9 (26.4–37.4) AA & CAT clubs Latvia (N = 250) % (CI) 64.0 (58.0–70.0) 36.0 (30.0–42.0) 0 (0.0–0.0) 0 (0.0–0.0) NA
Poland (N = 289) % (CI) 100 (100.0–100.0) 0 (0.0–0.0) 0 (0.0–0.0) 0 (0.0–0.0) NA Spain (N = 149) % (CI) 0 (0.0–0.0) 100 (100.0–100.0) 0 (0.0–0.0) 0 (0.0–0.0) NA Total (N = 1,767) % (CI) 55.9 (53.6–58.2) 34.0 (31.7–36.2) 4.2 (3.3–5.2) 5.9 (4.8–7.0) See above
part in our study (average response rate on institutional level: 62.5%), with refusal rates being 0% in Austria, Latvia, Poland and Spain; and around 15% in Hungary and Italy. Higher refusals were encountered in France (60%) and Germany (75%). Patient non-response rates ran-ged from 0% in Poland to 30.3% in Germany (average response rate on individual level: 82.73%). The sample of treatment providers is thought to be representative for a total general population of over 110 million people (for details see Table2).
Socio-demographic characteristics
About 72.4% [95% confidence interval (CI): 70.3–74.4%] of all pa-tients in specialized care were men (see Table3). The average age was 46.3 years (standard deviation—SD: 10.1 years). A considerable por-tion of patients was from lower socio-economic strata (44.3%; 95% CI: 41.9–46.6%), and more than one-third of the patients were un-employed (36.0%; 95% CI: 33.7–38.2%), considerably more than in the adult general population in the EU which is slightly above 10% (http://epp.eurostat.ec.europa.eu/tgm/table.do?tab=table&language= en&pcode=teilm020).
Alcohol consumption and criteria of AD
With respect to alcohol-related variables, there were some patients who did not consume alcohol or had (compared with the average pa-tient) very low alcohol consumption during the past year before the interview. This surprising result was due to the definition of treatment system in the various countries, which for instance included people in AA self-help groups, requiring abstention. Of those drinking, as de-fined by a consumption of 10 g or more per day, the level of drinking was very high: 58.0% of male patients (95% CI: 55.0–60.9%) and 41.6% of female drinkers (95% CI: 36.5–46.6%) had an average daily volume of alcohol consumption of 100 g pure alcohol or higher, with 152.5 g (SD: 122.9 g) among men and 108.2 g (SD: 85.0 g) among women as average daily consumption, and 46.6% (95% CI: 43.6–49.6%) of men and 28.2% (95% CI: 23.6–32.7%) of women had at least one binge drinking occasion consuming 200 g or more per week.
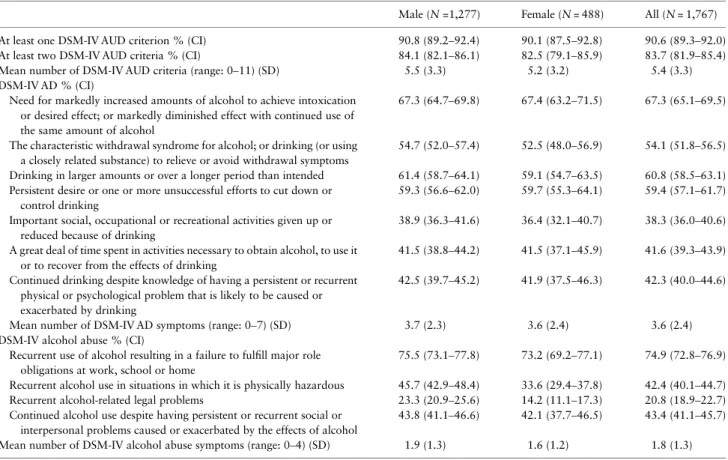
At least one DSM-IV AD or abuse criterion was present in 9 out of 10 of the patients (see Table4). The average number of DSM-IV
AUD symptoms present was 5.4 (SD: 3.3 symptoms), with toler-ance and role failures having the highest prevalence, being present in two-thirds or three-fourths of the patients, respectively (see Table4).
Variability of key alcohol consumption measures
by study site and treatment setting
Differences in daily amount of alcohol used by drinking patients in the 12 months before treatment were observed between study sites (see Table5). In Germany (223.5 g; SD: 133.7 g), patients drunk more than the overall average while in Latvia (96.9 g; SD: 97.9 g) and Pol-and (91.0 g; SD: 83.2 g), the mean daily consumption was less than average. The same pattern of differences could be observed regarding chronic heavy drinking, i.e. using at least 100 g pure alcohol daily. Pa-tients in Germany reported weekly binge drinking occasions more fre-quently (67.3%; 95% CI: 61.1–73.4%), i.e. more than 200 g ethanol, than average. Only Polish patients were found to experience less binge drinking occasions (25.2%; 95% CI: 19.5–30.9%) compared with the group mean. No differences in alcohol measures were found across type of treatment setting after Bonferroni adjustments (see Supplemen-tary Appendix 2).
Comorbidity and disability
The prevalence of self-reported somatic and mental comorbidities was high. 73.7% (95% CI: 71.5–76.0%) indicated at least one occurrence of hypertension, liver cirrhosis, depression or anxiety disorders, 34.8% (95% CI: 32.3–37.2%) had at least one somatic co-morbid condition and 61.5% (95% CI: 59.0–64.0%) at least one mental. In terms of standardized assessment, more than one-third of all patients had serious mental distress, proportionally more females (43.0%; 95% CI: 38.6–47.4%) than male patients (33.3%; 95% CI: 30.7– 35.9%). Most somatic and mental comorbidity measures were equally distributed across different types of treatment setting (inpatient vs. outpatient vs. remaining settings, see Supplementary Appendix 3 and 4), except for the K10 mental distress measure which was found to be higher in inpatients compared with outpatients (P = 0.0004; post hoc test) and all remaining settings (P < 0.0001; post hoc test). Table 2. Selected regions and countries, population size, number and refusal rates of specialized care facilities and number of patients recruited
Country Represented region Population size Number of facilities included Refusal rate of contacted facilities Number of patients included Refusal rate of contacted patients Austria Carinthia 556,845 1 0% 33 17.0%
France Entire country 63,070,344 6 60% 284 20.0%
Germany Saxony &
Berlin-Brandenburg
9,847,937 5 75.0% 232 30.3%
Hungary Entire country 9,957,731 7 12.5% 254 10.6%
Italy Friuli-Venezia Giulia 1,221,860 5 16.7% 129 Not available
Tuscany 3,692,202 5 16.7% 147 19.3%
Latvia Entire country 2,023,825 7 0% 250 Not available
Poland Pomorskie 2,295,811 1 0% 46 0% Warminsko-Mazurskie 1,446,915 1 0% 48 0% Dolnoslaskie 2,909,997 1 0% 48 0% Podlaskie 1,194,965 1 0% 48 0% Podkarpackie 2,129,951 1 0% 49 0% Malopolskie 3,360,581 1 0% 50 0% Spain Catalonia 7,553,650 3 0% 149 25.1% Total 111,262,614 45 37.5% 1,767 17.3%
Disability and health services utilization were high as well: on average, 4 days in the last 4 weeks before treatment, patients could not carry out their work or usual activities because of their health (see Table3). Measured with the WHODAS 2.0, a standardized scale, there was a high level of disability approximately corresponding to the 80th per-centile in the general population of the norming samples (Üstün et al., 2010). Finally, health service utilization was high: in the last 6 months and excluding the current stay in specialized care, 57.5% (95% CI: 55.2–59.8%) of the patients were admitted at least once to a hospital. Those admitted to a hospital spent on average 14.1 nights (SD: 19.8 nights) as inpatient or in accident and emergency depart-ments. Across all patients, the average number of nights spent in any service, also including specialized services for alcohol treatment, added up to 8.8 nights (SD: 19.5 nights). Further, 67.8% (95% CI: 65.6–70.0%) received some kind of service from their GP.
Comparison with US
The European treatment sample was compared with the US sam-ple with respect to average drinking. While men showed higher drinking levels with on average 23.9 g more alcohol being con-sumed per day (95% CI: 1.1–46.7 g/day), there was no significant difference for women (with a tendency of European patients drinking less). When age was added to the regression equation, it did not significantly contribute to explaining average level of drinking. Furthermore the average numbers of criteria for AD in the European sample and US sample were not statistically signi fi-cantly different.
DISCUSSION
Overall, patients from various specialized treatment facilities in eight European countries were interviewed with the following main characteristics:
• patients were predominantly men which is no surprise, given the fact that in all countries in Europe (World Health Organization, 2014) there are more alcohol consumers among men than among women, men have higher average levels of consumption, riskier drinking pat-terns and considerably more alcohol-attributable disease burden in general (Shield et al., 2012);
• a high prevalence of lower socio-economic classes and unemploy-ment, consistent with the fact that lower socio-economic status is associated with more negative consequences for the same amount of drinking compared with higher status (Mäkelä and Paljärvi, 2008;Probst et al., 2014);
• high average consumption of alcohol, and extensive binge drinking episodes, which are much higher than found in people with AD or AUD in general population surveys even if controlled for number of diagnostic criteria [e.g. NESARC in the US (Rehm et al., 2014a); or in Germany (Rehm et al., 2014c)];
• high comorbidity, both somatic and psychiatric, with associated high level of disability and health services utilization (Holder, 1998;Samokhvalov et al., 2010).
• Sampling from different treatment settings resulted in patients, who reported similar levels of consumption and comorbidity, except for severe mental distress which was found to be highest in inpatients.
Table 3. Patient characteristics and key health and alcohol variables by sex
Male (N = 1,277) Female (N = 488) All (N = 1,767)
12-months AU prevalencea% (CI) 95.0 (93.8–96.2) 91.7 (89.2–94.2) 94.1 (93.0–95.2)
Age mean (SD) 46.1 (10.0) 46.7 (10.3) 46.3 (10.1)
SES—self classified % (CI)
Above average 5.5 (4.2–6.8) 5.1 (3.2–7.1) 5.4 (4.3–6.5)
Average 48.7 (46.0–51.5) 54.5 (50.1–59.0) 50.3 (48.0–52.7)
Below average 45.8 (43.0–48.5) 40.3 (36.0–44.7) 44.3 (41.9–46.6)
Unemployed for health or other reason % (CI) 36.8 (34.2–39.5) 33.6 (29.4–37.8) 36.0 (33.7–38.2)
Smoking % (CI) 73.8 (71.4–76.3) 67.6 (63.4–71.7) 72.0 (70.0–74.2)
BMIbmean (SD) 25.5 (4.2) 24.3 (5.0) 25.2 (4.5)
Hypertensionb% (CI) 21.9 (19.3–24.4) 18.6 (14.8–22.4) 20.9 (18.9–23.0)
Liver problemsb% (CI) 21.1 (18.6–23.6) 15.6 (12.1–19.2) 19.6 (17.5–21.6)
Depressionb% (CI) 38.8 (35.8–41.7) 54.7 (49.8–59.5) 43.2 (40.7–45.8)
Anxietyb% (CI) 46.9 (43.8–49.9) 59.3 (54.5–64.1) 50.3 (47.8–52.9)
K10
Above cut-off for serious mental distress % (CI) 33.3 (30.7–35.9) 43.0 (38.6–47.4) 36.0 (33.8–38.3)
Total score mean (SD) 15.8 (9.8) 18.1 (9.9) 16.4 (9.9)
WHODAS 2.0 mean (SD)
Total score 17.3 (18.3) 19.7 (20.0) 18.0 (18.8)
Number of days of inability to carry out usual activities or work due to health condition
3.9 (7.5) 4.2 (7.8) 4.0 (7.6)
Amount of ethanol used daily (in gram) by drinkersamean (SD) 152.5 (122.9) 108.2 (85.0) 141.1 (116.0)
Chronic heavy drinkinga% (CI) at least 100 g ethanol daily 58.0 (55.0–60.9) 41.6 (36.5–46.6) 53.7 (51.2–56.3)
Binge drinkinga% (CI) at least one episode of 200 g ethanol
consumption weekly
46.6 (43.6–49.6) 28.2 (23.6–32.7) 41.9 (39.3–44.4)
CI = 95% CI based on standard error. SD = standard deviation. SES = socio-economic status. BMI = Body Mass Index. K10 = Kessler Psychological Distress Scale; cut-off for severe mental distress was 21 points in a total score range from 0 to 40. WHODAS 2.0 = World Health Organization Disability Assessment Schedule 2— total score range: 0–100.
aAnalyses were computed on patients reporting alcohol use of at least 10 g ethanol daily during the past 12 months, excluding 285 patients. bNot assessed in Poland.
The results of our study indicate a level of morbidity and severe loss of functionality, which explains why people after treatment have a much higher risk for mortality compared with people with AUD from the general population (Roerecke and Rehm, 2013). They are also consist-ent with the fact that heavy drinking is the underlying reason for the high level of comorbidity and disability [see also (Rehm et al., 2013a,
2014a)], and if these drinking levels are not reduced during treatment, they will lead to higher level of mortality as well (Roerecke et al., 2013). As this is thefirst large representative study on specialized care for AUD in several European countries, the average level of the drinking and co-morbidity is surprising; this is underlined by the fact that daily drinking levels in men were higher than in the US (see above).
Table 5. Variability of key alcohol measures by study site Amount of ethanol used daily
(in gram) by drinkersamean
(SD)
P-valueb Chronic heavy drinkinga
at least 100 g ethanol daily % (CI)
P-valuec Binge drinkingaat least one episode
of 200 g ethanol consumption weekly % (CI) P-valuec Austria 175.5 (121.1) 0.1700 76.9 (53.1–100.0) 0.0667 53.8 (25.6–82.1) 0.2312 France 139.4 (103.2) 0.9205 57.2 (51.3–63.1) 0.1643 36.9 (31.1–42.7) 0.1059 Germany 223.5 (133.7) <0.0001* 81.0 (75.8–86.1) <0.0001* 67.3 (61.1–73.4) <0.0001* Hungary 133.3 (116.0) 0.1404 49.8 (43.2–56.4) 0.0880 47.5 (40.9–54.1) 0.0914 Italy 149.7 (110.6) 0.2710 57.7 (50.4–65.1) 0.2662 34.9 (27.8–41.9) 0.0614 Latvia 96.9 (97.9) <0.0001* 36.6 (29.6–43.5) <0.0001* 37.1 (30.1–44.1) 0.0759 Poland 91.0 (83.2) <0.0001* 33.6 (27.5–39.8) <0.0001* 25.2 (19.5–30.9) <0.0001* Spain 148.5 (107.9) 0.4141 57.0 (49.1–65.0) 0.4034 42.3 (34.3–50.2) 0.9044 Total 141.1 (116.0) 53.7 (51.2–56.3) 41.9 (39.3–44.4)
SD = standard deviation. CI = 95% CI based on standard error.
aAnalyses were computed on patients reporting alcohol use of at least 10 g ethanol daily during the past 12 months, excluding 285 patients.
bANOVA run on amount of alcohol used daily, using study site, age and sex as factors. Overall model was significant and was followed by ANOVAs comparing
overall mean with mean of each study site, including age and sex as further factors.
cLogistic regression run on proportion of patients reporting chronic heavy drinking/binge drinking, using study site (dummy coded), age and sex as predictors.
Overall models were significant and were followed by logistic regressions using single study site dummy variables and sex and age as predictors (P-values presented). *Significant Bonferroni-adjusted P-value < 0.01/9 (number of ANOVAs/logistic regressions): <0.0011.
Table 4. Current DSM-IV AUD criteria experienced by sex
Male (N =1,277) Female (N = 488) All (N = 1,767)
At least one DSM-IV AUD criterion % (CI) 90.8 (89.2–92.4) 90.1 (87.5–92.8) 90.6 (89.3–92.0)
At least two DSM-IV AUD criteria % (CI) 84.1 (82.1–86.1) 82.5 (79.1–85.9) 83.7 (81.9–85.4)
Mean number of DSM-IV AUD criteria (range: 0–11) (SD) 5.5 (3.3) 5.2 (3.2) 5.4 (3.3)
DSM-IV AD % (CI)
Need for markedly increased amounts of alcohol to achieve intoxication or desired effect; or markedly diminished effect with continued use of the same amount of alcohol
67.3 (64.7–69.8) 67.4 (63.2–71.5) 67.3 (65.1–69.5)
The characteristic withdrawal syndrome for alcohol; or drinking (or using a closely related substance) to relieve or avoid withdrawal symptoms
54.7 (52.0–57.4) 52.5 (48.0–56.9) 54.1 (51.8–56.5) Drinking in larger amounts or over a longer period than intended 61.4 (58.7–64.1) 59.1 (54.7–63.5) 60.8 (58.5–63.1) Persistent desire or one or more unsuccessful efforts to cut down or
control drinking
59.3 (56.6–62.0) 59.7 (55.3–64.1) 59.4 (57.1–61.7) Important social, occupational or recreational activities given up or
reduced because of drinking
38.9 (36.3–41.6) 36.4 (32.1–40.7) 38.3 (36.0–40.6) A great deal of time spent in activities necessary to obtain alcohol, to use it
or to recover from the effects of drinking
41.5 (38.8–44.2) 41.5 (37.1–45.9) 41.6 (39.3–43.9) Continued drinking despite knowledge of having a persistent or recurrent
physical or psychological problem that is likely to be caused or exacerbated by drinking
42.5 (39.7–45.2) 41.9 (37.5–46.3) 42.3 (40.0–44.6)
Mean number of DSM-IV AD symptoms (range: 0–7) (SD) 3.7 (2.3) 3.6 (2.4) 3.6 (2.4)
DSM-IV alcohol abuse % (CI)
Recurrent use of alcohol resulting in a failure to fulfill major role obligations at work, school or home
75.5 (73.1–77.8) 73.2 (69.2–77.1) 74.9 (72.8–76.9) Recurrent alcohol use in situations in which it is physically hazardous 45.7 (42.9–48.4) 33.6 (29.4–37.8) 42.4 (40.1–44.7)
Recurrent alcohol-related legal problems 23.3 (20.9–25.6) 14.2 (11.1–17.3) 20.8 (18.9–22.7)
Continued alcohol use despite having persistent or recurrent social or interpersonal problems caused or exacerbated by the effects of alcohol
43.8 (41.1–46.6) 42.1 (37.7–46.5) 43.4 (41.1–45.7)
Mean number of DSM-IV alcohol abuse symptoms (range: 0–4) (SD) 1.9 (1.3) 1.6 (1.2) 1.8 (1.3)
DSM-IV = Diagnostic and Statistic Manual of Mental Disorders, 4th edition. AUD = Alcohol use disorder, comprised of AD or alcohol abuse diagnoses. CI = 95% CI based on standard error. SD = standard deviation.
Limitations
Before we discuss the implications of ourfindings, we would like to point out limitations: while this study is to our knowledge the largest representative study on patients in AUD treatment in different Euro-pean countries, the sampling was driven by the local systems, and the resulting samples had some degree of heterogeneity. Part of this re-flects the reality of varying treatment systems and guidelines in Europe (Rehm et al., 2013b), another part may also reflect decisions of the country’s principal investigators in our study. To achieve statistical representativeness for the entire EU in the sense of a roster of all SC facilities and a probability sampling scheme across all possible facil-ities was not possible, as such a roster does not exist; and partly seems to be impossible due to different definitions of what constitutes specialized treatment in various countries. Nevertheless, we achieved regionally and for France, Hungary and Latvia even nationally repre-sentative samples with sufficient response rates of the most common treatment options available to people with AUDs in the selected regions.
The interpretation of associations presented above cannot be in-terpreted as to reflect causality, as we base all our conclusions on cross-sectional data. Furthermore, some of our comparisons are suf-fering from a general scarcity of natural history studies of AUDs [such as (Vaillant, 1995)], indicating that more research is needed in this area.
CONCLUSION
The present publicationfills a gap in the literature giving characteris-tics about typical treatment populations in various European coun-tries. While treatment systems vary considerably, one characteristic was consistent across all countries and regions: patients in European specialized care settings for AUDs had high average alcohol consump-tion and extended binges before entering treatment, and showed a high degree of comorbidity. As shown above, the levels of alcohol con-sumption and comorbidity in our sample were higher than the levels in samples of people with untreated AUDs (Rehm et al., 2015a). In other words, treatment seems to be sought by patients and/or indi-cated by professionals only when problems with consumption and as-sociated comorbidity move beyond a high threshold. This observation is consistent with the overall low treatment rate for AUD (Alonso et al., 2004;Rehm et al., 2013c). How could this rate be increased? Family physicians as the entry point to the health care system in many countries are a pivotal cornerstone to earlier detection of alco-hol problems followed by brief intervention or referral to specialized care (Babor et al., 2001,2007). Even though there is evidence that early detection and brief interventions is effective in reducing drinking (Kaner et al., 2007) and alcohol-attributable harm (Rehm and Roerecke, 2013;Rehm et al., 2013c), implementation of screening for AUD in primary care has been slow in Europe. Catalonia seems to be leading the way here, with almost 1,500,000 people screened for problem use in 2012 (Generalitat de Catalunia, 2013), but studies on impact of these public health measures are still lacking. Overall, given the high comorbidity and disability shown here, health care sys-tems in the EU shouldfind a way to detect cases of AUD earlier and include them into the treatment system.
SUPPLEMENTARY MATERIAL
Supplementary material is available at Alcohol and Alcoholism online.
ACKNOWLEDGEMENTS
We acknowledge the following individuals who have contributed to this project in collecting the data: Dr Rosanna Purich, Dr Adriano Segatori, Dr Gianni Canzian, Sergio Paulon and Dr Paolo Cimarosti (Project Team Italy).
FUNDING
This work was supported by an investigator initiated grant to thefirst author and the GWT-TUD (Gesellschaft für Wissens- und Technologietransfer der TU Dresden mbH—company with limited liabilities for transferring knowledge and technology of the Dresden University of Technology) by Lundbeck (grant number 414209). The study sponsor has no role in study design; collection, ana-lysis and interpretation of data. The study sponsor also had no role in writing of the report; and the decision to submit the paper for publication. The corre-sponding author confirms that the authors had full access to the data in the study at all times, and hadfinal responsibility for the decision to submit for pub-lication. The corresponding author hereby states that no author has been reim-bursed for writing this manuscript.
CONFLICT OF INTEREST STATEMENT
(ALPHABETICAL ORDER OF ABBREVIATED
NAMES)
A.A.: reports grants from Lundbeck during the conduct of the study and travel funds from Osservatorio Permanente Giovani e Alcool, Roma, Italy outside the submitted work.
A.G.: reports grants and personal fees from Lundbeck and D&A Pharma during the conduct of the study and grants from TEVA and personal fees from Abbivie outside the submitted work.
A.J.: reports personal fees and non-financial support from Lundbeck and non-financial support from Astra Zeneca, Sanofi Aventis, Polpharma and Eli Lilly outside the submitted work.
C.P.: no potential conflict of interest stated.
F.P.: reports personal fees from Ethypharm and Merck-Serono, non-financial support from D&A Pharma and personal fees and non-financial support from Lundbeck outside the submitted work.
F.S.: no potential conflict of interest stated. F.V.: no potential conflict of interest stated.
H.-J.A.: reports personal fees and non-financial support from Lundbeck, Merck-Serono and D&A Pharma and personal fees from Ethypharm and Bio-projet outside the submitted work.
H.-U.W.: reports being advisory board member for Hoffmann La Roche, Lund-beck and Servier outside the submitted work.
I.L.: reports personal fees, non-financial support from Lundbeck and Reckitt Benckiser outside the submitted work.
J.M.: no potential conflict of interest stated.
J.R.: reports grants from GWT-TUD during the conduct of the study and grants, personal fees and being board member (Nalmefene) for Lundbeck outside the submitted work.
K.D.S.: no potential conflict of interest stated. L.M.: no potential conflict of interest stated. L.P.: no potential conflict of interest stated. M.T.: no potential conflict of interest stated.
M.W.: reports personal fees from AOP Orphan, Berlin Chemie, Janssen, Lund-beck, D&A Pharma, Chiesi, Reckitt Benckiser, Sanofi Aventis and Servier out-side the submitted work.
N.K.: no potential conflict of interest stated.
P.S.: reports grants from University of Dresden during the conduct of the study and being primary care board member for Lundbeck outside the submitted work.
R.D.V.: no potential conflict of interest stated. S.S.: no potential conflict of interest stated. U.F.: no potential conflict of interest stated. Z.E.: no potential conflict of interest stated.
REFERENCES
Agència de salut pública de Barcelona. (2012) Tractament en Centres de Drogodependències. [ONLINE] Available from: http://www.aspb.cat/ quefem/sisalut/SISalutLlibresIndicadors/LlibreTractamentDrogues.html
[16 December 2014].
Alonso J, Angermeyer MC, Bernert S, et al. ESEMeD/MHEDEA Investigators. (2004) Use of mental health services in Europe: results from the European Study of the Epidemiology of Mental Disorders (ESEMeD) project. Acta Psychiat Scand109:47–54.
Babor TF, Higgins-Biddle JC, Saunders JB, et al. (2001) Audit—The Alcohol Use Disorders Identification Test: Guidelines for Use in Primary Care, Vol.2. Geneva: World Health Organization.
Babor TF, McRee BG, Kassebaum PA, et al. (2007) Screening, Brief Interven-tion, and Referral to Treatment (SBIRT): toward a Public Health approach to the management of substance abuse. Subst Abuse Misuse28:7–30. Bottlender M, Köhler J, Soyka M. (2006) The effectiveness of psychosocial
treatment approaches for alcohol dependence—a review. [Article in Ger-man]. Fortschritte der Neurologie-Psychiatrie74:19–31.
Caetano R, Babor TF. (2006) Diagnosis of alcohol dependence in epidemio-logical surveys: an epidemic of youthful alcohol dependence or a case of measurement error? Addiction101:111–4.
Drummond C, Gual A, Goos C, et al. (2011) Identifying the gap between need and intervention for alcohol use disorders in Europe. Addiction1:31–6. European Commission. (2004) The State of Mental Health in the European
Union. Luxembourg: European Commission.
Fazel S, Bains P, Doll H. (2006) Substance abuse and dependence in prisoners: a systematic review. Addiction101:181–91.
Fazel S, Khosla V, Doll H, et al. (2008) The prevalence of mental disorders among the homeless in Western Countries: systematic review and meta-regression analysis. PLoS Medicine5:e225.
Generalitat de Catalunia. (2013) Memoria 2012. Institut Catala de la Salut. Barcelona: Departament de Salut.
Grant B, Moore T, Kaplan K. (2003) Source and Accuracy Statement: Wave 1 National Epidemiologic Survey on Alcohol and Related Condition (NESARC). Bethesda, MD: National Institute on Alcohol Abuse and Alcoholism.
Grant BF, Dawson DA, Stinson FS, et al. (2004) The 12-month prevalence and trends in DSM-IV alcohol abuse and dependence: United States, 1991–1992 and 2001–2002. Drug Alcohol Depend 74:223–34.
Holder HD. (1998) Cost benefits of substance abuse treatment: an overview of results from alcohol and drug abuse. J Mental Health Policy Econ 1:23–9.
Italian Ministry of Health. (2013) Relazione del ministro della salute al parla-mento sugli interventi realizzati ai sensi della legge 30.3.2001 n.125“legge quadro in materia di alcol e problemi alcolcorrelati” dati relativi all’anno 2012 [Report of Ministry of Health to Parliament on Interventions imple-mented after the Frame Law Concerning Alcohol and Alcohol-Related Pro-blems, 30.3.2001 n.125 "general law about alcohol and alcohol-related problems”. Data for the year 2012]. Rome, Italy: Ministry of Health to Parliament on Interventions implemented after the Frame Law Concerning Alcohol and Alcohol-Related Problems.
Kaner EF, Beyer F, Dickinson HO, et al. (2007) Effectiveness of brief alcohol interventions in primary care populations. Cochrane Database Syst Rev 18:CD004148.
Kessler RC, Andrews G, Colpe LJ, et al. (2002) Short screening scales to moni-tor population prevalences and trends in non-specific psychological distress. Psychol Med32:959–76.
Lumley T. (2004) Analysis of Complex Survey Samples. J Stat Softw9:1–19. Mäkelä P, Paljärvi T. (2008) Do consequences at a given pattern of drinking
vary by socioeconomic group? A mortality and hospitalization follow-up of the Finnish drinking habits surveys. J Epidemiol Community Health 62:728–33.
Mann K, Lemenager T, Hoffmann S, et al. (2013) Results of a double-blind, placebo-controlled pharmacotherapy trial in alcoholism conducted in Germany and comparison with the US COMBINE study. Addict Biol 18:937–46.
Manthey J, Gual A, Jakubczyk A, et al. (2014) Alcohol Dependence in Primary Care (APC): Design, Instruments and First Results of A Cross-Sectional European Study. Toronto, Canada: Center of Addiction and Mental Health.
Picci RL, Vigna-Taglianti F, Oliva F, et al. (2012) Personality disorders among patients accessing alcohol detoxification treatment: prevalence and gender differences. Compr Psychiatry53:355–63.
Probst C, Roerecke M, Behrendt S, et al. (2014) Socioeconomic differences in alcohol-attributable mortality compared to all-cause mortality: a systematic review and meta-analysis. Int J Epidemiol43:1314–27.
R Development Core Team. (2014) R: A Language and Environment for Statistical Computing (Version 3.1.0). Vienna, Austria: R Foundation for Statistical Computing.
Rehm J, Roerecke M. (2013) Reduction of drinking in problem drinkers and all-cause mortality. Alcohol Alcohol48:509–13.
Rehm J, Room R, Van den Brink W, et al. (2005) Alcohol use disorders in EU countries and Norway: an overview of the epidemiology. Eur Neuropsychopharmacol15:377–88.
Rehm J, Shield KD, Rehm MX, et al. (2012) Alcohol Consumption, Alcohol Dependence, and Attributable Burden of Disease in Europe: Potential Gains From Effective Interventions for Alcohol Dependence. Toronto, Canada: Centre for Addiction and Mental Health.
Rehm J, Marmet S, Anderson P, et al. (2013a) Defining substance use disorders: do we really need more than heavy use? Alcohol Alcohol48:633–40. Rehm J, Rehm MX, Alho H, et al. (2013b) Alcohol dependence treatment in the
EU: a literature search and expert consultation about the availability and use of guidelines in all EU countries plus Iceland, Norway, and Switzerland. Int J Alcohol Drug Res2:53–67.
Rehm J, Shield KD, Rehm MX, et al. (2013c) Modelling the impact of alcohol dependence on mortality burden and the effect of available treatment inter-ventions in the European Union. Eur Neuropsychopharmacol23:89–97. Rehm J, Anderson P, Gual A, et al. (2014a) The tangible common denominator
of substance use disorders: a reply to commentaries to Rehm et al. (2013). Alcohol Alcohol49:118–22.
Rehm J, Dawson D, Frick U, et al. (2014b) Burden of disease associated with alcohol use disorders in the United States. Alcohol Clin Exp Res 38:1068–77.
Rehm J, Probst C, Kraus L, et al. (2014c) The addiction concept revisited. In Anderson P, Bühringer G, Colom Js (eds). Reframing Addiction: Policies, Processes and Pressures, pp. 103–17. Barcelona, Spain: ALICE RAP. Rehm J, Allamani A, Elekes Z, et al. (2015a) Do general practitioners recognize
alcohol dependence? A large cross-sectional study in six European coun-tries. Ann Fam Med13:28–32.
Rehm J, Anderson P, Barry J, et al. (2015b) Prevalence of and potential in fluen-cing factors for alcohol dependence in Europe. Eur Addict Res21:6–18. Robins LN, Wing J, Wittchen HU, et al. (1988) The Composite International
Diagnostic Interview. An epidemiologic instrument suitable for use in con-junction with different diagnostic systems and in different cultures. Arch Gen Psychiat45:1069–77.
Roerecke M, Rehm J. (2013) Alcohol use disorders and mortality—A systematic review and meta-analysis. Addiction108:1562–78.
Roerecke M, Rehm J. (2014) Cause-specific mortality risk in alcohol use dis-order treatment patients: a systematic review and meta-analysis. Int J Epidemiol43:906–19.
Roerecke M, Gual A, Rehm J. (2013) Reduction of alcohol consumption and subsequent mortality in alcohol use disorders: systematic review and meta-analysis. J Clin Psychiatry74:e1181–9.
Röske K, Riedel J, Hapke U, et al. (2004) Characteristics of patients with alco-hol or drug problems in medical practices with emphasis on“Addiction” in Mecklenburg-Vorpommern. Gesundheitswesen66:190–5.
Samokhvalov AV, Popova S, Room R, et al. (2010) Disability associated with alcohol abuse and dependence. Alcohol Clin Exp Res34:1871–8. Shield K, Rehm J. (2012) Difficulties with telephone-based surveys on alcohol in
high-income countries: the Canadian example. Int J Methods Psychiatr Res 21:17–28.
Shield KD, Kehoe T, Gmel G, et al. (2012) Societal burden of alcohol. In Anderson P, Møller L, Galea Gs (eds), Alcohol in the European Union.
Consumption, Harm and Policy Approaches. Copenhagen, Denmark: World Health Organization Regional Office for Europe, 10–28. Stata Corporation. (2011) Stata Statistical Software (Version 12). College
Station, TX: Stata Corporation LP.
UKATT Research Team. (2005) Cost effectiveness of treatment for alcohol problems: findings of the randomised UK alcohol treatment trial (UKATT). BMJ10:544.
Üstün TB, Kostanjsek N, Chatterji S, et al. (2010) Measuring Health and Disability. Manual for WHO Disability Assessment Schedule WHODAS 2.0. Geneva, Switzerland: World Health Organization.
Vaillant GE. (1995) Natural History of Alcoholism Revisited. Cambridge, MA: Harvard University Press.
World Health Organization. (2014) Global Status Report on Alcohol and Health. Geneva, Switzerland: World Health Organization.